

West Contra Costa Transportation Commission
Richmond Parkway Transit Plan — Board briefing 2
Existing conditions and what the engagement was finding.
Presentation · 2023 · 22 figures · about 3 min to read
Existing conditions and what the engagement was finding.
Superseded — Kept for the record. A later document replaces it. Read the document that replaced it: Richmond Parkway Transit Plan
WCCTAC Board
Meeting #2
RICHMOND PARKWAY TRANSPORTATION PLAN September 29, 2023 www.wcctac.org Existing & Future Conditions and Phase 1 Engagement
Agenda
Project Recap Existing & Future Conditions Phase 1 Engagement Input Next Steps
RICHMOND PARKWAY TRANSPORTATION PLAN
Project Recap
About the Project
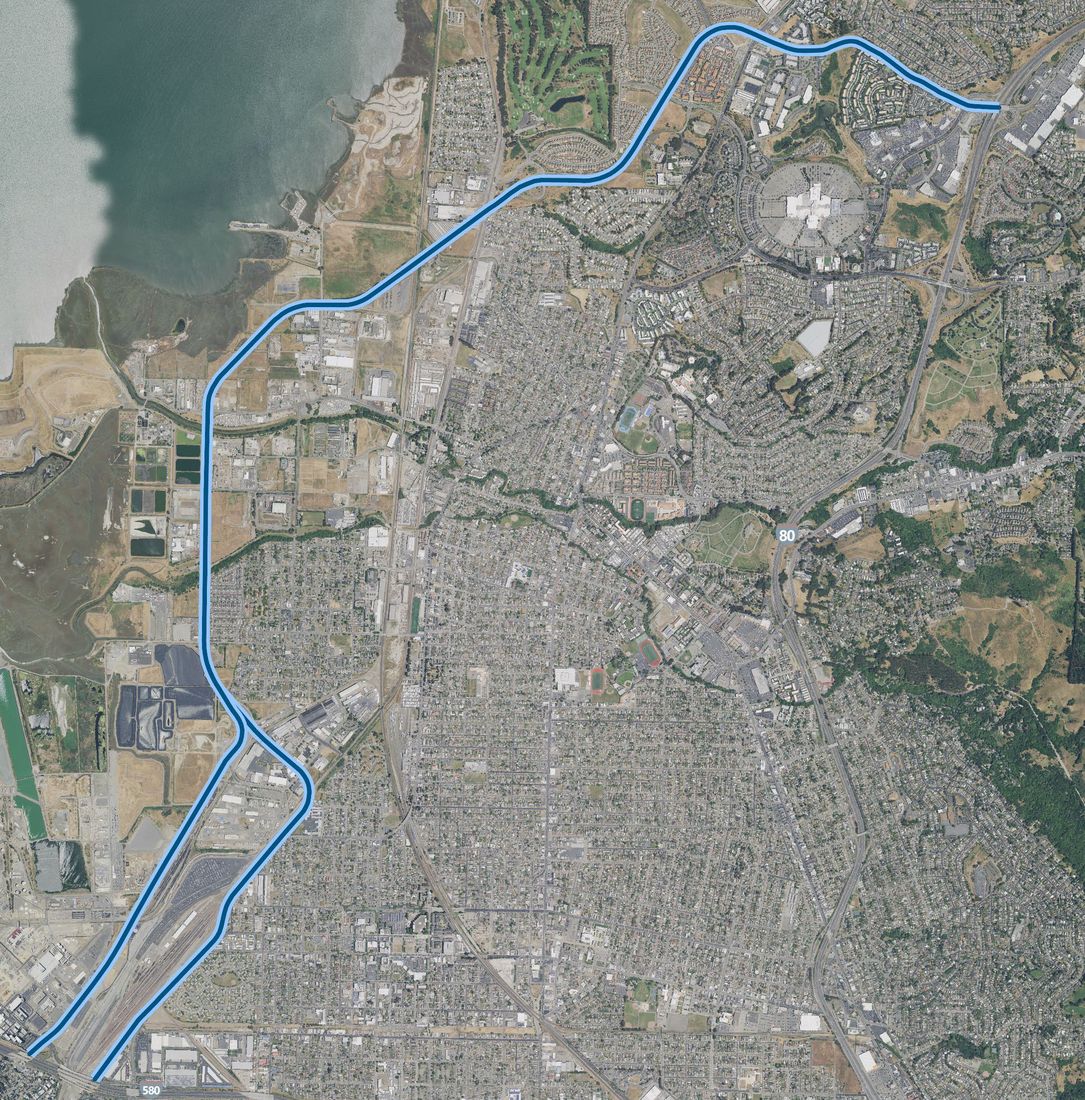
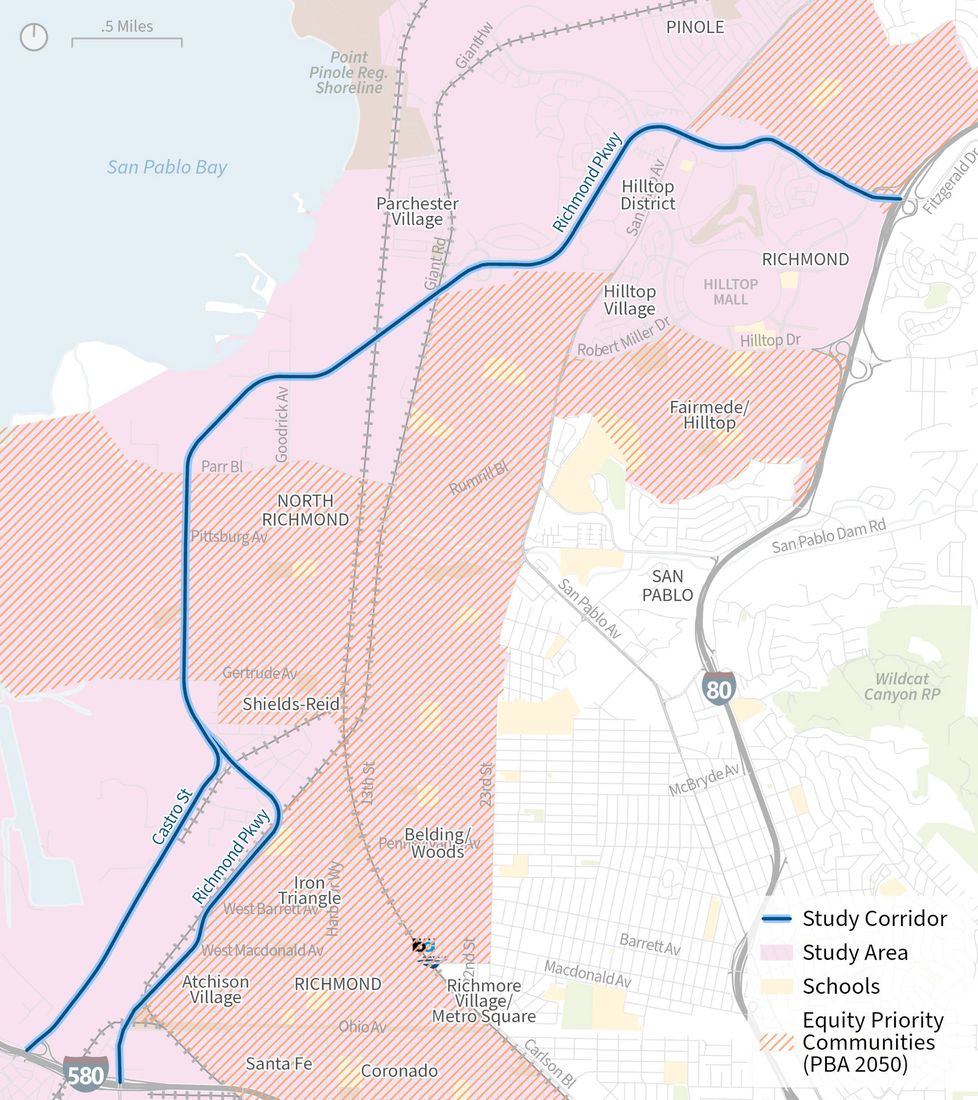
Corridor
- Includes Richmond Parkway and
Castro Street between I-580 and I-80
- Falls within City of Richmond and
Unincorporated Contra Costa County
- Impacts Equity Priority Communities
- Local and regional connector
- Includes segments of the Bay Trail
- Planned growth
Schedule
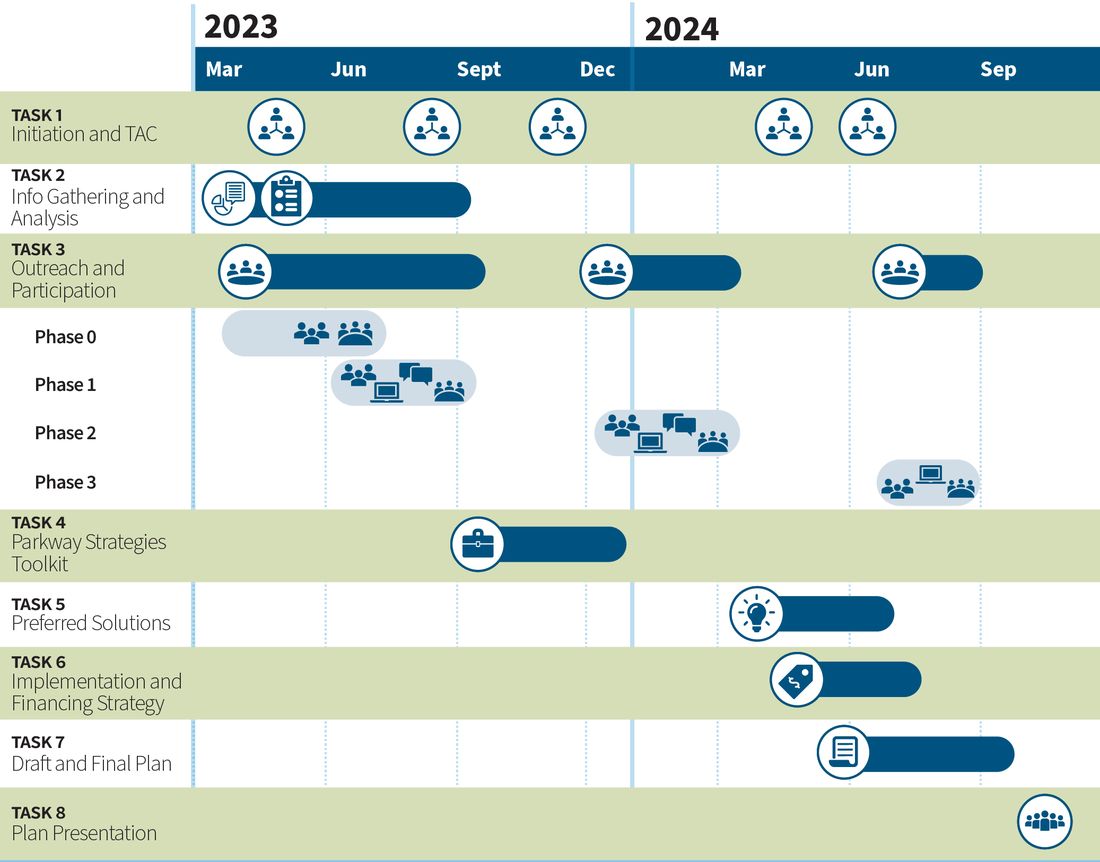
Opportunities for Public Input
Original PDF, page 6
RICHMOND PARKWAY TRANSPORTATION PLAN
Existing & Future Conditions
Existing & Future Conditions Topic Areas
Safe Streets Public Health Transit Traffic Signals Cars & Trucks Bike & Pedestrian Network
Existing & Future Conditions Topic Areas
Safe Streets Public Health Transit Traffic Signals Cars & Trucks Bike & Pedestrian Network
Recap of Safety and
Bike & Ped Network
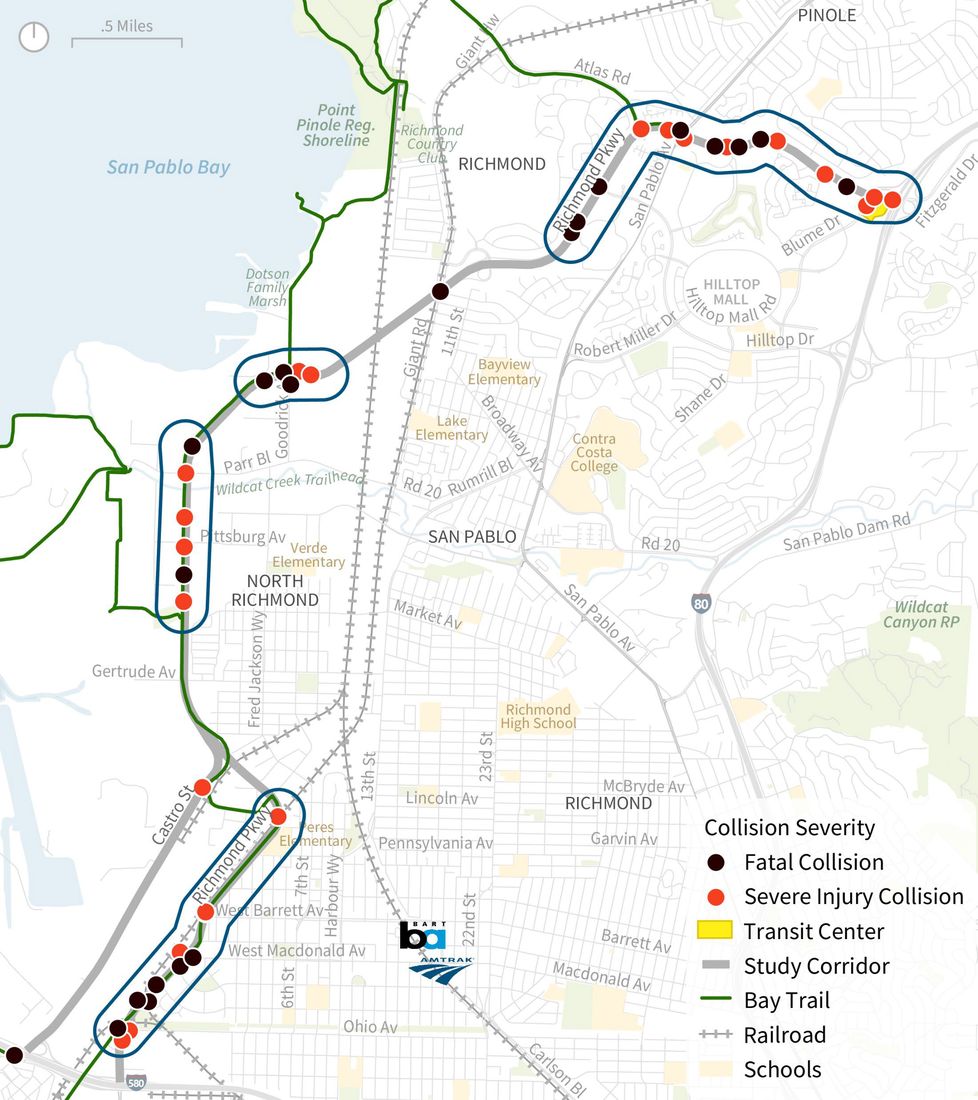
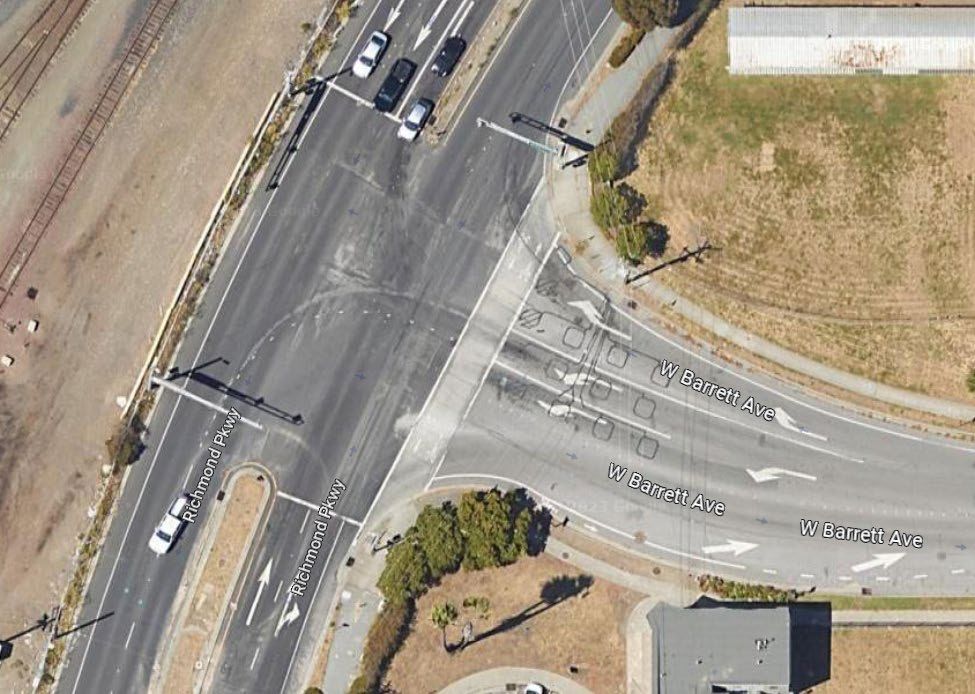
- Between 2011 and 2020, 46 people were killed or severely injured in collisions along the corridor
- Unsafe speed is the leading primary collision factor (28%) for these collisions
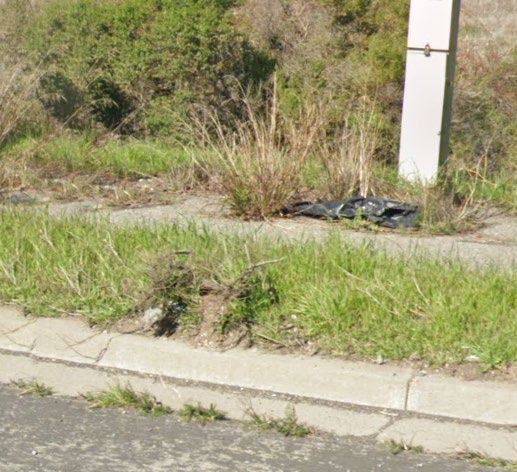
- Limited and ill-maintained infrastructure on the Bay Trail, sidewalks, and crossings make active transportation challenging for all ages and abilities
Source: TIMS (2011-2020). Poor pavement quality High vehicle turn speeds
Transit Service on the
Parkway
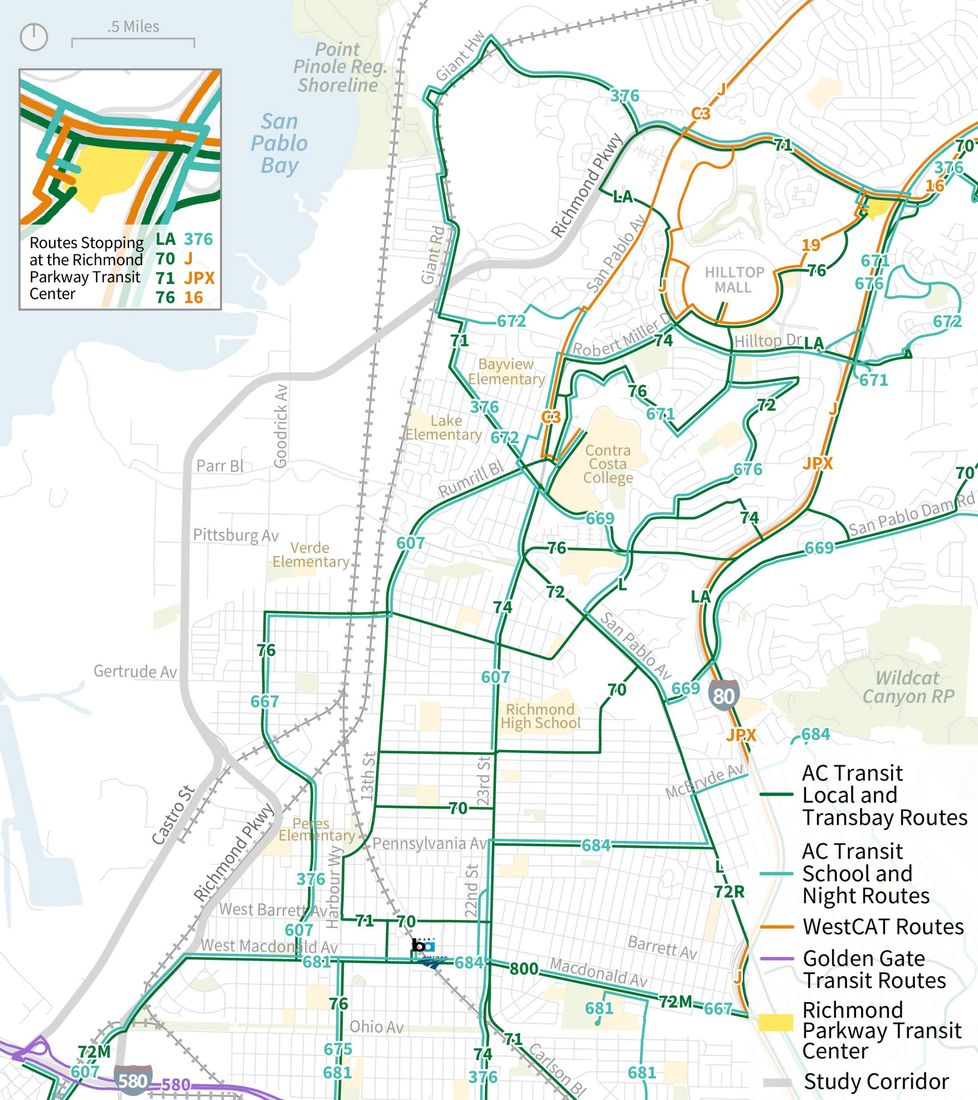
- Although the study area has decent service coverage, bus service on the corridor is only provided on the northern and southern ends
11 bus routes stop on the corridor, including 8 routes at the Richmond Parkway Transit Center
- Most stops along the corridor are missing shelters and high-visibility crosswalks at the intersection
- Opportunities to improve bicycle and walking access to the Transit Center, including a formal pedestrian access point at the Parkway and higher quality bikeways
Sources: AC Transit (2023), WestCAT (2023), Golden Gate Bridge, Highway & Transportation District (2023)
Original PDF, page 11
Existing Car Travel
Source: Streetlight, 2022.
- Over 25,000 cars travel on the Parkway on weekdays (Fehr & Peers, May 2023)
- Commute patterns on the Parkway reflect highest demand northbound in the afternoon
- Drivers typically use the Parkway for trips that start or end in the study area rather than as a freeway-to- freeway connector
Less than a third of northbound PM drivers travel from the I-580 interchange and get onto I-80 (Streetlight, 2022)
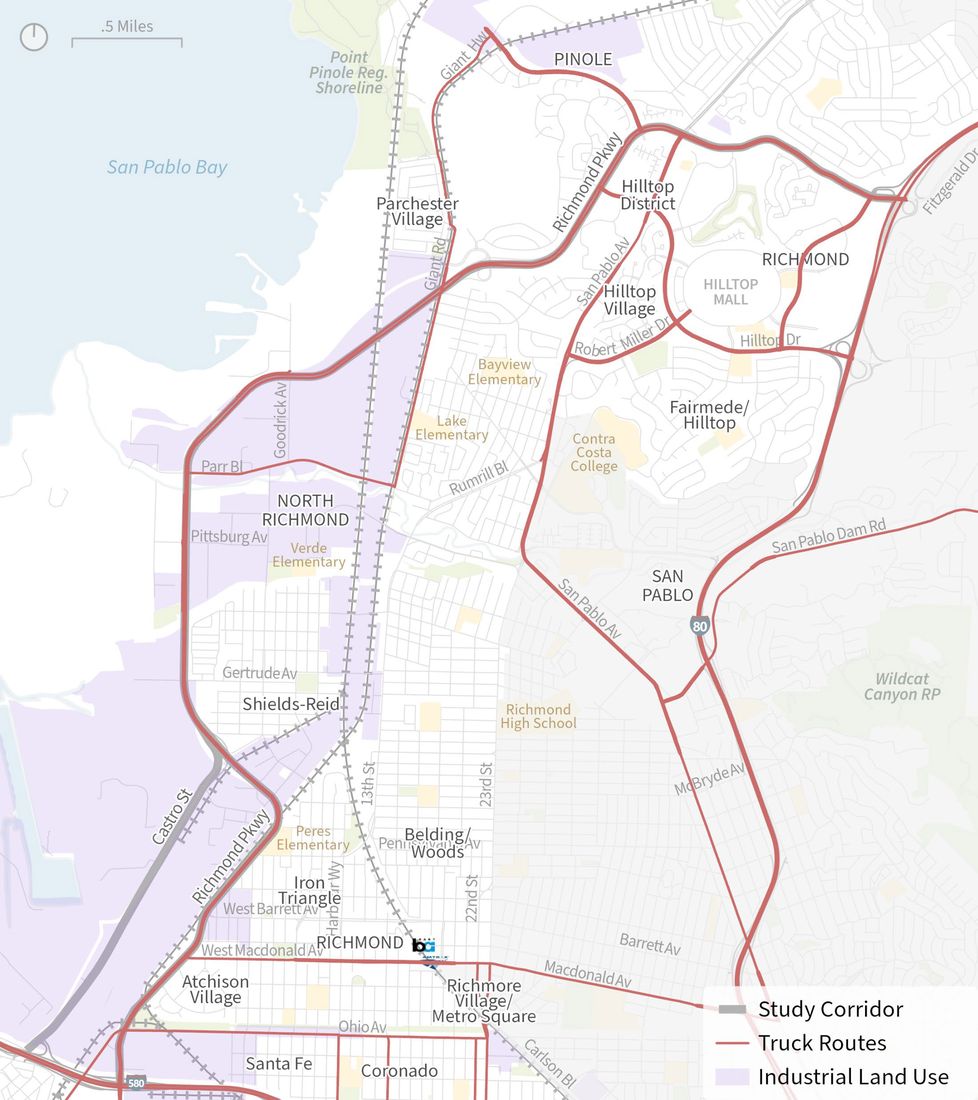
Existing Truck Travel
Source: Richmond General Plan 2030, 2016.
About 2,000 trucks travel on the Parkway on weekdays (7% of total vehicle travel) (Fehr & Peers, May 2023)
Industrial uses and the nearby port generate truck trips along the corridor
Most truck traffic is concentrated in the morning commute and midday periods (Streetlight, 2022)
More than 60% of trucks use the corridor to access or depart from destinations in the study area (Streetlight, 2022)
Original PDF, page 13
| Study Corridor Direction | Existing Travel Time (minutes) | Future Travel Time (minutes) | ||
|---|---|---|---|---|
| AM Peak | PM Peak | AM Peak | PM Peak | |
| Northbound | 12 | 26 | <20 | >60 |
| Southbound | 14 | 13 | 30-40 | 20-30 |
Existing and Future (2040) Travel Times
- Given the high level of development and land use growth expected in the area, additional vehicle volumes will increase travel times in the future along the corridor
- Drivers could see the longest travel times in the afternoon in the northbound direction
- Southbound AM could also see at least a 15-minute increase in travel time
Note: These conditions are based on the CCTA travel demand model and future land use growth in the area. No transportation projects on Richmond Parkway are modeled as part of this analysis.
Source: Fehr & Peers, 2023
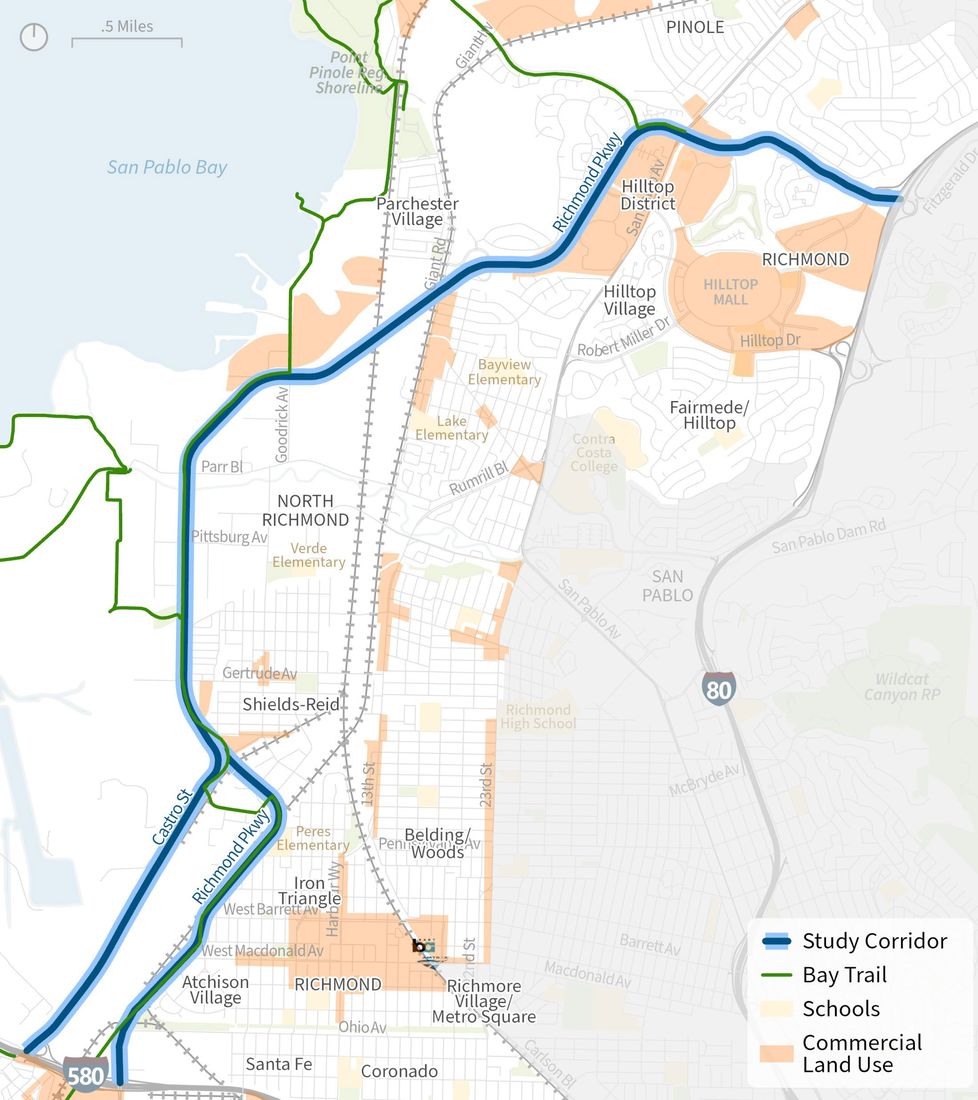
Traffic Signals
Of the 23 signals along the corridor:
70% do not have bike detection
65% do not have a pedestrian countdown signal
39% do not have a battery backup
Signals along most of the corridor are not coordinated
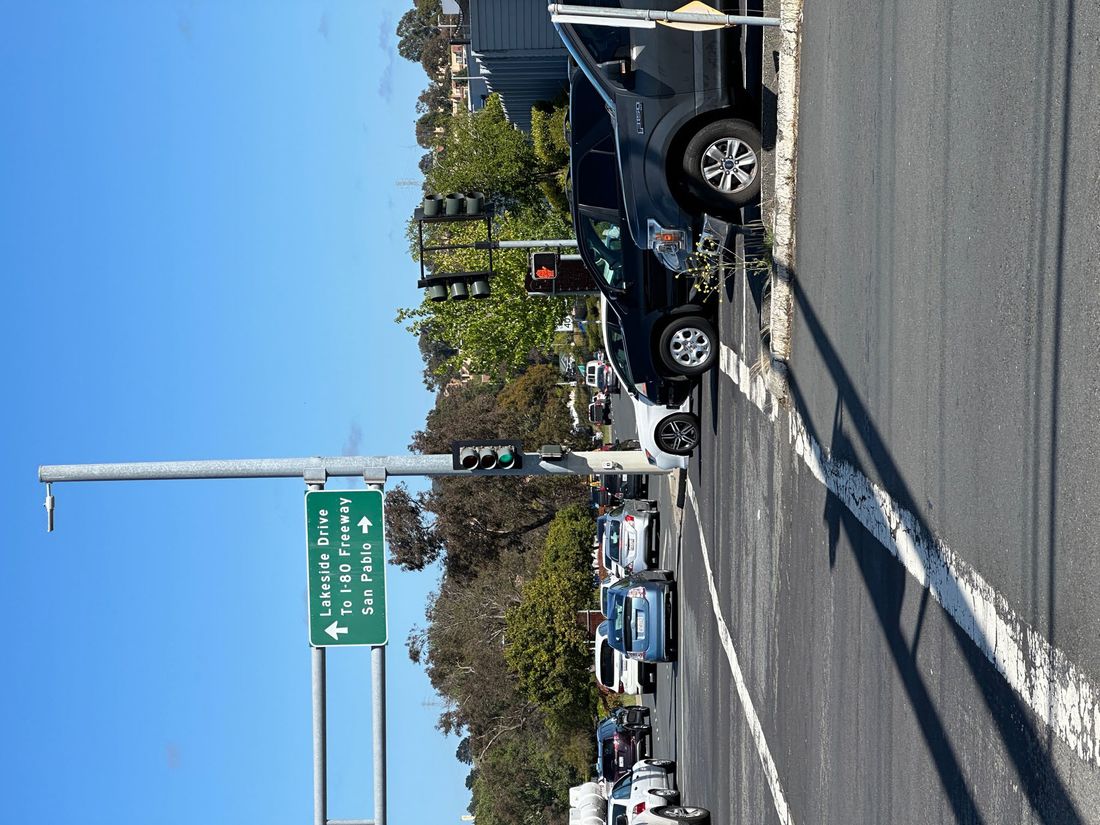
To keep traffic moving, green times along the Parkway can be 30 seconds longer compared to other City signals. This results in more delay for all users entering or crossing the Parkway.
Original PDF, page 15
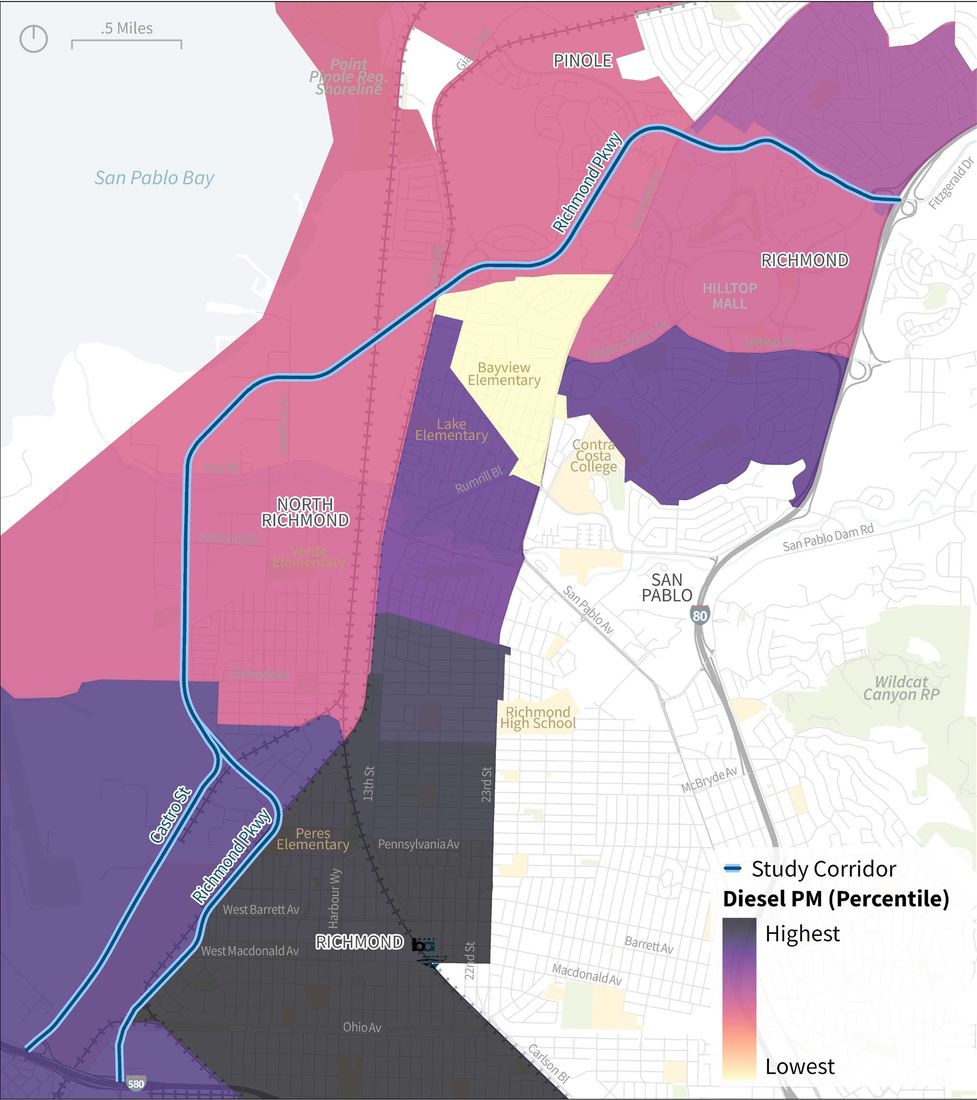
Diesel Particulate
Matter (Diesel PM)
Source: Office of Health Hazard Assessment, CalEnviroScreen 4.0: Diesel Particulate Matter (2021).
- Diesel PM is a toxic air contaminant produced by exhaust of trucks, trains, ships, and equipment with diesel engines.
- Diesel PM concentration around the
Parkway ranges from 0.08 to 0.98 tons per year. This is greater than 78% of communities statewide.
- Higher levels of Diesel PM can cause eye, throat, and nose irritation and contribute to asthma attacks, heart and lung disease, and lung cancer.
- North Richmond’s asthma rate is greater than 98% of other communities statewide
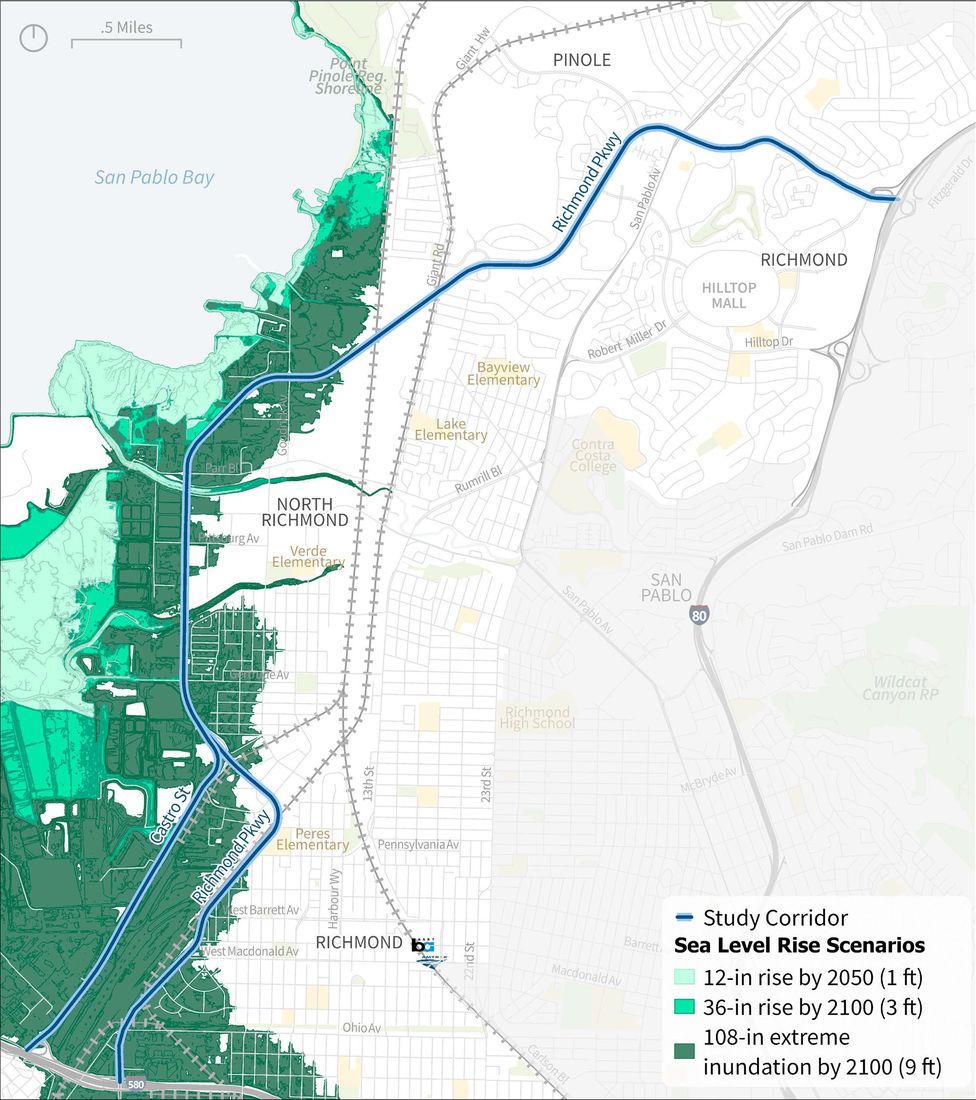
Sea Level Rise
- Forecasts anticipate up to 12-in of sea level rise by 2050, and 36-in by 2100, directly affecting the area west of the corridor
- Flooding and inundation would affect roadways, property, utilities and critical infrastructure, emergency services, and evacuations
Already seeing impacts of this at the Wildcat Creek Trail crossing Source: Adapting to Rising Tides, Bay Area Sea Level Rise Analysis and Mapping Project (2017).
Original PDF, page 17
RICHMOND PARKWAY TRANSPORTATION PLAN
Phase 1 Engagement Input
| Phase 1 | Phase 2 Phase | |
|---|---|---|
| IDENTIFY NEEDS • 3 Pop-up events and 3 community meetings • Digital engagement • WCCTAC Board Mtg #2 • PAG Mtg #2 • TAC Mtg #2 |
PAG Mtg #4
Digital Engagement
TAC Mtg #4-5
WCCTAC Board Mtg #4
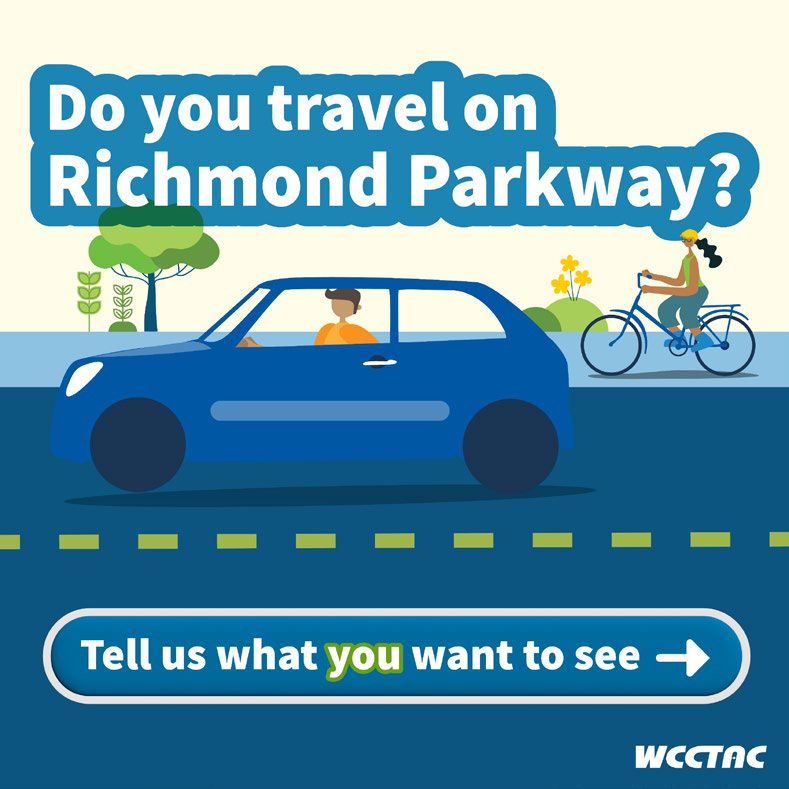
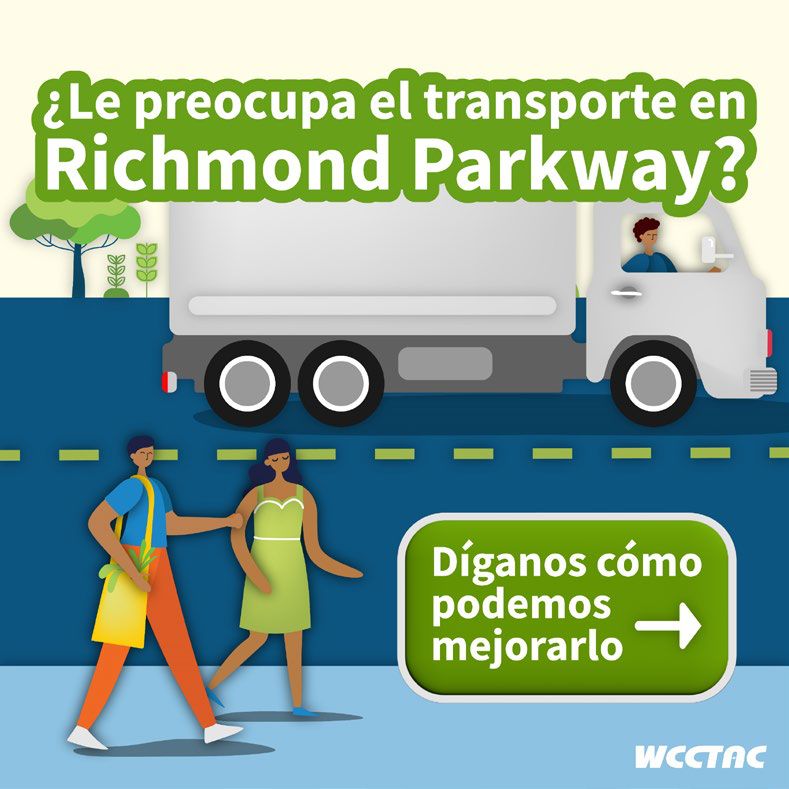
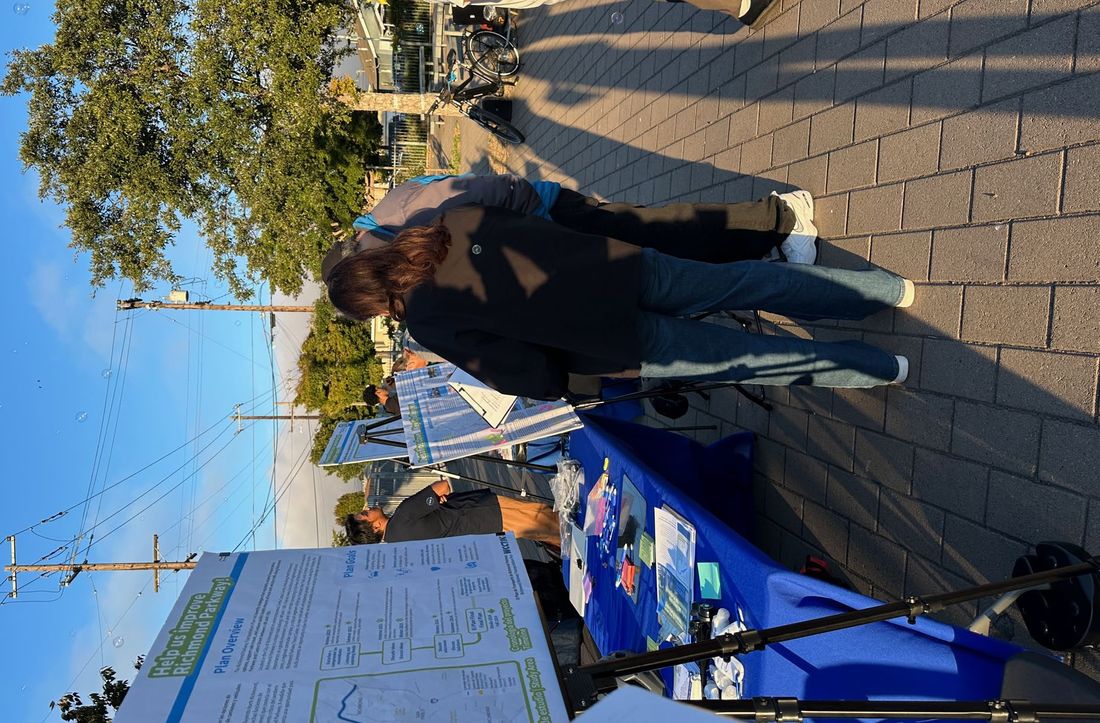
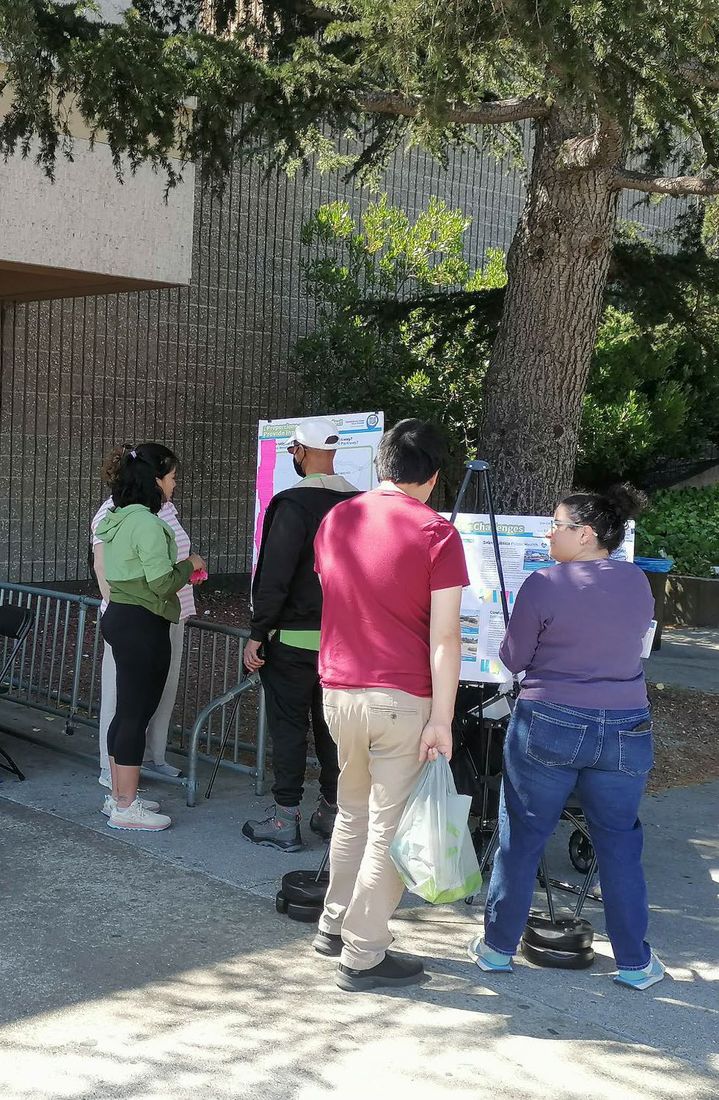
Public Engagement Plan
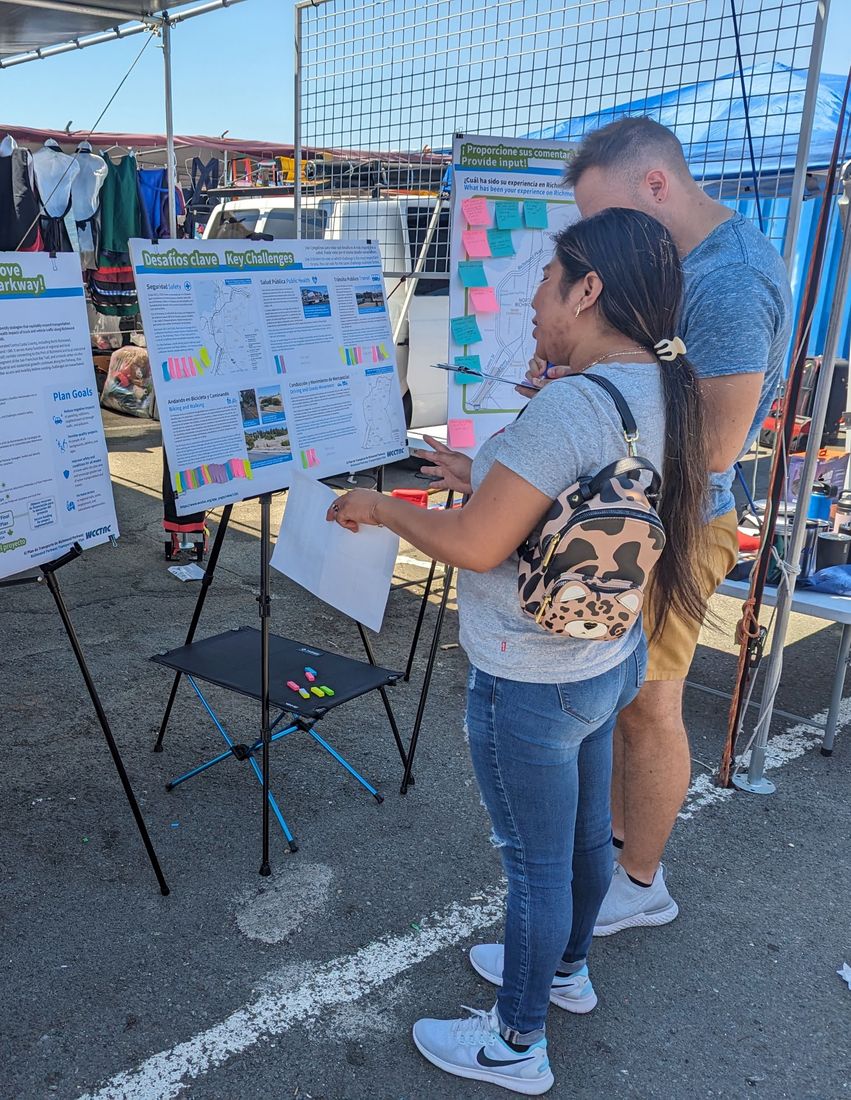
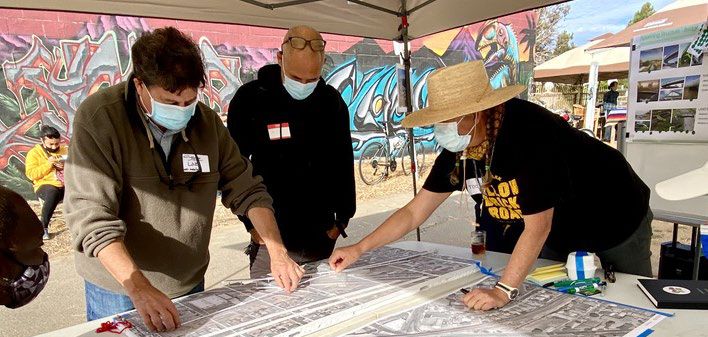
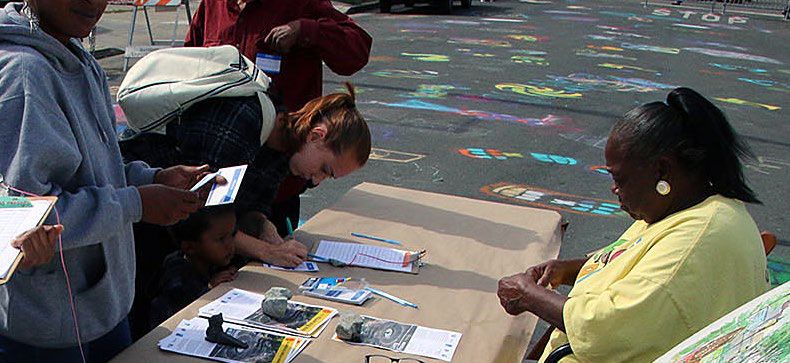
Phase 1 Engagement:
Pop-Ups & Community Meetings
Pop-Up Events: Aug 2023
North Richmond Flea Market (North Richmond)
Thrive Thursdays (Coronado)
Wal-Mart (Hilltop) MTC/Rich City Rides Bike Ride: Aug 2023 Community Meetings: Sept 2023
North Richmond Municipal Advisory Council
Parchester Village Neighborhood Council
Iron Triangle Neighborhood Council Public Advisory Group Meeting: Sept 2023
Original PDF, page 20
Phase 1 Engagement:
Digital Engagement
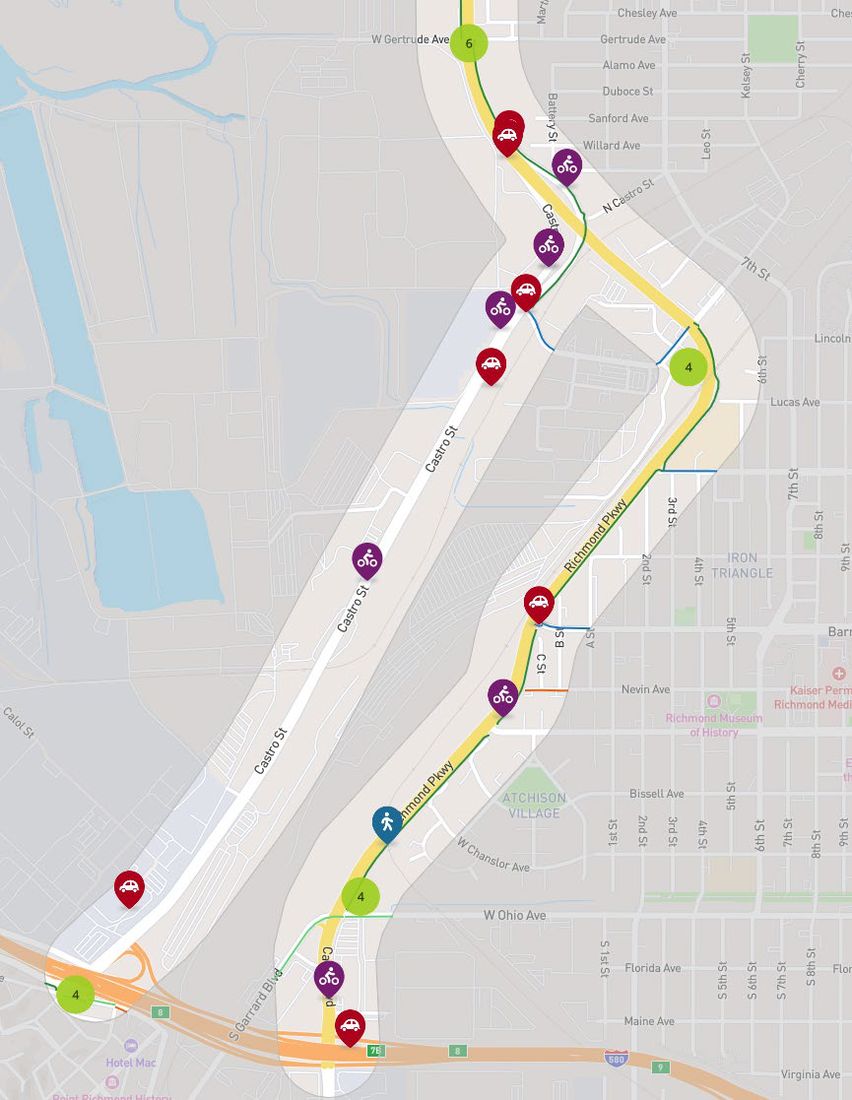
- Webmap open from June 15th – Sept 4th
- 109 comments received
- 1,754 webmap visitors
983 visitors learned about webmap through our social media ads
Feedback Themes
Most comments received from the public referenced four topic areas. Biking & Walking
- 26% of pop-up comments
- 35% of online comments
Safety
- 29% of pop-up comments
- 37% of online comments
Congestion
- 13% of pop-up comments
- 16% of online comments
Maintenance
- 12% of pop-up comments
- 13% of online comments
Concerns about
Safety & Speeding
- Safety was the #1 concern for both pop-up attendees and online contributors
15% of pop-up comments and 13% of online comments mention speeding specifically
- Cars often enter and exit at freeway speeds near
I-580 and I-80, as well as from Castro onto Richmond Pkwy
- Speeding through intersections and red lights is regularly experienced
- Noticeable lack of police presence or cameras to discourage speeding, especially at night “It’s a deadly rat race road that I prefer not to drive on anymore.” “The stretch where
Parkway opens up from 2 lanes to 4 is crazy! It turns into a speedway!” “Cars blow through the yellow, and often red, light.”
Original PDF, page 23
Comfort and Safety while
Biking and Walking
- Missing sidewalks and high-quality crossings
- Desire for better bikeway connectivity on the
Parkway and to connecting streets
- Lighting is absent or unreliable
- Bay Trail accessibility and signage is lacking and highly desired
- Signalized intersections need longer crossing times and better detection and protection for bicyclists “Need more crosswalks, sidewalks, and bike lanes with good lighting.” “Walking across the Parkway is super scary.” “Would not bike out there without Class IV protection.” “Our kids need to be safe walking to or from school.”
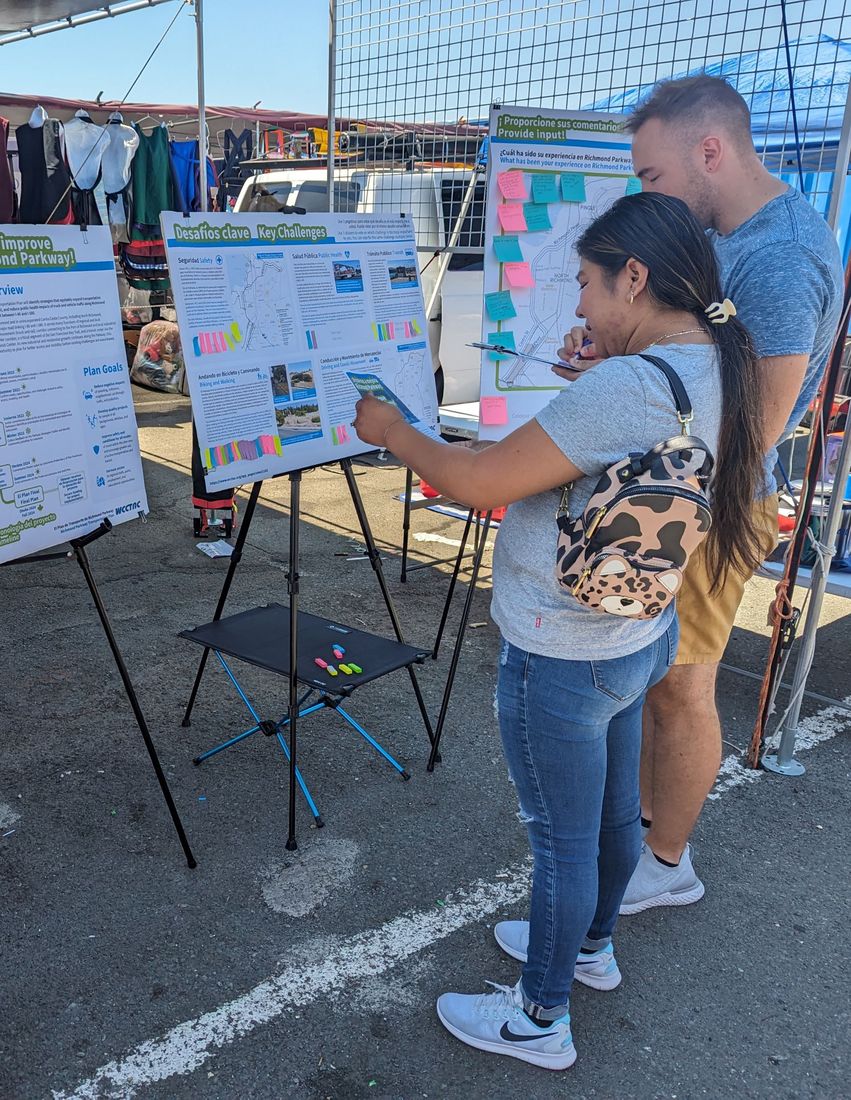
Challenges with Peak
Period Congestion
- Intersections with reportedly consistent congestion include San Pablo Ave, Giant
Rd, Canal St, and 23rd St, as well as the Castro St. and Parkway interchange
- Suggestions to adjust signals for congestion
- Better detection
- Synchronized/coordinated signals
- Shorter signal cycle lengths “It is packed with traffic. I would rather take local roads.” “Signals are not synchronized – a lot of time spent waiting and people get annoyed.”
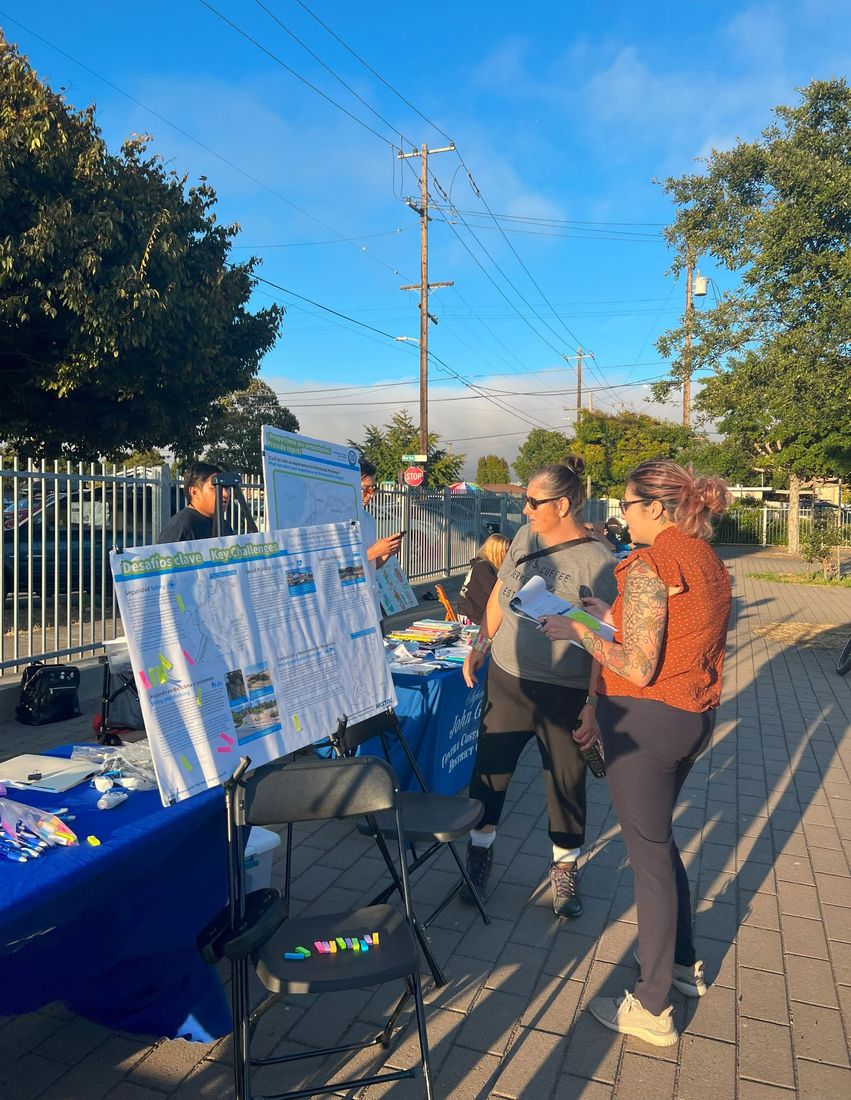
Improving Street
Maintenance
- Heavy truck traffic on the corridor deteriorates pavement quality and creates potholes
- Pedestrians and bicyclists must navigate around garbage and overgrown landscaping on sidewalks and bike lanes
- Desire for more trees, while ensuring overgrown trees that block traffic lights are trimmed “Need to cut back the trees – you can’t see the light until you’re just past the bend.” “Making the parkway look like it’s being cared for will go a long way towards making people feel safe.” “There is frequently a lot of debris and illegal dumping.” “Would be nice to see more trees, less potholes, and clearer lanes. ”
RICHMOND PARKWAY TRANSPORTATION PLAN
Next Steps
Wrap up Phase 1 Engagement (Now) Develop Parkway Strategies Toolkit based on input from Phase 1 Engagement (Oct – Dec 2023) Present Draft Strategies Toolkit in WCCTAC Board Meeting #3 (Early 2024)
Original PDF, page 28
Let’s Discuss
Did we capture the primary challenges on the Parkway? What else is important to understand about current conditions?
Which issues should be the highest priority for the Plan to address?
Do you think the Phase 1 Engagement approach was effective?
Did we reach an appropriate range of community members?
Did we receive the kinds of input you were expecting?
Questions about next steps?
Original PDF, page 29
Thank you
TO LEARN MORE VISIT: www.wcctac.org/app_pages/view/1182 RICHMOND PARKWAY TRANSPORTATION PLAN
In the same set
The original file
Everything above is the content of the original document, published here as a web page so it can be read, searched, translated and used with a screen reader. The original PDF is kept as the authoritative record.