

West Contra Costa Transportation Commission
Express Bus Study — final plan
Whether faster, more direct bus service between West County and regional destinations is worth running, on which routes, and what it would take.
Study · Final draft · 2020 · 54 figures · about 121 min to read
Whether faster, more direct bus service between West County and regional destinations is worth running, on which routes, and what it would take.
Current — In force. This is the version to rely on. The last published draft; nothing later has been issued.
® ®
WEST CONTRA COSTA COUNTY
EXPRESS BUS IMPLEMENTATION PLAN
FINAL PLAN
FEBRUARY | 2020
PREPARED BY
® ®
WEST CONTRA COSTA COUNTY
EXPRESS BUS IMPLEMENTATION PLAN Final Plan | February 2020
Acknowledgements
WCCTAC Board of Directors
Member Agency Director City of Hercules Chris Kelley, Chair City of Pinole Roy Swearingen, Vice Chair City of Richmond Tom Butt City of Richmond Ben Choi City of Richmond Demnlus Johnson III City of San Pablo Rita Xavier City of El Cerrito Janet Abelson AC Transit H. E. Christian Peeples BART Lateefa Simon WestCAT Maureen Powers Contra Costa County John Gioia
WCCTAC Staff
John Nemeth, Executive Director Leah Greenblat, Project Manager
Project Management Team
Nathan Landau, AC Transit Linda Morris, AC Transit Wingate Lew, Caltrans Charlie Anderson, WestCAT Rob Thompson, WestCAT
Technical Advisory Committee
Ryan Lau, AC Transit Beth Thomas, City of Berkeley Dianne Yee, City of Berkeley Allan Panganiban, City of San Pablo Colin Piethe, Contra Costa County Peter Engel, Contra Costa Transportation Authority Hisham Noeimi, Contra Costa Transportation Authority Diana Keena, City of Emeryville Hank Phan, City of Oakland Mike Roberts, City of Hercules David Hanham, City of Pinole Lori Reese-Brown, City of Richmond Denee Evans, City of Richmond
Consultant Team
Kimley-Horn Connectics Transportation Group Placeworks Transportation Analytics
Original PDF, page 3
® ®
WEST CONTRA COSTA COUNTY
EXPRESS BUS IMPLEMENTATION PLAN Final Plan | February 2020 Note: This document is intended to be printed on 11x17 inch paper in landscape format. Alternatively, the document may be viewed online and is available on the WCCTAC website: www.WCCTAC.org
Original PDF, page 4
® ®
WEST CONTRA COSTA COUNTY
EXPRESS BUS IMPLEMENTATION PLAN Final Plan | February 2020 FIGURE 6-14 - PROPOSED RICHMOND PARKWAY TRANSIT CENTER ACCESS ENHANCEMENT (TC2-I)... 48 FIGURE 6-15 - PROPOSED RICHMOND PARKWAY TRANSIT CENTER CAPACITY ENHANCEMENT (TC2).. 49 A. ANALYTICAL METHODOLOGIES B. BACKGROUND STUDIES AND TRAVEL DATA TECHNICAL MEMORANDUM C. OUTREACH SUMMARIES AND MATERIALS D. PROPOSED STOP AND INTERSECTION IMPROVEMENTS E. CONCEPTUAL LAYOUTS AND COST ESTIMATES F. BICYCLE/PEDESTRIAN GAPS ANALYSIS G. OPERATIONS AND MAINTENANCE MEMORANDUM H. FINANCIAL PLAN
Original PDF, page 5
| Route | Term | Origin(s) | Destination(s) |
|---|---|---|---|
| 1 | Medium/Long | Hercules Transit Center, Richmond Parkway Transit Center | Berkeley |
| 2 | Near | Hercules Transit Center, Richmond Parkway Transit Center | Emeryville & Oakland |
| 2A | Medium/Long | Hercules Transit Center, Richmond Parkway Transit Center | Emeryville |
| 2B | Medium/Long | Hercules Transit Center, Richmond Parkway Transit Center | Oakland |
| 3 | Medium/Long | Pinole, Tara Hills via San Pablo Ave, Proposed Tara Hills Dr Mobility Hub, Richmond Parkway Transit Center | Oakland |
| 4 | Near | Pinole, Tara Hills via San Pablo Ave, Proposed Tara Hills Dr Mobility Hub, Richmond Parkway Transit Center | Salesforce Transit Center |
| 5 | Medium/Long | Contra Costa College, Proposed San Pablo Dam Road Mobility Hub | Salesforce Transit Center |
| 6 | Near | San Pablo, Richmond via 23rd St, Proposed Bissell Ave Mobility Hub | Emeryville & Oakland |
| 7 | Near | San Pablo, Richmond via 23rd St, Proposed Bissell Ave Mobility Hub | Berkeley |
| 8 | Medium/Long | San Pablo, Richmond via Rumrill Blvd, Proposed Wright Ave Mobility Hub | Oakland |
® ®
WEST CONTRA COSTA COUNTY
EXPRESS BUS IMPLEMENTATION PLAN Final Plan | February 2020
Executive Summary
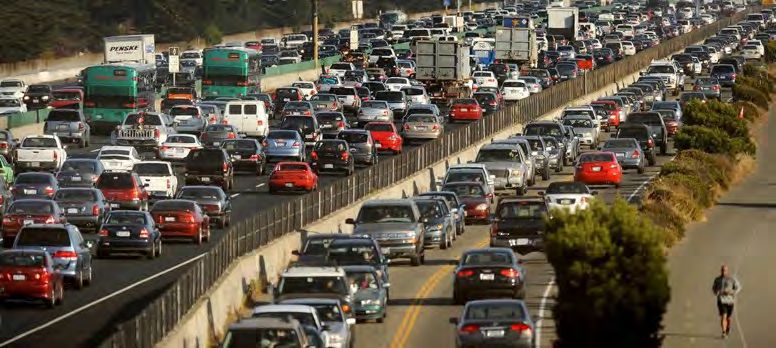
Decades of Bay Area job growth and increasing freight movement has caused congestion on Interstate 80, the primary north-south highway passing through West County, to reach unsustainable levels. According to the Metropolitan Transportation Commission (MTC), westbound I-80 between the City of Hercules and the San Francisco-Oakland Bay Bridge is the second-most congested segment of highway in the San Francisco Bay Area. That congestion is a product of a jobs-housing imbalance in which residents of Contra Costa County, Solano County, and other more distant areas to the north and east are accessing job centers in San Francisco, Alameda County, and other portions of the Bay Area to the south and west. As an example of the significant inter-County flow and the tremendous need for express bus services, of the 115,000 workers that reside within Western Contra Costa County, 95,000 are employed elsewhere in the region. Recent infill development in the East Bay has led to parking lots being redeveloped into office or residential space, fewer places to park, and what parking remains is increasingly likely to be priced rather than free. The heavy rail Bay Area Rapid Transit system (BART) has only three stations in West County, leaving many residents outside its catchment area, and its parking lots are filling ever earlier in the morning. Charged with improving the transportation network and coordinating plans within West County, the West Contra Costa County Transportation Advisory Committee (WCCTAC) has sought to develop solutions to address these challenges and implement high-capacity transit connecting West County and job centers elsewhere in the Bay Area.
Stemming from the 2017 West County High Capacity Transit Study, this document, the West Contra Costa County Express Bus Implementation Plan, proposes providing commuters with additional express bus service to make their journey to work faster, more comfortable, and lower-stress.
The express service proposed in this Plan would better connect West County and growing job centers in Alameda County, including Oakland, Emeryville, and Berkeley, as well as improve existing express bus service between West County and San Francisco. These four employment centers are the commute destinations for 45,000 West Contra Costa County workers, nearly half of those employed outside the County.
The Plan incorporated significant public outreach and input from key stakeholders. This outreach took the form of both surveys and direct outreach to Bay Area employees and businesses. Surveys were distributed to current transit riders and to commuters who currently travel by car but might use transit if it traveled where they needed to go. Information sessions were held at large East Bay employers to hear from current employees and managers how new express service could best serve them. Key stakeholder input was obtained by closely involving and soliciting feedback from the relevant planning bodies, transit agencies, and municipalities whose cooperation will be necessary for the success of this Plan.
In addition to qualitative feedback from potential riders, quantitative transit market analysis was undertaken to connect the areas where people live with where they work, ensuring that proposed service would be accessible to the greatest number of commuters.
The result of this outreach and analysis is a proposed network of express bus routes that would provide transit service for travel markets not adequately served by BART or the existing express bus network operated by AC Transit and WestCAT. These eight proposed routes would link several communities in West Contra Costa County (Hercules, Pinole, Richmond, San Pablo, and unincorporated County) with job centers in the East Bay (Berkeley, Emeryville, Oakland) and San Francisco. Each of these routes would serve a different set of potential riders and would provide varying levels of time savings over existing transit and automobile options. Based on these factors, the routes were prioritized, placing the routes with the largest estimated market size and greatest travel time savings over existing transit service (in essence the biggest benefits to the most people) at the top. This prioritization was intended to allow decision makers to implement the routes with the greatest benefit if funding constraints preclude implementation of the entire network.
To improve the efficacy of the proposed routes, a suite of capital improvements was recommended. Some of these improvements, such as new bus stop amenities, would improve the comfort of riders of the proposed service. Other improvements, such as transit signal priority (TSP), freeway on-ramp HOV lanes, and bus-on-shoulder operation on I-80 would serve to reduce the time that buses spend delayed in traffic. Lastly, improvements to existing transit centers and the construction of several proposed mobility hubs where riders could transfer between other travel modes and express buses would significantly enhance transit accessibility to a wide West County population.
Funds for this program could be provided from two major sources. However, at of the writing of this document, there is uncertainty surrounding both primary funding sources.
Regional Measure 3 (RM3) is the subject of a yet-unresolved court case and the Contra Costa County 2020 Transportation Expenditure Plan (CCTA TEP) has yet to pass the hurdle of voter approval on the upcoming March 2020 ballot. To account for this uncertainty, the Plan developed several funding scenarios, assuming different amounts of available funding.
In the most positive scenario, assuming that RM3 survives the legal challenge and the TEP is approved by Contra Costa County voters, four of the proposed eight routes could be implemented, and many of the accompanying proposed capital improvements could be constructed; these routes are denoted as “Near-Term.” In the event that funding from either RM3 or the TEP is not available, other sources of funding will need to be sought to implement any of the proposed services.
The Plan concludes by outlining discrete steps, separated by topic, that WCCTAC, the stakeholder agencies, and local municipalities should take to bring the Plan to fruition.
Original PDF, page 6
® ®
WEST CONTRA COSTA COUNTY
EXPRESS BUS IMPLEMENTATION PLAN Final Plan | February 2020
1. INTRODUCTION
1.1 Project Purpose
The I-80 corridor is one of the most congested freeways in the San Francisco Bay Area, with traffic jams occurring during all parts of the day, on both weekdays and weekends. To a great degree that congestion is a product of a jobs-housing imbalance in which residents of Contra Costa County, Solano County, and other more distant areas to the north and east are accessing job centers in San Francisco, Alameda County, and other portions of the Bay Area to the south and west. While the freeway has an existing HOV lane, that lane is subject to congestion due to high demand and limited enforcement against violators. Beyond its use by commuters, I-80 is also a freight corridor of national importance and is heavily used by trucks traveling to and from the Port of Oakland.
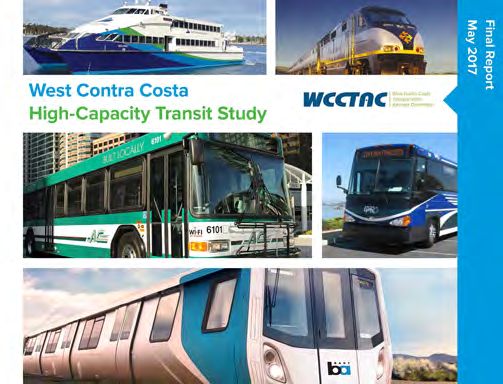
Building on work done in the 2017 West County High Capacity Transit Study, the West Contra Costa County Express Bus Implementation Plan (“the Plan”) proposes expanding express bus service along this corridor to provide robust transit alternatives to driving for those living in West Contra Costa County and working in Alameda County or San Francisco. These improved transit options will allow current commuters stuck in traffic to travel to work in a less-stressful, more sustainable manner. Additionally, though many people do currently commute via existing transit, several important employment hubs are not well-served and require a two- or three-seat transit ride to reach. The proposed expanded service would reduce the inconvenience and uncertainty caused by multiple transfers, providing current transit riders with a better commute and presenting those currently driving with a more attractive alternative.
By identifying the origins and destinations with the highest unmet demand and making recommendations for express bus routes to connect them, as well as capital improvements and amenities to ensure their competitiveness, this Plan aims to provide current and future transit riders with fast, direct, and convenient express bus transit service between home and work. As an example of the significant inter-County flow and the tremendous need for express bus services, over 115,000 workers reside within West County, 95,000 of whom are employed elsewhere in the region. This service would provide East Bay and San Francisco commuters the option to avoid the stress of sitting in traffic, the frustration of searching for parking, the uncertainty of transfers, and the cost multi-agency fares, and change their trip to work to a one-seat ride with time to read, work, sleep, text, and catch up on life.
1.2 Project Process
Funded by a 2017 Sustainable Communities Grant, the Plan was developed with input from the public and from key project stakeholders. Public outreach was carried out in three rounds, described in detail in Chapter 3 and consisted of surveys, focus groups, and pop-up events.
Additionally, stakeholder input was solicited via regular meetings with two groups: the project management team (PMT) and the technical advisory committee (TAC). The PMT was composed of representatives from WCCTAC, Caltrans, AC Transit, and WestCAT. This group met roughly every two months (with ad-hoc meetings scheduled as needed). The TAC, which met regularly but less frequently than the PMT, included a wider selection of members, including representatives from Contra Costa County, Alameda County, and the Bay Area jurisdictions that would be served by the proposed express bus service.
Presentations were given to the WCCTAC Board of Directors at several points during the project. This report in its final form was summarized in presentations to the WCCTAC, AC Transit, and WestCAT Boards of Directors.
1.3 A Guide to this Document
This document presents a detailed plan for the implementation of express bus service originating in West County and serving San Francisco and East Bay employment centers in Alameda County. The report contains a summary of the key recommendations and analyses, the full versions of which are included as appendices.
The Plan recommends a series of express bus routes that would connect commuters living in West Contra Costa County to their jobs in Oakland, Emeryville, Berkeley, and San Francisco. The proposed routes may be found in Chapter 5, along with details for proposed schedules, operating hours, span, and fares.
To support the express bus routes proposed in Chapter 5, a series of prioritized capital improvements are proposed in Chapter 6 that would expand access, improve transit travel times, improve reliability, and increase rider comfort. These improvements include improved bus stop amenities, signals that reduce bus waiting time, new lanes to improve bus flow, and a series of mobility hubs that would allow riders to seamlessly transfer between different modes of travel.
In addition to route and capital improvement recommendations, this report includes information about the following:
- Selection and prioritization methodology of proposed express bus route alignments and stops (Chapter 5),
- Outreach conducted over two rounds to solicit feedback from existing express bus riders, potential users, and key East Bay employers and how that input impacted the Final Plan (Chapter 3),
- Recommendations were made to close pedestrian and bicycle gaps that could otherwise hinder or preclude travel by foot or bicycle to proposed express bus stops (Chapter 6), and
- Detailed estimates of both capital and O&M project costs and a plan to seek funding for them (Chapter 7)
Contained in this document is a set of implementation steps for each recommendation, providing WCCTAC and transit operators a playbook for project implementation.
Original PDF, page 7
® ®
WEST CONTRA COSTA COUNTY
EXPRESS BUS IMPLEMENTATION PLAN Final Plan | February 2020
2. BACKGROUND CONDITIONS
2.1 Prior Studies
The development of this Plan was informed by prior efforts in the West County region and on the I-80 corridor. Those studies and plans are summarized below.
West County High-Capacity Transit Study (2017)
The West County High Capacity Transit Study (HCTS) sought to identify a network of high-capacity transit options that would enhance connectivity and accessibility to serve the western portion of Contra Costa County. The study evaluated a wide range of transit modes, including express bus, bus rapid transit (BRT), commuter rail, and a BART extension to Hercules Transit Center. Through extensive analysis and outreach to stakeholders and potential users, one of the study’s findings was an unmet express bus transit market. The HCTS identified a commuter network and recommended advancing several of the alternatives considered to meet the existing and growing demand for commuter services, including express bus between existing West County transit centers and East Bay employment centers in Alameda County, such as Oakland, Emeryville, and Berkeley. The HCTS identified several supporting capital improvements, including increased parking at Hercules Transit Center and Richmond Parkway Transit Center, completion of the direct access ramps at Richmond Parkway and I-80, enhanced access between I-80 and the Hercules Transit Center, a new bus transit center near Macdonald Avenue and I-80, new ramp improvements at Macdonald Avenue and I-80, and transit signal priority treatments.
AC Transit Short-Range Transit Plan (2016)
AC Transit’s 2016 Short-Range Transit Plan (AC Transit SRTP) is a federally-mandated fiscal, planning, and regulatory document that evaluates current system performance, and lays out goals for growing ridership and improving service for existing riders. The AC Transit SRTP identifies Downtown Oakland, Downtown Berkeley, and the Hollis Street corridor in Emeryville as the locations with the highest population and employment concentrations in the northern half of its service area, making them conducive to transit service. Additionally, the agency pledges to support residential and commercial development in Priority Development Areas (PDAs), Bay Area neighborhoods that have been designated to absorb additional regional growth and that are planned to see infill development. Among the many PDAs within West County are the San Pablo Avenue Corridor, Rumrill Boulevard, San Pablo Avenue & 23rd Street Corridors, Central Richmond & 23rd Street Corridor, and South Richmond. The residential growth in these areas will be paired with an increased demand for transportation services. This Plan is intended as the next step towards advancing the implementation of this new service.
WCCTA Short-Range Transit Plan (2016)
The Western Contra Costa Transit Authority’s (WestCAT) Short-Range Transit Plan (SRTP) serves as a blueprint to meet the community’s current and future transit demands. The WestCAT SRTP outlines current service levels and identified needs to be addressed in the long-term including: service to Oakland/ Emeryville; Lynx express bus service to and from Pinole (the “Lynx” express route currently provides service between Hercules and San Francisco); service expansions throughout the area; increased weekend service; and service to Solano County. Oakland, Emeryville, and Berkeley are identified as having a strong commuter demand from the service area. The majority of A.M. morning trips in the service area are destined for the East Bay (primarily to Oakland and UC Berkeley) – transit users currently transfer to BART at the El Cerrito del Norte BART station. The SRTP identifies potential opportunity for service to West Berkeley, Downtown Oakland, and Emeryville’s commercial district. The SRTP also proposed the addition of express bus service between Pinole and San Francisco in the long-term. This Plan serves to advance these goals by providing service to meet existing needs.
Contra Costa Transportation Authority 2016 Express Bus Study Update
This document represented an update to the initial Contra Costa Express Bus Study, conducted in 2001. The study brings together the 10 transit service providers, including WestCAT and AC Transit, operating express bus routes to endorse a unified vision for express service. The update also made recommendations for three specific corridors. The I-80 Corridor in particular was identified as one where transit serving San Francisco and Oakland would be very competitive by 2040, and potentially competitive to Emeryville and West Berkeley. Specific service changes were recommended to a number of existing routes, as well as capital improvements such as direct access bus ramps between the I-80 HOV lanes south of Richmond Parkway and Richmond Parkway Transit Center.
Richmond Parkway Transit Center Reassessment (2013)
The Richmond Parkway Transit Center (RPTC) is a facility located adjacent to the Richmond Parkway/I-80 interchange. Owned by Caltrans and operated by AC Transit, the transit center is intended to act as a transfer point between various modes and service providers. RPTC is composed of a park & ride lot (with 207 parking stalls), seven sawtooth bus bays (served by AC Transit Local and Transbay routes, and by WestCAT Local and Express routes), and a casual carpool pick-up/drop-off area.
AC Transit requested a study to evaluate how the transit center might best be used as an asset to the wider region, entailing analyses of future parking demand, retail feasibility, capacity expansion, and financial outlook. The final recommendation of the study was that the existing configuration be maintained until additional demand could make an expansion of parking capacity at the transit center financially feasible.
Original PDF, page 8
® ®
WEST CONTRA COSTA COUNTY
EXPRESS BUS IMPLEMENTATION PLAN Final Plan | February 2020
2.2 Existing Transit Services
Express Service
A number of existing express transit services are already provided in the study area by both AC Transit and WestCAT as well as other operators. While crucially important to thousands of Bay Area commuters, there are significant portions of the area with no express service and gaps that the existing services do not fill, notably the need for West County commuters to travel to Alameda County via transit without having to transfer between modes and operators.
Existing express transit service operating in West County is summarized below:
AC Transit
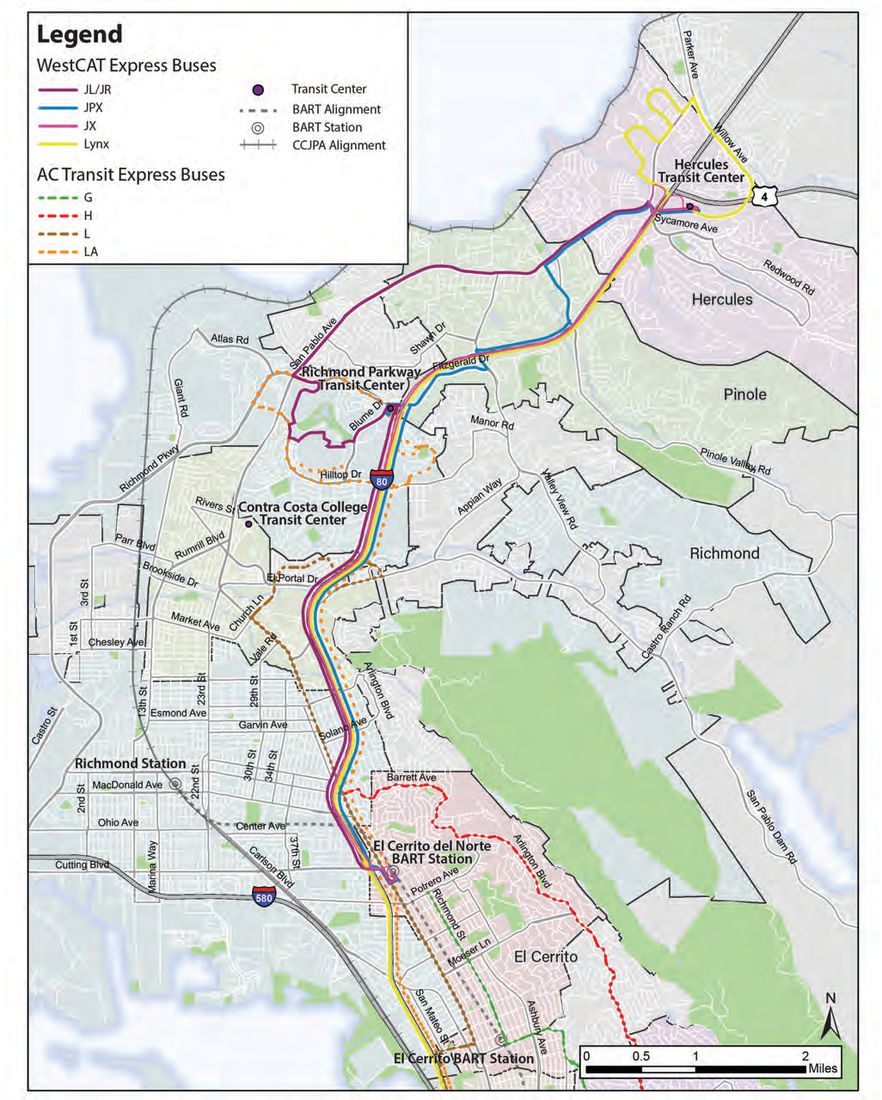
AC Transit operates a series of “Transbay” lines, all of which serve San Francisco from the East Bay via the San Francisco-Oakland Bay Bridge. Several of the Transbay lines (G, H, L, and LA) serve local stops in West County and Alameda County before making the trip to San Francisco. While the routes serve the area surrounding Hilltop Mall in Richmond, San Pablo, and parts of El Cerrito, central and western Richmond do not receive any Transbay service.
WestCAT
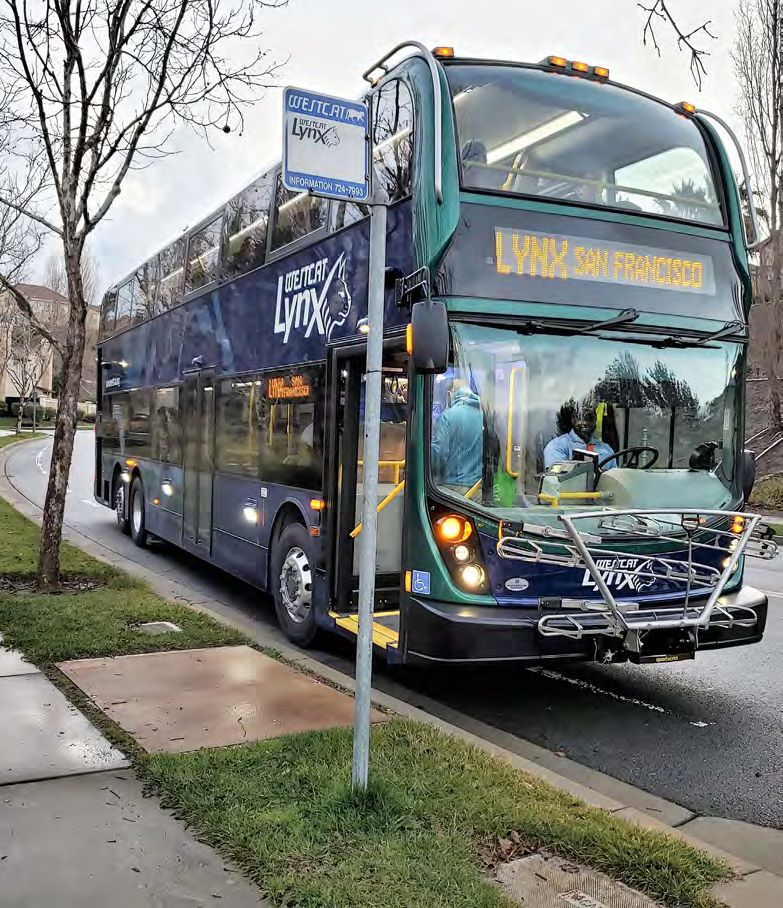
WestCAT operates one express bus route that runs between West County and San Francisco, the Lynx, that serves stops in Hercules and the Hercules Transit Center before traveling on I-80 and the San Francisco-Oakland Bay Bridge. The operator’s other express routes JL/JR and JX/JPX run between Hercules Transit Center and El Cerrito del Norte BART station, with the JL/JR stopping at Richmond Parkway Transit Center. Existing transit service requires those living in Pinole and working in San Francisco to either travel north to Hercules Transit Center or to transfer at El Cerrito del Norte BART station. Commuters in San Pablo and central Richmond do not have easy access to express transit via WestCAT.
BART
BART provides heavy rail service from the Richmond Transit Center in Downtown Richmond to North Berkeley, Downtown Berkeley, MacArthur (Oakland), Downtown Oakland, San Francisco, and beyond. There are three BART stations in West Contra Costa County: Richmond, El Cerrito del Norte, and El Cerrito Plaza. While the Richmond station is the line terminus, El Cerrito del Norte Station functions for many as the end of the line due to its location near I-80 and is the transfer point to and from many bus lines (including WestCAT JL/JR and JX/JPX). The station has both surface and structured parking, totalling over 2000 spaces, all of which have a daily fee of $3 for BART riders. As of the writing of this report, the parking lot typically fills at 7:30 A.M. Though the BART trains themselves are not considered to be at maximum capacity, many passengers are forced to stand and crowd into the center of the car, which could be uncomfortable or infeasible for some commuters.
Capitol Corridor
Operated by Amtrak, the Capitol Corridor train line provides service between Sacramento and San José with stops at Richmond Transit Center, West Berkeley, Emeryville, and Jack London Square. The City of Hercules has plans for a Capitol Corridor stop at its future Hercules Intermodal Transit Center, located on the shore of San Pablo Bay northwest of the existing Hercules Transit Center. Capitol Corridor service operates 15 trips per day per direction through this corridor, with seven trips per day continuing to San José. Capitol Corridor is priced for longer distance travel; short-distance travel between Richmond and other East Bay job centers costs between $9-$10, a level that may prohibitively expensive for many potential riders.
Figure 2-1 summarizes existing express transit serving West Contra Cost County. Table 2-1 shows the average daily ridership for each of these services, excluding Capital Corridor for which recent data was not available.
Figure 2-1 - Existing West County Express Transit Service February 19, 2020
Original PDF, page 9
| Provider | Route | Extents | Peak Hour Headways | Average Daily Riders |
|---|---|---|---|---|
| AC Transit Transbay Routes | G | El Cerrito Plaza to San Francisco via El Cerrito, Albany, Berkeley | 20-30 Minutes | 471 |
| H | East Richmond to San Francisco via El Cerrito, Kensington, Berkeley | 20 Minutes | 628 | |
| L | Princeton Plaza to San Francisco via San Pablo Ave | 15-18 Minutes | 678 | |
| LA | Hilltop Dr Park & Ride to San Francisco via Richmond Parkway Transit Center | 15-20 Minutes | 449 | |
| Total | 2,226 | |||
| WestCAT Express and Transbay Routes | JR/JL Express | Hercules Transit Center to El Cerrito del Norte via San Pablo Ave | 10-18 Minutes | 1,211 |
| JX Express | Hercules Transit Center to El Cerrito del Norte via I-80 | 15 Minutes | 394 | |
| JPX Express | Hercules Transit Center to El Cerrito del Norte via San Pablo Ave, I-80 | 15 Minutes | 564 | |
| LYNX Transbay | Hercules to San Francisco | 15 Minutes | 1,110 | |
| Total | 3,279 | |||
| BART | Richmond Station | Richmond to Daly City, Millbrae, Warm Springs/South Fremont | 7 Minutes | 4,135 |
| El Cerrito del Norte Station | Richmond to Daly City, Millbrae, Warm Springs/South Fremont | 7 Minutes | 8,577 | |
| Note: Data from 2017, BART ridership reflects daily station exits February 19, 2020 |
® ®
WEST CONTRA COSTA COUNTY
EXPRESS BUS IMPLEMENTATION PLAN Final Plan | February 2020
2.3 Employment and Housing Markets
The Background Studies and Travel Data Technical Memorandum (found in Appendix B), evaluated travel demand from the West County area to western Alameda County and San Francisco to determine where additional express service would be most effective. The memo’s findings were divided into a summary of existing transit infrastructure, a description of the region’s population density and demographics, and an analysis of commute origins and destinations.
Existing transit findings are summarized below:
- Existing express bus service in the study area serves both so-called “choice riders” (riders with access to an automobile but who choose to ride transit anyway) and “transit-dependent riders” (riders without easy access to an automobile).
- AC Transit’s Transbay routes, which are largely based on an arterial-running model in which passengers walk from home to their bus stop, capture a large share (over 50 percent) of the potential market of people who live and work within walking distance of their origin and destination stop.
- WestCAT’s Lynx express bus service captures nearly 50 percent of people who live within a 2.5-mile driving distance of the Hercules Transit
Center and work within walking distance of the Salesforce Transit Center, the line’s terminus.
- Existing transit travel times are most competitive with automobile travel times when a one-seat ride is available and in cases where riders have a destination near a BART station. Other trips can take much longer via transit than via automobile.
- Arterial-running AC Transit Transbay lines see low ridership on the northern ends of their alignments, likely due to the longer travel time between home and the freeway segment.
Population and demographic findings are summarized below:
- Population density, an important factor in transit planning, is concentrated in the cities of Hercules, Pinole, San Pablo, Richmond, and El
Cerrito. Densities are much lower north of Rodeo, west of Richmond Parkway, and in the areas east of I-80.
- There is comparatively little employment density in West County. The major employment centers of the East Bay are located in Oakland,
Berkeley, and Emeryville.
- More than a quarter (26.6 percent) of West County’s population is low-income, defined by the U.S. Department of Housing and Urban
Development as households making below 50 percent of area median income.
- West Contra Costa County is 75.3 percent Hispanic or non-white. These residents predominantly live in the lower-lying areas of San Pablo and Richmond west of the I-80 freeway.
- Nearly one in twelve (7.8 percent) households do not have access to an automobile, higher than the rate in Contra Costa County as a whole (5.6 percent) but lower than San Francisco Bay Area (9.2 percent in the San Jose-San Francisco-Oakland Combined Statistical Area). These households are concentrated in the cities of El Cerrito, Richmond, and San Pablo.
The memo also identified the major commute destinations for West County residents, which it recommended be considered for potential express bus service:
- San Francisco
- Market Street Corridor
- Financial District
- South of Market neighborhood (SoMa)
- UCSF Parnassus Campus
- Northern Portions of the Mission District
- Oakland
- Downtown Oakland
- Uptown Oakland
- Jack London Square
- Broadway/MacArthur Boulevard Area
- Berkeley
- Downtown Berkeley
- UC Berkeley Campus
- North Berkeley
- Berkeley/Emeryville
- Commercial area between San Pablo Avenue and I-80 in Emeryville and Berkeley
Table 2-1 - Existing West County Commuter Transit Services
Original PDF, page 10
® ®
WEST CONTRA COSTA COUNTY
EXPRESS BUS IMPLEMENTATION PLAN Final Plan | February 2020
3. OUTREACH SUMMARY
Two rounds of public outreach were conducted during the recommendations development portion of this project. Outreach Round 1 solicited input to guide route development and capital improvement priorities. Outreach Round 2 gathered feedback after the initial identification of draft routes and obtained feedback on desired route characteristics. Due to the large share of West County residents that speak Spanish as a primary language, all outreach materials for rounds 1 and 2 were provided in Spanish as well as English. The process and results of each round of outreach are described below. Finally, Outreach Round 3 focused on informing partner agencies and the public of the contents of the Public Review Draft Plan. For detailed summaries on Rounds 1 and 2 of outreach, as well as materials from those outreach efforts, see Appendix C.
3.1 Outreach Round
Outreach Round 1 began in September 2018 and concluded in December 2018. The goals were to raise awareness about the project and to solicit feedback on express bus needs and opportunities.
Outreach Activities
Outreach Round 1 included various engagement activities to encourage participation and raise project awareness. These activities included:
- A project web page was published on the WCCTAC website in October 2018. This page provided information on the project in both English and Spanish, including a timeline, a link to subscribe to the mailing list, and a way to give feedback about the project.
- An online survey (presented in both English and Spanish) asked basic questions about rider demographics, commute direction, duration, and current mode of travel. Respondents were able to rank factors that would influence their decision to use express bus to commute.
- Two promoted Facebook posts were published, reaching more than 17,000 people and generating more than 1,000 engagements. These posts both linked to the online survey.
- A project fact sheet was created and distributed to employers, civic institutions, and local government. The fact sheet contained information on the project and links to the project website and online survey.
- A postcard briefly describing the project was mailed to more than 27,000 West County residents, inviting recipients to provide feedback via the project website and participate in the online survey.
- Press releases were submitted to local news outlets, city manager newsletters, and neighborhood councils.
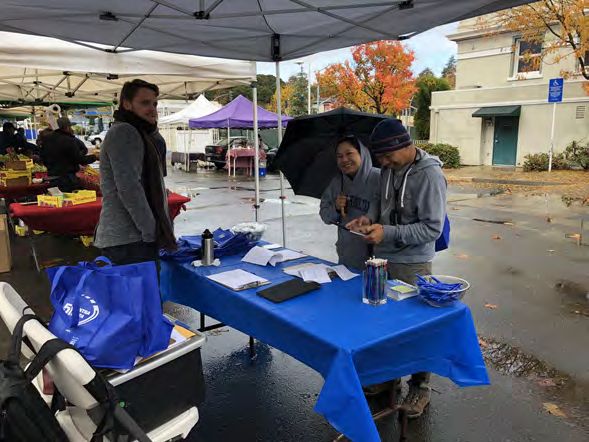
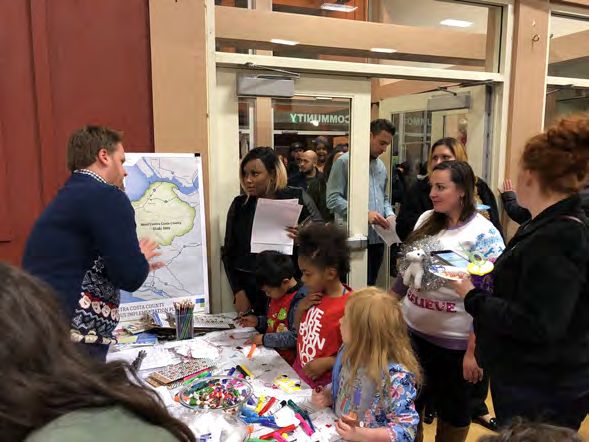
- Pop-up events were held at the Pinole farmer’s market and the holiday tree lighting in
Hercules. At both events surveys were distributed and members of the public were engaged.
- In-person engagement and survey distribution took place over several days at Hercules
Transit Center, Richmond Parkway Transit Center, El Cerrito del Norte BART Station, and Richmond BART Station.
Results
The survey sampled heavily from respondents at transit centers and BART stations. While the survey is not a random sample of West County commuters, it does provide an understanding of the sentiments of transit riders and those already interested in the project. Key project survey results are as follows:
- A total of 471 people responded to the project survey, 94 percent of whom live in West County.
- Over half (52 percent) of respondents commute between home and a destination in San Francisco. The next-largest destinations were
Oakland (17 percent) and Berkeley (13 percent).
- Forty percent of respondents spent between 60-90 minutes to reach their commute destination in the A.M. In the P.M. this rises to 44 percent. The majority of these people are currently transit commuters.
- A majority (52 percent) of respondents indicated that they would be willing to pay between $2.50 and $5.00 for a one-way express bus ride to work or school.
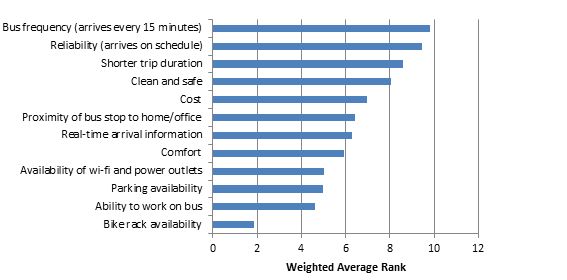
- When asked to rank factors they take into consideration while riding transit, respondents selected bus frequency, reliability, and shorter trip duration as the three most important.
- Respondents were asked what factors they take into consideration when taking public transit and were able to rank a set of 12 responses.
Figure 3-3 shows the weighted average of those rankings, with the longer bars indicating greater preference and shorter bars indicating lower preference.
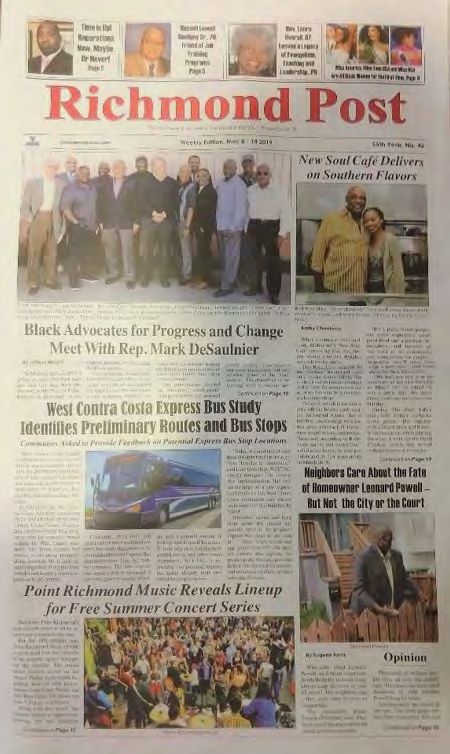
Figure 3-1 - Richmond Post Print Article Figure 3-2 – Photos from Outreach Round 1 What Factors do you take into consideration when taking public transit?
Figure 3-3 - Transit Characteristic Preferences - Number represents a weighted average rank with 12 being the highest February 19, 2020
Original PDF, page 11
® ®
WEST CONTRA COSTA COUNTY
EXPRESS BUS IMPLEMENTATION PLAN Final Plan | February 2020
3.2 Outreach Round
Outreach Round 2 began in April 2019 and concluded in July 2019. The goal was to continue raising awareness of the project and to solicit feedback on the proposed service alignments. This included specific feedback on origin and destination stops. It also obtained feedback on specific express bus amenities that users were interested in.
Outreach Activities
The first goal of Outreach Round 2 was to inform more people about the existence of the project and show the proposed route alignments. This was done in the following ways:
- The project website (published in both English and Spanish) was updated to include information about the current progress, as well as proposed stops.
- An online survey (presented in English and Spanish) asked questions about place of residence and employment, commute arrival and departure times, and travel mode. Respondents were asked for their preferred origin and destination location from a list that included existing express bus stops and new express bus locations considered as part of this project.
- Three promoted Facebook posts were published, reaching a total of 4,600 West
Contra Costa County Residents. Members of the project TAC were asked to share the Facebook post using their social media accounts. The post included links to the project website and survey.
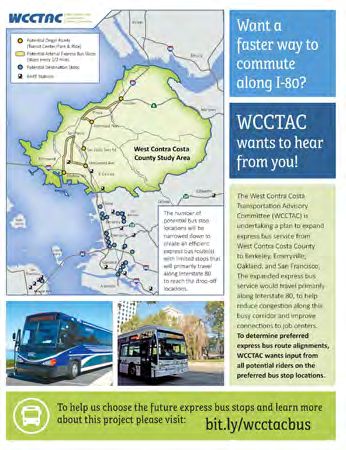
- An updated flyer (Figure 3-5), in Spanish and English, was developed and distributed to businesses in Emeryville and Berkeley, and at the
Richmond Juneteenth Festival.
- A press release explaining the project was provided to 15 news organizations, City Manager newsletters, neighborhood councils, and other interested parties.
- Focus group meetings were held at several businesses: Novartis (Emeryville), Pixar (Emeryville), and REI (Berkeley).
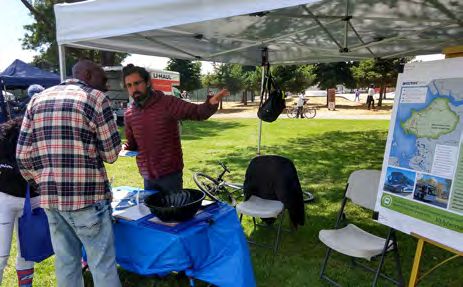
- Pop-up events were held at the Richmond Juneteenth Festival and the Hercules July 4th Event. At both events surveys were distributed and members of the public were engaged.
Results
A total of 798 people responded to the project survey. Likely due to more expansive distribution, the Outreach Round 2 survey had more respondents who currently drive than the Outreach Round 1 survey. Thus, it is more representative of the preferences of people who do not yet commute by transit but might be willing to. Similar to Outreach Round 1, this is not a statistically significant survey as respondents were self-selected.
- A majority of respondents work in either Berkeley (27 percent) or Oakland (27 percent), with smaller amounts working in San Francisco (13 percent) or Emeryville (12 percent). This contrasts to Outreach Round 1 due to the more focused outreach to intra-East Bay commuters.
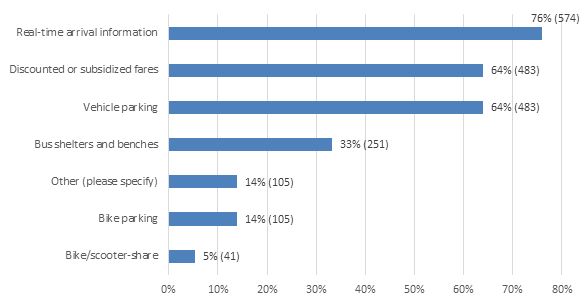
- Two-thirds of respondents (67 percent) indicated that they drive alone during their commute, 44 percent for the entire trip and 23 percent in combination with another mode. Figure 3-6 shows the distribution of respondent preference for amenities.
- When asked what express bus amenities potential riders preferred, three-quarters (76 percent) expressed the desire for real-time arrival information. Nearly two-thirds (64 percent) also indicated that discounted fares and vehicle parking would influence their choice to ride an express bus (respondents were able to select more than one answer).
- The survey reached roughly representative numbers of Asian and Black/African American respondents (relative to the makeup of Contra
Costa County), while White respondents were overrepresented in the survey (36 percent of survey respondents compared to 24 percent of County population) and Hispanic/Latino people underrepresented (13 percent of respondents compared to 36 percent of County population).
Origins
- Respondents were given an option to select a preferred express bus origin stop among those proposed by the Plan. Four-fifths (79 percent) of respondents indicated that one of the proposed stops would be their preferred location; 21 percent responded that ‘none of the above’ would be preferred (though over half of those people reported living in cities south of
Richmond, meaning that express bus would likely not be a convenient commute option).
Destinations
- When asked to select a preferred express bus destination, 30 percent of respondents selected Berkeley and 30 percent selected Oakland. Smaller numbers selected San Francisco (16 percent) and Emeryville (14 percent) as their preferred destination. Ten percent of respondents selected another destination.
- A large majority (90 percent) of respondents who selected San Francisco as their preferred destination indicated that the San Francisco Salesforce Transit Center would work for them.
Results
- Respondents expect express bus service to be faster than, or at least competitive with, driving.
- Vehicle parking was rated high as an amenity, which is likely a product of how people currently interact with express service.
- While the proposed express bus destinations encompassed much potential rider demand, employer- provided free parking can compete with proposed service.
- Survey respondents expressed desire for real-time arrival displays.
3.3 Outreach Round
Round 3 of outreach focused on spreading the word about the availability of the Public Review Draft Plan. It consisted of a digital marketing campaign that included:
- Updating the project web page
- Sending an e-blast to the project mailing list
- Requesting that project partners (i.e. jurisdictions, TAC members, and large employers) help spread the word through email, social media, and NextDoor.
- Promoting the Public Review Document through paid Facebook posts
- Public presentations of Draft Plan at board meetings for project partners: WCCTAC, WestCAT, and AC Transit
Figure 3-4 – Photo from Outreach Round 2 Figure 3-5 – Project Outreach Flyer Figure 3-6 - Preferred Express Bus Amenities February 19, 2020
Original PDF, page 12
® ®
WEST CONTRA COSTA COUNTY
EXPRESS BUS IMPLEMENTATION PLAN Final Plan | February 2020
4. PROJECT OPPORTUNITIES AND NEEDS
Project needs were identified based on previous studies, analysis conducted in the Background Studies and Travel Data Memorandum, two rounds of outreach, and ongoing feedback from stakeholders such as the WCCTAC Board of Directors. Those needs are explored in further detail in the chapter below and those that follow.
4.1 Expanding Transit to Underserved Markets
The Background Studies and Travel Data Technical Memorandum identified areas of West County that are currently not well-served by intercounty transit options (see Appendix B for the full text). Further analysis examined which areas and corridors in West County were home to the largest number of people employed in Alameda County job centers (Berkeley, Emeryville, and Downtown Oakland) and San Francisco. West County corridors that were found to be both underserved by intercounty transit and home to a large number of workers employed outside the county were as follows:
- San Pablo Avenue between John Muir Parkway and Richmond Parkway
- 23rd Street and Macdonald Avenue between San Pablo and central Richmond
- Rumrill Boulevard/13th Street/Harbour Way between San Pablo and central Richmond
The West County area is home to many people living within MTC’s “Communities of Concern,” defined by a composite index of income, minority status, limited English proficiency, disability status, and more. The subregion is majority non-white and home to a large number of households with limited or no access to a vehicle; three-quarters of the population is a member of a minority group and the rate of carless households is higher by several percentage points than both that of the wider county. Each of the West County corridors identified above either passes through or is entirely contained within MTC’s Communities of Concern.
Downtown Oakland and Berkeley have historically been centers of employment in the East Bay. Due to substantial recent development, Emeryville has become home to a growing number of employers. Though it is still small relative to its neighbors, it is uniquely underserved by express transit from West County; due to its lack of a BART station, transit commuters must disembark at MacArthur Station and transfer to the Emery Go-Round shuttle.
The two largest transit centers in West County, Hercules Transit Center and Richmond Parkway Transit Center, currently serve as local hubs for local travel as well as regional nodes for park & ride travel to San Francisco and Alameda County (via a transfer to BART at El Cerrito del Norte station). While the parking lots at these transit centers are full or near capacity, an attempt was made to integrate these transit centers into any proposed express bus service given the substantial role they already play in the existing transit network and the opportunity to leverage existing resources.
4.2 Improving Transit Options
Though all of the employment centers listed above may currently be reached from West County via transit, nearly all of the trips require at least one transfer. For example, a transit rider living in Pinole and working in Oakland would take the WestCAT JR to El Cerrito del Norte Station, where they must transfer to BART before continuing to Oakland. This transfer introduces additional travel time, the possibility of missing a train, and cost (riders transferring from BART to WestCAT buses pay a discounted fare – there is no discount when transferring from WestCAT to BART). Riders hoping to travel to Emeryville or West Berkeley, where there are no nearby BART stations, must transfer to an additional bus. This compounding inconvenience leads to a situation in which most of those with the ability and means to drive skip transit and commute by car.
By providing single-seat rides from transit centers, new mobility hubs, and arterial stops in West County to the job centers elsewhere in the East Bay and San Francisco, the proposed express bus service aims to present a more compelling option than existing transit service or a congested auto commute.
4.3 Passenger Comfort
High ridership on BART trains and limited seating requires most people riding during the peak hour to stand, a situation which many be uncomfortable or infeasible for some potential riders. Additionally, some respondents to project outreach expressed concerns about security or cleanliness on the highly-used BART cars, on which a number of people are boarding and exiting at each stop.
Express buses are designed with passenger comfort in mind. All riders are able to sit down, allowing them to read, catch up on email, watch videos on their phone, or take a nap. This provides a higher level of comfort and opportunity for productivity compared to other transit options.
4.4 Prioritizing Person Throughput
A fully-loaded double-decker coach bus can carry at least 80 passengers in a vehicle less than three times the length of a single private automobile. Despite this, in much of the project area transit vehicles are treated no differently than automobiles, aside from their being permitted to use the HOV lane, which is regularly congested. This failure to prioritize high-capacity transit relative to low-capacity automobiles disincentivizes use of transit relative to private vehicles. If someone already has access to their own car, there is currently little reason to change one’s commute and ride the bus. A multi-pronged strategy is needed and supported by WCCTAC, AC Transit and WestCAT for reducing congestion in the I-80 HOV lanes. MTC has funded additional enforcement on the corridor as a demonstration project and is pursuing development of new technology to assist with detecting HOV lane violations. WCCTAC also seeks to conduct a future study of possible I-80 HOV lane modifications that could reduce congestion and increase HOV compliance, thereby speeding up the buses using the HOV lanes.
To address congestion on the I-80 corridor, priority should be given to high-capacity vehicles to make bus travel time competitive with that of automobiles through the installation of dedicated lanes and traffic signal modification. The outreach results suggest that such priority would incentivize those currently driving to switch to more space-efficient modes, increasing person-throughput without requiring cost-prohibitive roadway widening. It is said that the best advertisement for the bus is letting drivers watching it pass them while they are stuck in traffic.
A significant source of delay is in traveling on arterials near freeway interchanges and traveling through those interchanges. Prioritizing buses around and through interchanges would have significant benefit in terms of transit travel time competitiveness.
4.5 Improving Transit Access
Parking constraints serves as a limitation for both commuters who currently drive and for those who travel by BART or existing express bus. Due to continued infill development in many parts of the East Bay, many surface parking lots are being repurposed for office space and residential buildings. In some municipalities, such as Emeryville, policy changes are taking places that affect the availability of on-street parking used for all-day use. These changes serve to decrease the amount of parking available for West County commuters, forcing them to spend more time searching for parking and more money paying for it. Providing more high capacity transit service will present people with alternatives to this.
Parking constraints also exist at the origin points of existing express bus service. Existing transit from West County to San Francisco captures a relatively high proportion of the potential market (i.e. people who live in West County and work in San Francisco), many of whom board at Hercules Transit Center or Richmond Parkway Transit Center. However, both of these transit centers are limited in their ability to serve additional transit users who arrive via auto. According to AC Transit, which manages Richmond Parkway Transit Center, the parking lot fills at approximately 7:00 on weekday mornings. Hercules Transit Center’s managing agency, BART, reports that while the parking lot does not regularly fill during the morning commute period, its usage rate has been increasing and will likely begin to reach capacity in the near future if current trends continue.
While there is local bus service to both Hercules Transit Center and Richmond Parkway Transit Center, only a subset of it runs at high frequencies. There is little housing within walking distance of either transit center, the Hercules Transit Center area lacks nearby sidewalks, and the surrounding bicycle facilities around both centers are not suitable for all ages and abilities. Bicycle and pedestrian network gaps adjacent to expanded service proposed in this Plan were identified and may be found in Appendix F. However, due to the surrounding land uses, even if existing bike and pedestrian gaps were closed there would still be barriers to accessing transit.
Original PDF, page 13
® ®
WEST CONTRA COSTA COUNTY
EXPRESS BUS IMPLEMENTATION PLAN Final Plan | February 2020 Due to these difficult-to-address constraints, new transit service should be launched in concert with additional access and mobility improvements at both locations. Additionally, proposed routes with walk-up service on San Pablo Avenue may relieve some of the parking demand at Hercules Transit Center, as people who formerly drove and parked could walk from their home to the bus stop.
4.6 Enhancing Existing Amenities and Facilities
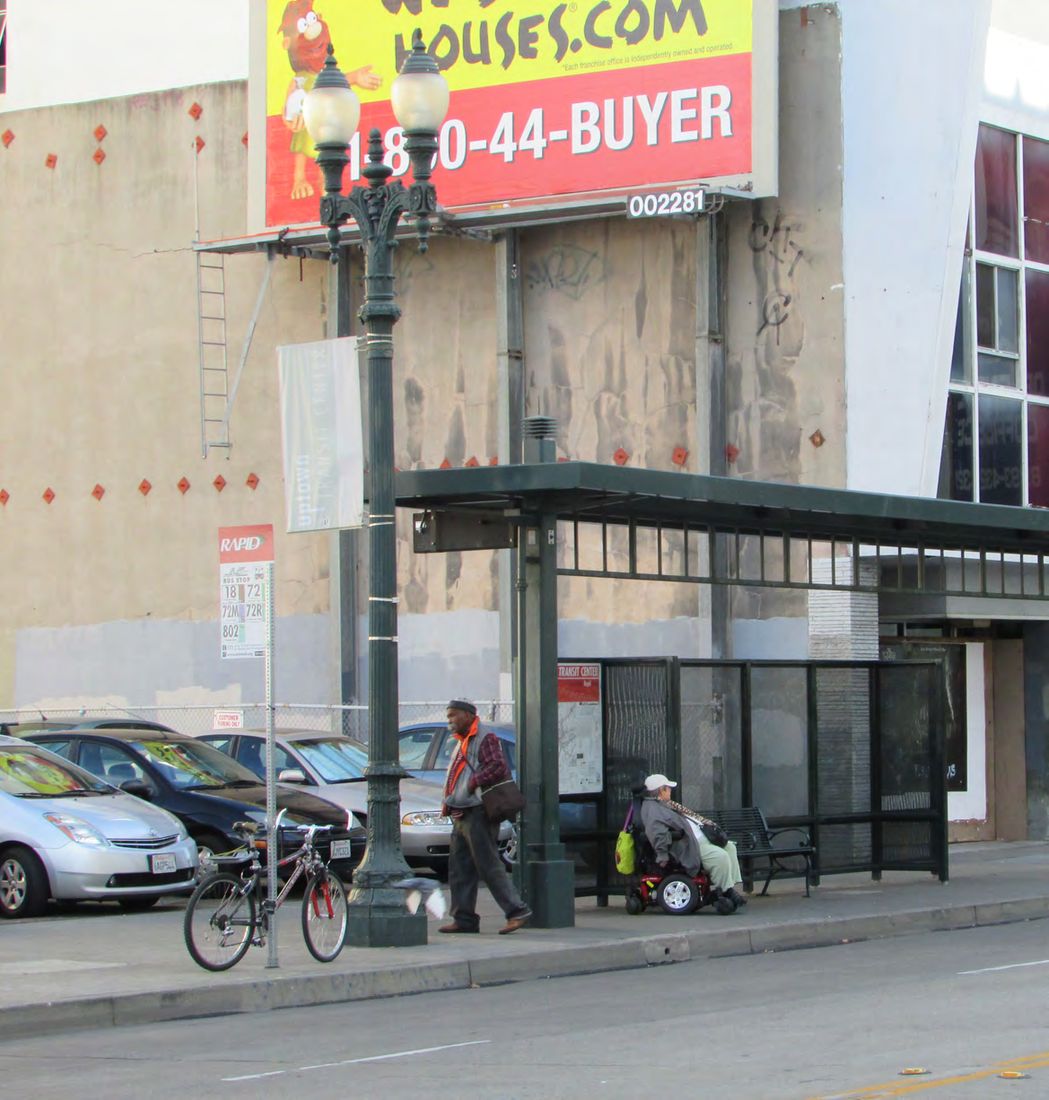
Many bus stops in the project area lack basic amenities such as a shelters, benches, and lighting. Several do not have a concrete passenger loading zone to provide a waiting area for riders and facilitate wheelchair users boarding the bus. Providing enhancements to existing stops that will improve the rider waiting experience will further encourage ridership, a fact suggested by the responses to the Outreach Round 2 survey. As part of the development of the Plan existing and new bus stops were evaluated to determine the level of basic amenities needed.
4.7 Existing Operator Constraints
There are a number of constraints that must be addressed before any additional express service could be operated from West Contra Costa County. The service is planned to be operated by the existing bus operators in the West County area, AC Transit and WestCAT, both of which operate at current capacity with respect to facilities and rolling stock.
Maintenance and Storage Facilities
AC Transit’s West County Division 3 (D3) facility is located at the intersection of Macdonald Avenue and 21st Street in Richmond and WestCAT’s facility (its only such maintenance yard) is on Pinole Shores Drive immediately north of San Pablo Avenue. Both AC Transit’s and WestCAT’s facilities have no surplus bus maintenance and storage capacity, and cannot currently accommodate additional buses without expansion or reconfiguration. To address its storage constraints, WestCAT plans an expansion of its existing facility. The parcel adjacent the existing yard has been purchased and full funding is available from RM3 to construct the new facility, pending resolution of the lawsuit challenging the measure. AC Transit has stated that, to accommodate the expanded service proposed in this Plan, a plan would need to be developed to shift buses between several of its yards to provide additional capacity at the D3 facility in Richmond.
Buses
In addition to lacking capacity in their West County maintenance yards, neither AC Transit nor WestCAT currently possesses sufficient excess rolling stock (beyond their current bus spare ratio requirements) to begin operation of new express routes. The operation of any new or expanded service would necessitate the purchase of new buses. Recommendations for new buses to be acquired and their cost may be found in Section 6.6 and the plan to fund their purchase may be found in Chapter 7.
4.8 Lower Transportation Emissions
As global and local leaders grapple with the challenge of reducing the world’s greenhouse gas output, the role of transportation has begun to take a larger role. According to the California Air Resources Board, over 40 percent of California’s greenhouse gas emission originate from the transportation sector, the lion’s share of which is attributable to tailpipe emissions from personal vehicles. Many steps must be taken to reduce the impact that long-distance commuting in the Bay Area has on the global climate, but one of those steps is ensuring that commuters have access to low-carbon forms of transit. A full express bus carrying upward of 80 people has a much lower emissions footprint than those same people traveling in private cars. Additionally, as technology improves there is the possibility for partial or total electrification of the proposed fleet, further reducing greenhouse gas emissions. It is WCCTAC’s goal with its partners AC Transit and WestCAT to lower greenhouse gas emissions by encouraging riders to access transit via low-carbon modes or through the operation of a partially or fully zero-emission bus fleet.
4.9 West County Residential Density
Much of West Contra Costa County is composed of inner-ring suburbs, characterized by single family homes on small parcels interspersed with some multi-family housing developments. While many portions of West County west of I-80 are on gridded streets, the roadway network east of I-80 is winding and constrained by topography. Because of the lack of dense, multi-family housing and the time necessary to traverse many West County streets, it is far more efficient for commuters to travel to a central point and be picked up by a single transit vehicle, rather than receiving door-to-door transit service. This may change in the medium- to long-term future with the advent of autonomous shuttles, but as of the writing of this report the timeline for that seems far from certain.
Original PDF, page 14
® ®
WEST CONTRA COSTA COUNTY
EXPRESS BUS IMPLEMENTATION PLAN Final Plan | February 2020
5. PROPOSED ROUTES
This chapter describes the Plan’s recommendations for new express bus routes, the phasing of their implementation, and their service characteristics. Section 5.4 provides detailed profiles of each route, including origins, destination, transit connections, as well as all costs associated with its implementation and operation.
5.1 Route Network
A series of proposed express bus routes were developed, informed by travel market analysis, feedback from public outreach, and input from project stakeholders and project partners AC Transit and WestCAT.
Origins
On the origin side (West Contra Costa County), routes were developed to serve existing transit centers (Hercules Transit Center, Richmond Parkway Transit Center), major arterials (San Pablo Avenue, 23rd Street, Macdonald Avenue, Rumrill Boulevard/Harbour Way), and a series of proposed mobility hubs. Mobility hubs are proposed as a means of efficiently aggregating groups of riders, which is critical given the relative lack of high-density housing, coupled with the limited existing bicycle and pedestrian networks in much of the proposed service area. In order to provide an efficient and fast service, routes serving arterial segments will stop approximately every half-mile, using existing bus stops where possible. This is consistent with AC Transit’s policy on express bus stop spacing outlined in the agency’s Short Range Transit Plan.
Freeway Alignment
Between origin and destination segments, all proposed express bus routes would use the I-80 freeway, employing the HOV lanes to the extent possible. Richmond Parkway includes direct access ramps to I-80 HOV lanes south of the interchange. This allows buses to avoid having to merge across all lanes of heavily congested I-80, which is challenging for drivers and may result in travel time penalties. Therefore, route alignments were selected in part to leverage the benefits of the direct access ramps. Section 6.4 describes proposed Part-Time Transit Lanes that would allow buses to travel in the freeway auxiliary lane and on the shoulder through interchanges between Hercules Transit Center and Richmond Parkway, a segment approximately three miles in length, in order to both serve RPTC and use the direct access ramps. There are currently issues with high rates of HOV lane violations due to insufficient enforcement. To address this, a separate effort is underway between WCCTAC and MTC to work with the California Highway Patrol (CHP) to increase enforcement and thereby improve HOV performance.
Destinations
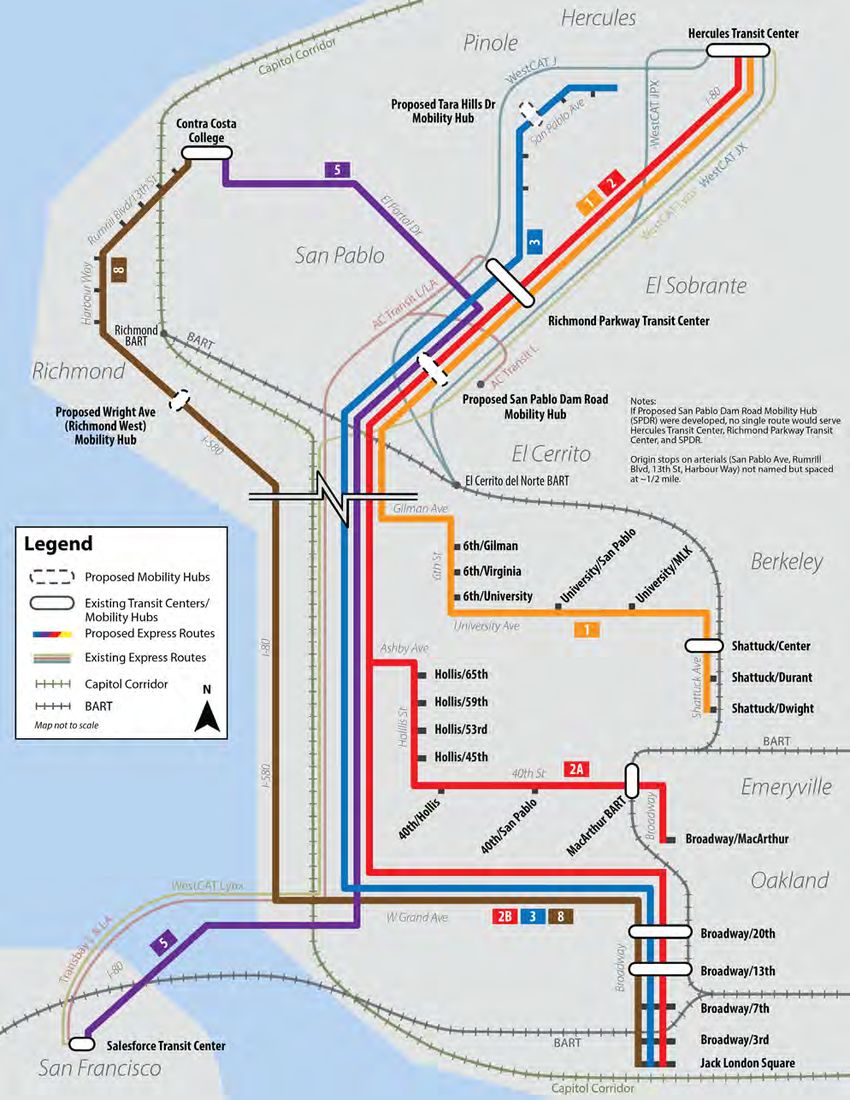
After traveling on I-80, the proposed routes would serve arterials in Berkeley, Emeryville, Oakland with stops roughly every half-mile, and the Salesforce Transit Center in San Francisco. Each of these destination markets would be served by a different route, except for routes 2 and 6, which would serve Oakland via Emeryville.
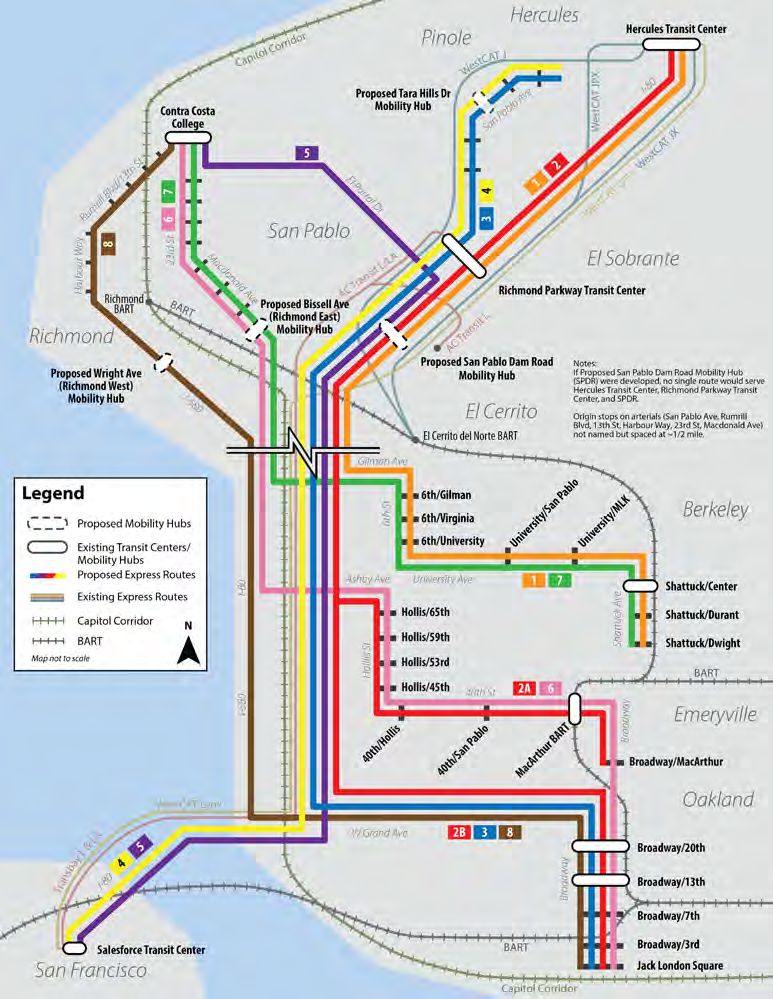
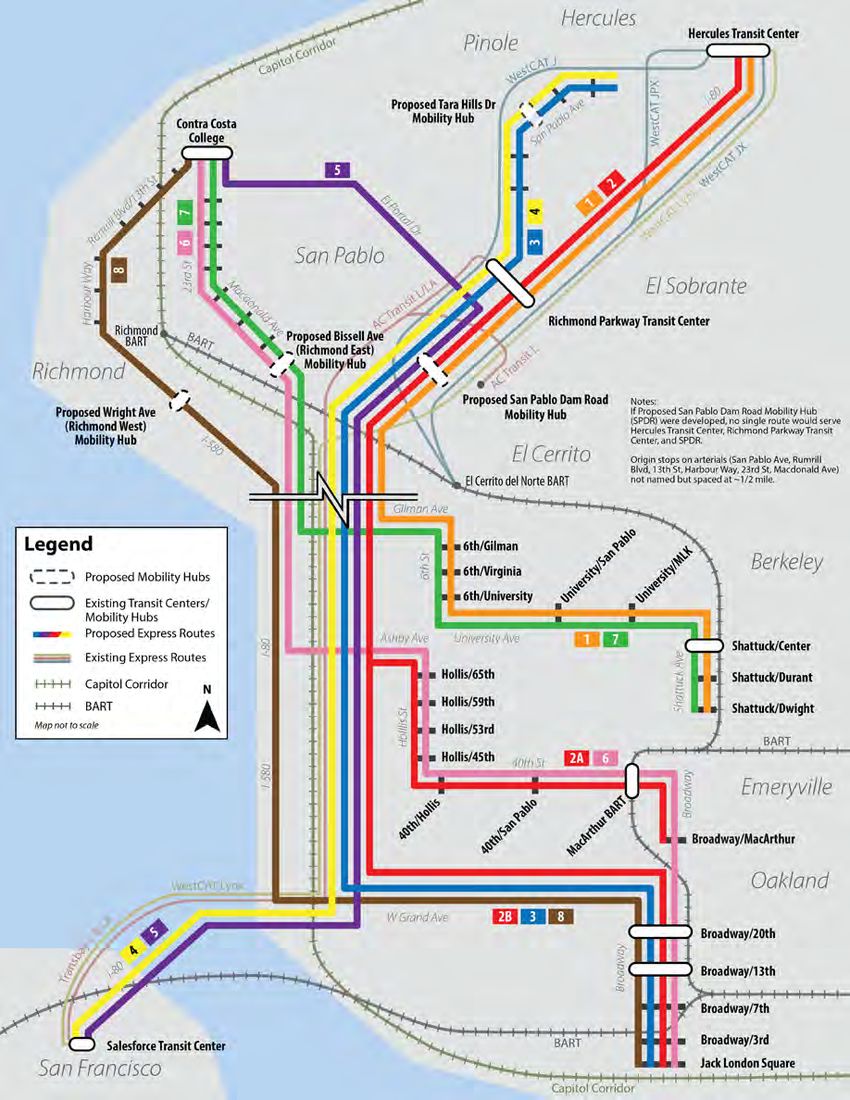
Figure 5-1 shows the eight proposed routes, numbered 1 through 8. Note that Route 2 is split into 2A and 2B in Alameda County. This represents the long-term goal of serving Oakland and Emeryville with separate routes originating from Hercules Transit Center. In the near term, Route 2 is proposed serve Oakland via Emeryville.
Figure 5-1 - Full System Map February 19, 2020
Original PDF, page 15
| Route | Operator | Cash Fare |
|---|---|---|
| 1 | WestCAT | $3.50 |
| 2 | $3.50 | |
| 2A | $3.50 | |
| 2B | $3.50 | |
| 3 | $3.50 | |
| 4 | $5.00 | |
| 5 | AC Transit | $5.50 |
| 6 | $2.50 | |
| 7 | $2.50 | |
| 8 | $2.50 |
| Route | Operator | Peak Only Service | Peak & Midday Service |
|---|---|---|---|
| 1 | WestCAT | $972,000 | $1,097,000 |
| 2 | $1,180,000 | $1,326,000 | |
| 2A | $1,097,000 | $1,222,000 | |
| 2B | $1,098,000 | $1,098,000 | |
| 3 | $1,037,000 | $1,159,000 | |
| 4 | $1,078,000 | $1,216,000 | |
| 5 | AC Transit | $1,650,000 | $1,881,000 |
| 6 | $1,603,000 | $1,796,000 | |
| 7 | $1,508,000 | $1,701,000 | |
| 8 | $1,655,000 | $1,842,000 |
® ®
WEST CONTRA COSTA COUNTY
EXPRESS BUS IMPLEMENTATION PLAN Final Plan | February 2020
5.2 Operational Parameters
Operational Approach
WestCAT currently operates service primarily between Hilltop Mall in northern Richmond and the Carquinez Bridge near Crockett. This includes the communities of Pinole, Hercules, Rodeo, Tara Hills, and El Sobrante. As noted previously, additional express bus service extends into El Cerrito and San Francisco. WestCAT is assumed to be the operator for any express bus service proposed by this Plan originating in locations within its current service area.
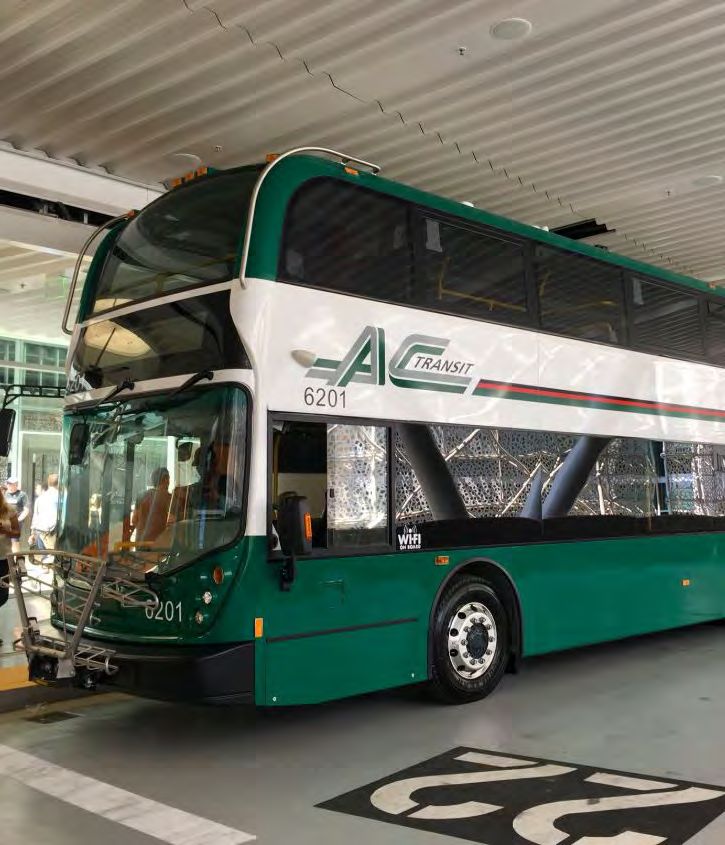
AC Transit currently operates service in the southern portion of West County (Hilltop Mall and south), extending through the western portion of Alameda County. Some of the agency’s routes extend into Santa Clara County. Additional express bus service operates into San Francisco. AC Transit is assumed to be the operator for any express bus service proposed by this Plan originating in locations within its current service area.
Service is proposed to initially operate during peak-periods only between West County and destinations in Alameda County and San Francisco. In the future or when funding allows, service may be expanded to be provided all-day. AC Transit currently operates its Transbay service in the peak-direction only, while WestCAT operates all of its services in both directions. The cost analysis contained in this document assumes peak- direction service only, but operators may choose to operate bidirectional service, with a range of cost implications. An Operating Plan with detailed schedules, frequencies, fare assumptions, farebox revenue assumptions, and costs is included in Appendix G.
Span
For the planned peak-period only service, southbound A.M. service would operate between 5:00 A.M. and 9:00 A.M. Northbound return trip service would operate between 3:00 P.M. and 7:00 P.M. Additional off-peak mid-day service was considered; timetables were developed that incorporated off-peak trips may be found in Appendix G. However, all subsequent cost estimates assume peak-only service.
Frequency
All routes are proposed to operate on 15- to 30-minute peak headways. During both A.M. and P.M. periods, service would run at 15-minute headways during the peak of the peak (6:30 A.M. to 8:30 A.M. and 4:00 P.M. to 6:00 P.M.). At all other times, buses would arrive every 20 to 30 minutes. Potential midday service is assumed to be operated with a single vehicle, resulting in frequencies ranging from 120 minutes to 150 minutes, depending on the length of the route.
O&M Costs
Operations and maintenance (O&M) costs would vary between routes given differences in route length, fleet size required to serve the route, and the operator serving the route. Estimated O&M costs are shown in Table 5-1. A detailed description of the methodology used in the development of these estimates may be found in Appendix G.
Table 5-1 - Annual O&M Cost Estimates by Route
Fares
Fares were set by examining existing fares charged by WestCAT and AC Transit. For Routes 1, 2, and 3, which would be operated by WestCAT, a fare of $3.50 is recommended, set between the cost of WestCAT’s local service ($1.75) and its Lynx service to San Francisco ($5.00). Route 4, which would run from Pinole and the Richmond Parkway Transit Center to San Francisco, a $5.00 fare is recommended, equivalent to the current Lynx fare.
Routes 5, 6, 7, and 8, would be operated by AC Transit. For Route 5, which would run from San Pablo and El Sobrante to San Francisco, a fare of $5.50 is recommended, equivalent to current AC Transit Transbay routes. Routes 6, 7, and 8, although running on I-80, have a similar end- to-end distance as existing regional routes such as the 1R and 72R, and would have the same cash fare of $2.50.
It is assumed that discounts and frequent rider incentives would be similar to current services. In the financial plan, detailed in Appendix H, fares are assumed to increase based on the rate of inflation (pegged to the Consumer Price Index, or CPI). The proposed fares for each route, shown in Table 5-2, are based on the first year of the Plan and are presented in 2020 dollars. For a detailed description of the methodology for determining proposed route fares, see Appendix G.
Table 5-2 - Proposed Cash Fares by Route
5.3 Route Prioritization
As described in more detail in Chapter 7, the financial feasibility of the Plan is highly dependent on funding considerations. If funding from RM3, which is likely to survive its legal challenge, and from the CCTA TEP, which is still dependent of future voter approval, is obtained, capital and operating funds for four routes will be available. To guide route implementation, routes have been divided into two groups, one to be implemented in the near term and the other to be implemented in the medium/long term as more funding become available. This prioritization was based on a combination of existing market demand and competitiveness over existing transit/auto travel. Geographic distribution, equity, existence of or implementation of supporting mobility hub infrastructure, and related or ongoing projects were also qualitatively considered in the prioritization process.
Existing Market Demand
An estimation of travel demand for each route’s alignment was made, referred to here as the “market size.” The market size for each route is the total number of people who:
- Live within an average walking distance (0.25 miles) of an origin bus stop served by the route or
- Live within short driving distance (2.5 miles) of a proposed or existing transit center/mobility hub served by the route and
- Work within walking distance (0.25 miles) of a destination bus stop served by the route.
Note: All fares reflect current fare levels. Fares are anticipated to increase with inflation Note: All costs in 2020 dollars February 19, 2020
Original PDF, page 16
| Route | Route Description | Origin | Destination | Estimated Travel Time (Minutes)* | ||
|---|---|---|---|---|---|---|
| Existing Auto | Existing Transit | Proposed Express Bus | ||||
| 1 | Hercules Transit Center, Richmond Parkway Transit Center to Berkeley | Hercules Transit Center | 6th St & Virginia St, Berkeley | 45 | 54 | 28 |
| University Ave & Shattuck Ave, Berkeley | 51 | 35 | 37 | |||
| Richmond Parkway Transit Center | 6th St & Virginia St, Berkeley | 36 | 61 | 21 | ||
| University Ave & Shattuck Ave, Berkeley | 42 | 31 | 30 | |||
| 2 | Hercules Transit Center, Richmond Parkway Transit Center to Emeryville & Oakland | Hercules Transit Center | Hollis St & 59th St, Emeryville | 51 | 60 | 34 |
| Broadway & Grand Ave, Oakland via Emeryville | 51 | 50 | 56 | |||
| Richmond Parkway Transit Center | Hollis St & 59th St, Emeryville | 43 | 55 | 27 | ||
| Broadway & Grand Ave, Oakland via Emeryville | 47 | 48 | 49 | |||
| 2A | Hercules Transit Center, Richmond Parkway Transit Center to Emeryville | Hercules Transit Center | Hollis St & 59th St, Emeryville | 51 | 60 | 34 |
| Richmond Parkway Transit Center | 43 | 55 | 27 | |||
| 2B | Hercules Transit Center, Richmond Parkway Transit Center to Oakland | Hercules Transit Center | Broadway & Grand Ave, Oakland | 51 | 50 | 38 |
| Richmond Parkway Transit Center | 47 | 48 | 31 | |||
| 3 | Pinole, Tara Hills Dr Mobility Hub, Richmond Parkway Transit Center to Oakland | San Pablo Ave & Appian Way | Broadway & Grand Ave, Oakland | 52 | 61 | 46 |
| San Pablo Ave & Tara Hills Avenue | 51 | 60 | 42 | |||
| Richmond Parkway Transit Center | 47 | 48 | 31 | |||
| 4 | Pinole, Tara Hills Dr Mobility Hub, Richmond Parkway Transit Center to Salesforce Transit Center | San Pablo Ave & Appian Way | SF Salesforce Transit Center | 81 | 64 | 65 |
| San Pablo Ave & Tara Hills Avenue | 80 | 67 | 61 | |||
| Richmond Parkway Transit Center | 56 | 55 | 50 | |||
| 5 | Contra Costa College, San Pablo Dam Road Mobility Hub to Salesforce Transit Center | San Pablo Dam Road Mobility Hub | SF Salesforce Transit Center | 69 | 70 | 51 |
| 6 | San Pablo, Richmond via 23rd St, Bissell Ave Mobility Hub to Emeryville & Oakland | 23rd Street & Rheem Avenue | Hollis St & 59th St, Emeryville | 32 | 56 | 36 |
| Broadway & Grand Ave, Oakland via Emeryville | 38 | 49 | 58 | |||
| Macdonald Avenue & 39th Street | Hollis St & 59th St, Emeryville | 26 | 50 | 23 | ||
| Broadway & Grand Ave, Oakland via Emeryville | 33 | 45 | 45 | |||
| 7 | San Pablo, Richmond via 23rd St, Bissell Ave Mobility Hub to Berkeley | 23rd Street & Rheem Avenue | 6th St & Virginia St, Berkeley | 25 | 53 | 27 |
| University Ave & Shattuck Ave, Berkeley | 33 | 36 | 39 | |||
| Macdonald Avenue & 39th Street | 6th St & Virginia St, Berkeley | 20 | 42 | 14 | ||
| University Ave & Shattuck Ave, Berkeley | 28 | 30 | 26 | |||
| 8 | San Pablo, Richmond via Rumrill Blvd, Harbour Way, Wright Ave Mobility Hub to Oakland | Rumrill Blvd & Market St | Broadway & Grand Ave, Oakland | 39 | 55 | 48 |
| Harbour Way & Macdonald Ave | 36 | 40 | 38 | |||
| Wright Ave Mobility Hub | 34 | 56 | 32 |
| Route | Origin(s) | Destination(s) | Est. Market Size |
|---|---|---|---|
| 1 | Hercules Transit Center, Richmond Parkway Transit Center | Berkeley | 1,200 |
| 2 | Hercules Transit Center, Richmond Parkway Transit Center | Emeryville & Oakland | 2,700 |
| 2A | Hercules Transit Center, Richmond Parkway Transit Center | Emeryville | 900 |
| 2B | Hercules Transit Center, Richmond Parkway Transit Center | Oakland | 1,800 |
| 3 | Pinole, Tara Hills via San Pablo Ave, Proposed Tara Hills Dr Mobility Hub, Richmond Parkway Transit Center | Oakland | 1,200 |
| 4 | Pinole, Tara Hills via San Pablo Ave, Proposed Tara Hills Dr Mobility Hub, Richmond Parkway Transit Center | Salesforce Transit Center | 1,500 |
| 5 | Contra Costa College, Proposed San Pablo Dam Road Mobility Hub | Salesforce Transit Center | 500 |
| 6 | San Pablo, Richmond via 23rd St, Proposed Bissell Ave Mobility Hub | Emeryville & Oakland | 2,500 |
| 7 | San Pablo, Richmond via 23rd St, Proposed Bissell Ave Mobility Hub | Berkeley | 1,700 |
| 8 | San Pablo, Richmond via Rumrill Blvd, Proposed Wright Ave Mobility Hub | Oakland | 1,200 |
® ®
WEST CONTRA COSTA COUNTY
EXPRESS BUS IMPLEMENTATION PLAN Final Plan | February 2020 This analysis was completed using data from the Longitudinal Employer-Housing Dynamic (LEHD) program (2017 data), a product of the U.S. Census, which uses survey data to estimate the place of residence and employment for all workers. The unique market size for each route is shown in Table 5-3. For detailed explanation of this methodology, see Appendix A.
Table 5-3 - Estimated Market Size by Route
Travel Time Competitiveness
For a transit service to attract new riders, it must present an appealing alternative to workers’ current commutes. Though riding a bus has natural advantages over driving a car by oneself, such as the ability to read, do work, or sleep, the duration of a commute cannot be discounted. In that regard, the express bus routes proposed in this Plan have some advantages over existing transit, in that they serve areas directly previously only accessible by a two- or three-seat transit ride, reducing total commute time and the unpredictability inherent in transferring between modes.
Additionally, the bus routes can compare favorably to auto-based commutes. Though commuting via bus is inherent less direct that driving, express buses are permitted to use the HOV lanes on I-80. Capital improvements proposed in Chapter 6, such a transit signal priority and part-time transit lanes on I-80, would further improve the travel times of the proposed routes.
An analysis was conducted to estimate comparative travel times between the proposed routes and existing options. Table 5-4 shows estimated travel times via automobile, existing transit, and the proposed express routes for several points along each route. This analysis assumes a southbound trip departing at 7:30 A.M. Existing auto trips were estimated on a point-to-point basis without using carpool lanes. The travel time estimates for the Plan’s express bus routes assume Table 5-4 - Estimated Travel Times by Route February 19, 2020 February 19, 2020
- Assuming southbound trip departing at 7:30 A.M. using I-80 HOV but no other capital improvements
Original PDF, page 17
® ®
WEST CONTRA COSTA COUNTY
EXPRESS BUS IMPLEMENTATION PLAN Final Plan | February 2020 that the routes follow the proposed alignments and use the HOV lane on I-80, but do not assume implementation of any additional capital improvements, such as those proposed in Chapter 6. Many of these routes would previously require transfers and the associated waiting time between transfers. Eliminating the transfer results in a significant time savings.
For a detailed description of the methodology used in route prioritization and quantitative competitiveness index, see Appendix A.
Near-Term Routes
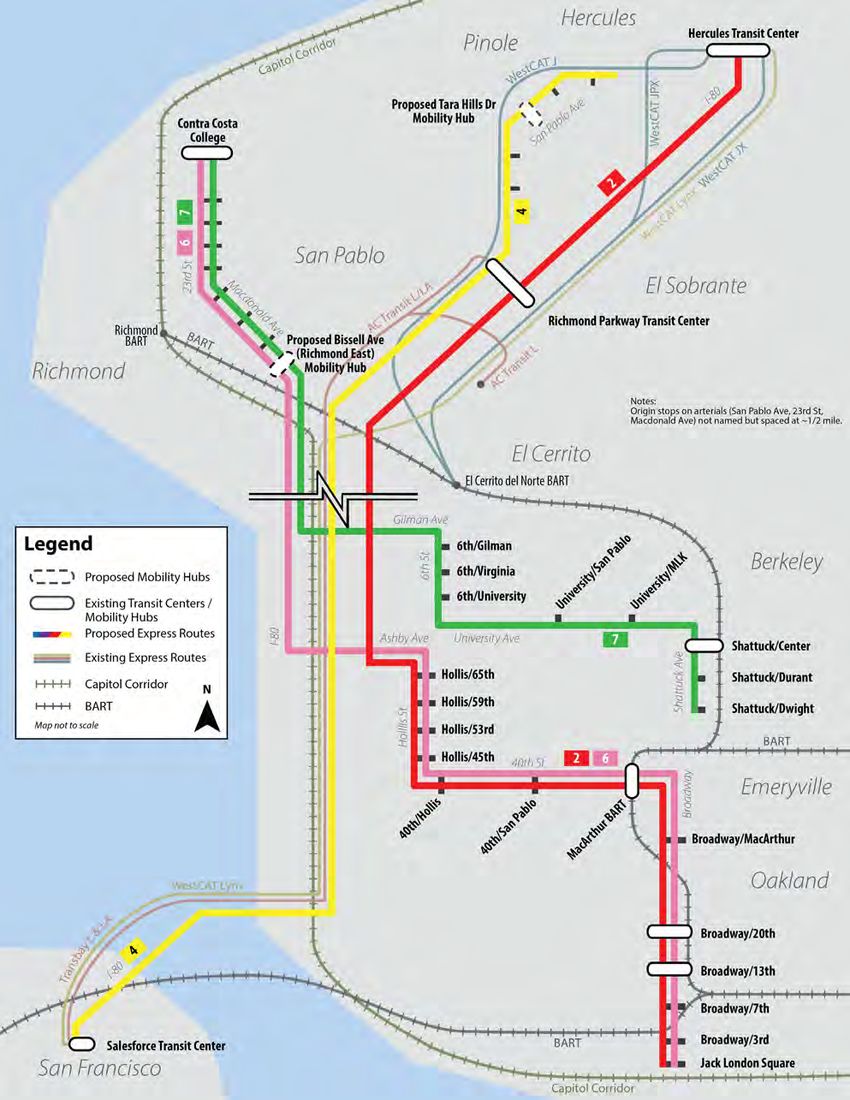
Routes 2, 4, 6, and 7 are recommended to be implemented in the near term. They represent the alignments that are associated with a combination of large travel markets and high travel time savings over existing transit options. These routes are shown in Figure 5-2.
Route 2 serves both Emeryville and Oakland from Hercules Transit Center and Richmond Parkway Transit Center. This route has a large market size, due to the high concentration of employment in both destination cities. Travel time savings compared to existing transit are very high for destinations in Emeryville, since there is no existing direct BART service, forcing riders to transfer to the Emery Go-Round shuttle. Travel time savings to Oakland via Emeryville are not as substantial, due to high-quality existing transit and the indirect route that the bus would take through Emeryville.
Route 4 serves the San Francisco Salesforce Transit Center via San Pablo Avenue and Richmond Parkway from Pinole and Tara Hills. The route has a relatively large market size, due to the large number of people employed in Downtown San Francisco. Travel time savings are high compared to existing transit and auto alternatives, due to the lack of transfers and use of HOV lanes. The travel market on San Pablo Avenue through Pinole is not well-served by existing express transit that would provide a single-seat ride to San Francisco. While prospective riders currently have the option to board transbay services at Richmond Parkway Transit Center, the early fill time of the parking lot makes it difficult to access the service for many users and the option to board at Hercules Transit Center would require significant back-tracking to the north.
Route 6 serves Emeryville and Oakland from San Pablo and Central/South Richmond. This route has a large market size and would serve several MTC-designated Communities of Concern, home to a large population with low incomes and limited access to personal automobiles.
Travel time savings compared to existing transit are mostly high due to the current need to transfer once (to Oakland) or twice (to Emeryville).
However, end-to-end travel on the proposed route (from north Richmond/San Pablo to Downtown Oakland) would take more time than via existing transit, due to the fact that the bus travels to Oakland via Emeryville rather than directly. Compared to existing auto, this route would not offer a great improvement over existing conditions but would serve as an option for those with limited auto access.
Route 7 serves Berkeley from San Pablo and Central/Southern Richmond. This route has a relatively large market size and would serve several MTC-designated Communities of Concern, home to a large population with low incomes and limited access to personal automobiles. The route provides moderate time savings, with higher savings compared to existing transit in its service to West Berkeley and higher savings relative to auto in its service to Downtown Berkeley.
Figure 5-2 – Near Term Routes System Map February 19, 2020
Original PDF, page 18
| Population Segment | Residents | Percent of Total in West County |
|---|---|---|
| Total West County population | 262,000 | 100% |
| Within 0.5 miles of a proposed express bus stop | ||
| All residents | 68,000 | 26% |
| Workers | 31,000 | 25% |
| Low and moderate income individuals | 37,000 | 34% |
| Hispanic or non-white individuals | 59,000 | 30% |
| Households with no car available | 2,300 | 32% |
| Proportion of | all West County residents who are... | those served by 4 near- term routes who are... | those served by all 8 routes who are... |
|---|---|---|---|
| ...Low or moderate income individuals | 42% | 54% | 56% |
| ...Hispanic or non-white individuals | 75% | 86% | 88% |
| ...Households with no car available | 8% | 10% | 11% |
® ®
WEST CONTRA COSTA COUNTY
EXPRESS BUS IMPLEMENTATION PLAN Final Plan | February 2020
Medium/Long-Term Routes
Routes 1, 3, 5, and 8 are recommended to be implemented in the medium/long-term as additional funding beyond that identified in this Plan becomes available. These routes represent still-viable but smaller commute markets, or those with less substantial travel time benefits over existing transit. In addition to the new routes, Route 2 is recommended to be split into Routes 2A and 2B, each of which would originate from Hercules Transit Center and Richmond Parkway Transit Center, but would serve Emeryville and Oakland separately rather than serving Oakland via Emeryville. This split would provide shorter, more reliable service to Oakland and could be more desirable to potential riders, but at significantly higher cost than running only Route 2. The routes are shown in Figure 5-3.
Chapter 7 describes the proposed funding plan. Under a desirable funding scenario sufficient funds would be available to operate the proposed near-term routes, but not any of the medium/long-term routes. It is recommended that they be considered if additional funding for express bus service is identified.
5.4 Equity Analysis
Not only does transit play an important role in moving people in a space- and energy-efficient fashion on congested corridors, it can also serve a crucial social equity purpose. Many people, because of limited financial means or due to physical disability, are not able to commute to work via automobile; for these people, transit provides an indispensable link between home and work. Additionally, due to the increasing cost of living in the Bay Area, more people with jobs based in the dense employment centers served by the proposed routes are choosing to move to locations with comparatively more affordable housing costs, such as West County.
To determine which of West County’s roughly quarter-million residents would be served by the proposed express service, an analysis was conducted comparing those living within the walkshed of the express bus service area (defined as 0.5 miles from all proposed stops and transit centers) to the residential population of the wider West County subregion. While the overall population anticipated to access the service is greater than just the 0.5 mile walkshed, the ability to access the service by foot is a valuable feature, particularly for low-income populations.
Table 5-5 shows that the proposed express service would be within walking distance of approximately one quarter (26%) of West County’s workers, but nearly a third of its low/moderate income individuals (34%) and its carless households (32%). Table 5-6 compares the demographic makeup of West County with the population characteristics of people and households served by the four near-term routes and the full, eight-route system. Both the near-term routes and the full proposed network would serve low/moderate income people, Hispanic or non-white individuals, and carless households at higher rates than they appear in the wider West County subregion.
Overall, these results suggest that the proposed express service could provide substantial benefits to marginalized populations in West County and those who might rely on transit for their journey to work at a rate equal to or greater than the benefits provided to the overall population. For a full description of the methodology used, see Appendix A.
Figure 5-3 – Medium/Long Term Routes System Map February 19, 2020 Table 5-5 - Individuals and HH Served by Proposed Routes Table 5-6 - Characteristics of County and Served Population Source: American Community Survey 2017 Source: American Community Survey 2017
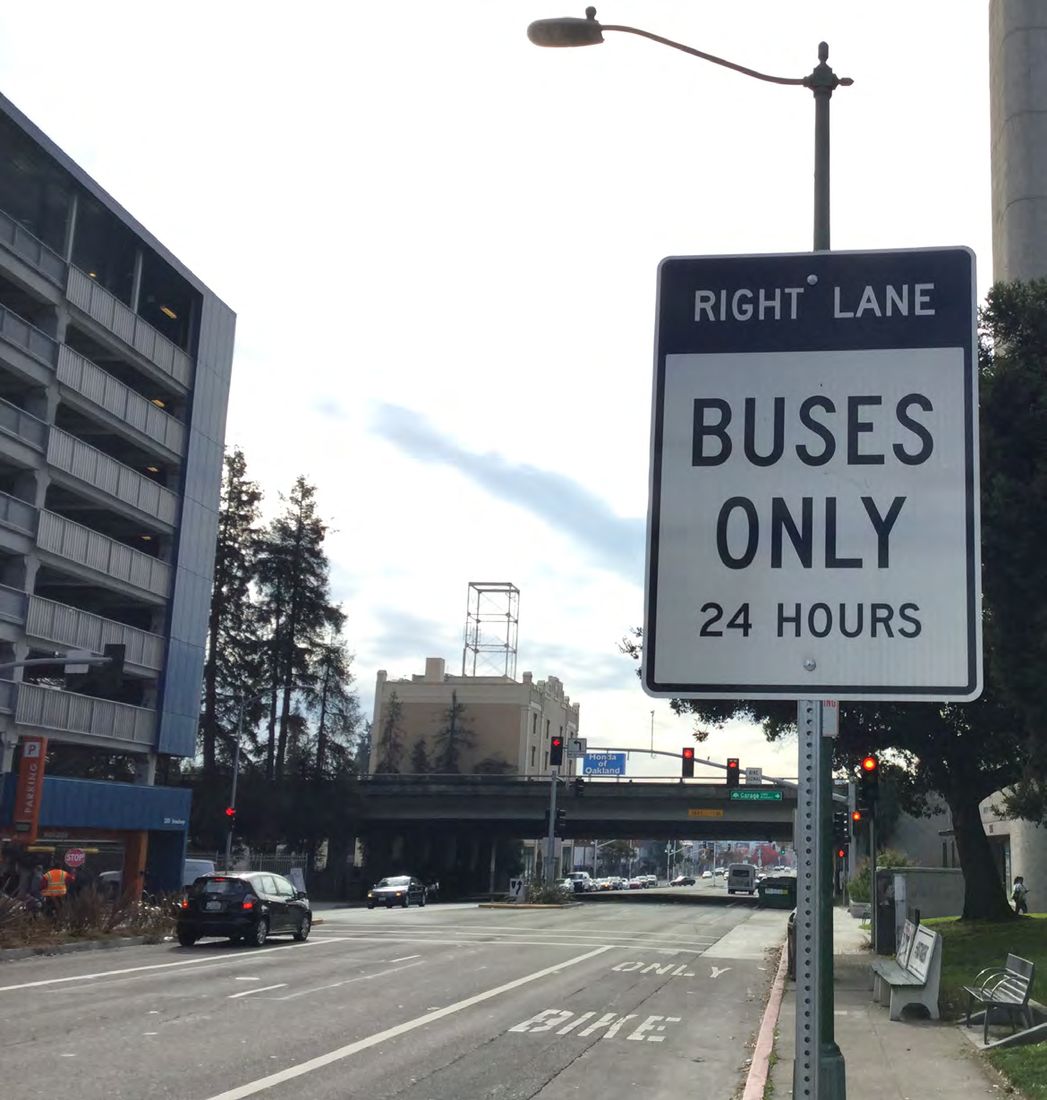
Original PDF, page 19
® ®
WEST CONTRA COSTA COUNTY
EXPRESS BUS IMPLEMENTATION PLAN Final Plan | February 2020
5.5 Route Profiles
The following pages present Route Profiles for routes 1-8, depicting the specific route alignment, origin-destination characteristics, associated capital project recommendations, and other key information.
Capital improvements associated with each route were divided into two categories: “Required” and “Optimal.” Required capital improvements are those deemed necessary for the operation of the route, such as bus stops with benches and shelters. Optimal improvements are those that are highly recommended and would lead to the best rider experience with respect to comfort, convenience, and travel time, but are not strictly necessary for operation. All optimal improvements are recommended and should be pursued as available funding is identified. Each capital improvement project is assigned an identification number. For full descriptions of each project, see Chapter 6. Note that many projects would improve multiple routes - thus the costs for both required and optimal improvements includes significant overlap between all routes.
Market size is based on the estimate of existing population who (1) live within walking distance of a proposed origin arterial stop or short driving distance of a proposed/existing transit center or mobility hub and (2) work within 0.25 miles of a destination stop. All data were gathered from the 2017 Longitudinal Employer-Household Dynamics program, a product of the U.S. Census. Market size estimates do not take into account future population and employment growth. For a detailed description of market size, see Appendix A.
Route subsidy was calculated based on a conservative assumption of ridership, based on existing capture rates (the actual share of commuters who use the service to commute compared to those who could) of AC Transit Transbay buses and WestCAT Lynx.
Travel times were estimated between several origins and destinations on each route using Google Maps and Waze, assuming a peak-hour (7:30 A.M.), peak-direction (southbound) departure. Proposed express bus travel times assumes travel along the route alignment and use of the I-80 HOV lane. Existing auto travel time assumes a direct trip between origin and destination without using the I-80 HOV lane. Existing transit travel time represents an average trip length for all trips leaving after 7:00 A.M. and before 8:00 A.M. For a detailed description of travel time methodology, see Appendix A.
Notes on Route Alignment Considerations
Routes 1 and 2 (along with Routes 2A and 2B) are proposed to serve both Hercules Transit Center and Richmond Parkway Transit Center, both of which are currently at or near parking capacity. Though this Plan proposes construction of additional automobile parking at each, development of structured parking is expensive and requires an extensive project development process. Securing funding, completing engineering design, and completing construction will take several years. Until additional auto parking is provided, ridership of some of the proposed routes may be constrained due to limited parking supply.
Serving both transit centers is anticipated to maximize ridership and serve both the Hercules and Richmond markets. The proposed bus- on-shoulder operation on I-80 between SR-4 and Richmond Parkway as well as the modifications to bus facilities at the Richmond Parkway Transit Center would limit (or even potentially completely offset) the travel time delay associated with stopping at Richmond Parkway Transit Center relative to existing conditions. As with all of the services proposed, it is recommended to continually evaluate the service after implementation for fine-tuning and optimization. If buses are filled up upon leaving Hercules Transit Center then there would not be a benefit to also stopping at Richmond Parkway Transit Center and it would be recommended to split the route into two routes, with one having its only origin stop at Hercules Transit Center and the other having its only origin stop at Richmond Parkway Transit Center.
Route 5 is proposed to start at Contra Costa College (along with Routes 6, 7, and 8) and then use El Portal Dr to access a proposed mobility hub at San Pablo Dam Road. Congestion between the College and San Pablo Dam Road is currently high. The origination is proposed for the College to provide a connection to local bus services, existing layover space, and existing driver facilities. If it is determined that the travel time and variability associated with connecting between the College and San Pablo Dam Road is too high, then the route may be modified to have a different origination point, either at the proposed San Pablo Dam Road Mobility Hub (see Section 6.5) or at Princeton Plaza.
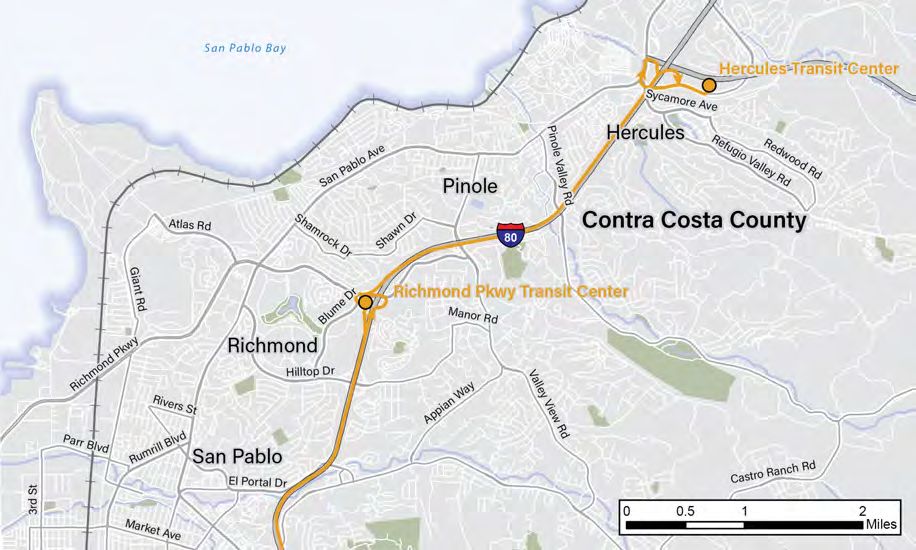
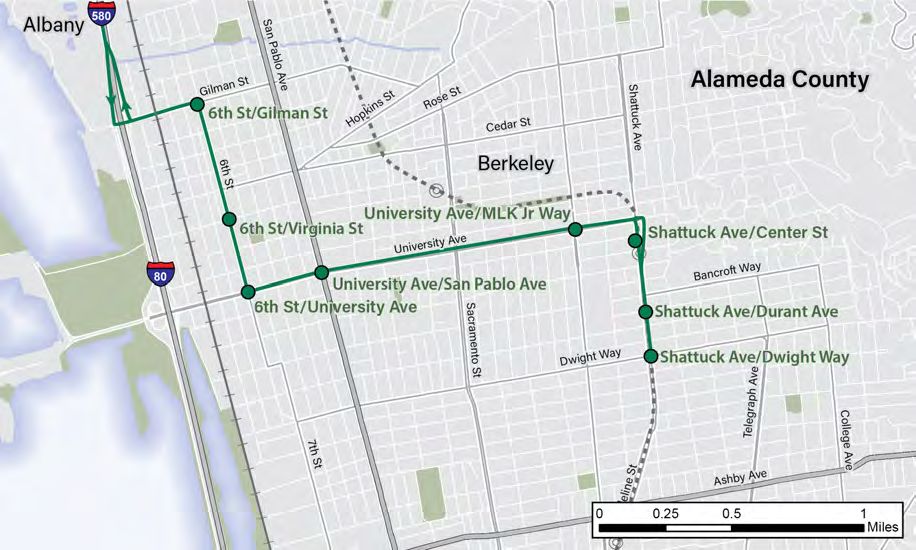
Original PDF, page 20
| Required Capital Improvements | |
|---|---|
| Project # | Project Name |
| BS4 | Bus Stop Upgrades on 6th Street/University Blvd/Shattuck Avenue (Berkeley) |
| BA2 | Buses for Medium-/Long-Term Routes |
| Optimal Capital Improvements | |
|---|---|
| Project # | Project Name |
| TL1 | I-80 Part-Time Transit Lanes |
| FA1 | Richmond Parkway/I-80 Access Improvement |
| FA2 | SR-4/I-80 Access Improvement |
| TSP4 | TSP on 6th Street/Shattuck Avenue (Berkeley) |
| TC1 | Hercules Transit Center Capacity Enhancement |
| TC2/TC2-I | Richmond Parkway Transit Center Capacity/Access Enhancements |
| Capital Improvements Costs | Annual O&M Cost: $1,090,000 | |
|---|---|---|
| Required | $ 8,621,000 | |
| Full (Required + Optimal) | $ 85,317,000 |
| Estimated Travel Times (Minutes) | ||||
|---|---|---|---|---|
| Origin | Destination | Proposed Express Bus | Existing Transit | Existing Auto |
| Hercules Transit Center | 6th St & Virginia St, Berkeley | 28 | 54 | 45 |
| Hercules Transit Center | University Ave & Shattuck Ave, Berkeley | 37 | 35 | 51 |
| Richmond Parkway Transit Center | 6th St & Virginia St, Berkeley | 21 | 61 | 36 |
| Richmond Parkway Transit Center | University Ave & Shattuck Ave, Berkeley | 30 | 31 | 42 |
® ®
WEST CONTRA COSTA COUNTY
EXPRESS BUS IMPLEMENTATION PLAN Final Plan | February 2020
Route 1 - Hercules Transit Center, Richmond Parkway Transit Center to Berkeley
Phase: Medium/Long
Proposed Operator: WestCAT
Bus Fleet Size:
Destination Transit Connections
AC Transit: Downtown Berkeley Transit Center Capitol Corridor: Berkeley Station BART: Downtown Berkeley Station
Key Destinations Served
West Berkeley Downtown Berkeley Alta Bates Summit Medical Center
Markets Served
Hercules Pinole Richmond Rodeo Crockett I-80 Commuters
Market Size
~1200 Commuters
Origin Transit Connections
WestCAT:
JR/JL, 10, 11, 12, 15, 16, 17, 18 19, 30Z, C3
AC Transit:
70, 71
Origin Alignment
Destination Alignment
Note: Market size defined as population whose current commute would be served by route. See Appendix A for full methodology. All costs are in 2020 dollars.
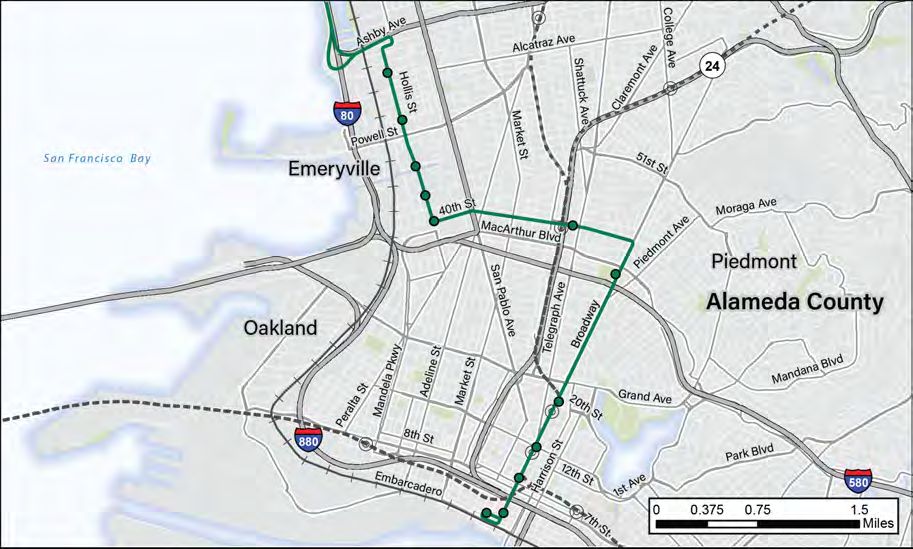
Original PDF, page 21
| Required Capital Improvements | |
|---|---|
| Project # | Project Name |
| BS5 | Bus Stop Upgrades on Hollis Street/40th Street/Broadway (Emeryville, Oakland) |
| BS6 | Bus Stop Upgrades on Broadway (Oakland) |
| BA1 | Buses for Near-Term Routes |
| Optimal Capital Improvements | |||
|---|---|---|---|
| Project # | Project Name | ||
| TL1 | I-80 Part-Time Transit Lanes | ||
| FA1 | SR-4/John Muir Parkway/I-80 Access Improvement | ||
| FA2 | Richmond Parkway/I-80 Access Improvement | ||
| TSP5 | TSP on Hollis Street, 40th Street (Emeryville, Oakland) | ||
| TC1 | Hercules Transit Center Capacity Enhancement | ||
| TC2/TC2-I | Richmond Parkway Transit Center Capacity/Access Enhancements | ||
| Capital Improvements Costs | Annual O&M Cost: $1,360,000 | ||
| Required | $ 10,944,000 | ||
| Full (Required + Optimal) | $ 87,740,000 |
| Estimated Travel Times (Minutes) | ||||
|---|---|---|---|---|
| Origin | Destination | Proposed Express Bus | Existing Transit | Existing Auto |
| Hercules Transit Center | Hollis St & 59th St, Emeryville | 34 | 60 | 51 |
| Richmond Parkway Transit Center | Hollis St & 59th St, Emeryville | 27 | 55 | 43 |
| Hercules Transit Center | Broadway & Grand Ave, Oakland via Emeryville | 56 | 50 | 51 |
| Richmond Parkway Transit Center | Broadway & Grand Ave, Oakland via Emeryville | 49 | 48 | 47 |
® ®
WEST CONTRA COSTA COUNTY
EXPRESS BUS IMPLEMENTATION PLAN Final Plan | February 2020
Route 2 - Hercules Transit Center, Richmond Parkway Transit Center to Emeryville & Oakland
Phase: Near
Proposed Operator: WestCAT
Bus Fleet Size:
Destination Transit Connections
AC Transit: 1R, 72R Capitol Corridor: Emeryville Station Emery Go-Round: Hollis, Hollis South, Shellmound-Powell, Watergate Express AC Transit: 20th Street Transit Center, East Bay BRT Capitol Corridor: Jack London Square BART: MacArthur Station, 19th St/Oakland Station, 12th St/Oakland City Center Station
Key Destinations Served
Hollis Street Employment Corridor Kaiser Permanente Oakland Alta Bates Summit Medical Center Uptown Oakland Downtown Oakland Jack London Square
Markets Served
Hercules Pinole Richmond Rodeo Crockett I-80 Commuters
Market Size
~2700 Commuters
Origin Transit Connections
WestCAT:
JR/JL, 10, 11, 12, 15, 16, 17, 18 19, 30Z, C3
AC Transit:
70, 71
Origin Alignment
Destination Alignment
Note: Market size defined as population whose current commute would be served by route. See Appendix A for full methodology. All costs are in 2020 dollars.
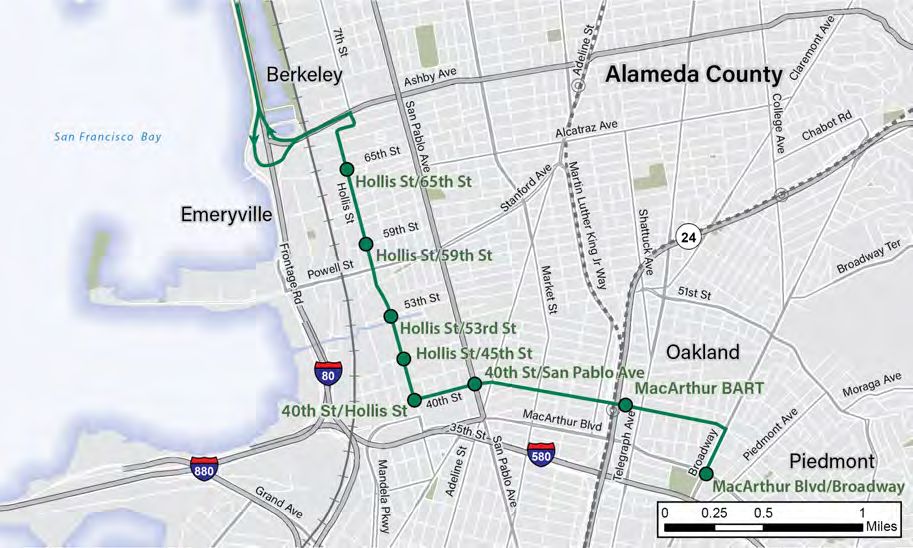
Original PDF, page 22
| Bus Fleet Size: 9 | |||
|---|---|---|---|
| Required Capital Improvements | |||
| Project # | Project Name | ||
| BS5 | Bus Stop Upgrades on Hollis Street/40th Street/Broadway (Emeryville, Oakland) | ||
| BA2 | Buses for Medium-/Long-Term Routes | ||
| Optimal Capital Improvements | |||
| Project # | Project Name | ||
| TL1 | I-80 Part-Time Transit Lanes | ||
| FA1 | SR-4/John Muir Parkway/I-80 Access Improvement | ||
| FA2 | Richmond Parkway/I-80 Access Improvement | ||
| TSP5 | TSP on Hollis Street, 40th Street (Emeryville, Oakland) | ||
| TC1 | Hercules Transit Center Capacity Enhancement | ||
| TC2/TC2-I | Richmond Parkway Transit Center Capacity/Access Enhancements | ||
| Capital Improvements Costs | Annual O&M Cost: $1,244,000 | ||
| Required | $ 9,611,000 | ||
| Full (Required + Optimal) | $ 86,407,000 |
| Estimated Travel Times (Minutes) | ||||
|---|---|---|---|---|
| Origin | Destination | Proposed Express Bus | Existing Transit | Existing Auto |
| Hercules Transit Center | Hollis St & 59th St, Emeryville | 34 | 60 | 51 |
| Richmond Parkway Transit Center | Hollis St & 59th St, Emeryville | 27 | 55 | 43 |
® ®
WEST CONTRA COSTA COUNTY
EXPRESS BUS IMPLEMENTATION PLAN Final Plan | February 2020
Route 2A - Hercules Transit Center, Richmond Parkway Transit Center to Emeryville
Phase: Medium/Long
Proposed Operator: WestCAT
Destination Transit Connections
AC Transit: 1R, 72R Capitol Corridor: Emeryville Station BART: MacArthur Station Emery Go-Round: Hollis, Hollis South, Shellmound-Powell, Watergate Express
Key Destinations Served
Hollis Street Employment Corridor Kaiser Permanente Oakland Alta Bates Summit Medical Center
Markets Served
Hercules Pinole Richmond Rodeo Crockett I-80 Commuters
Market Size
~900 Commuters
Origin Transit Connections
WestCAT:
JR/JL, 10, 11, 12, 15, 16, 17, 18 19, 30Z, C3
AC Transit:
70, 71
Origin Alignment
Destination Alignment
Note: Market size defined as population whose current commute would be served by route. See Appendix A for full methodology. All costs are in 2020 dollars.
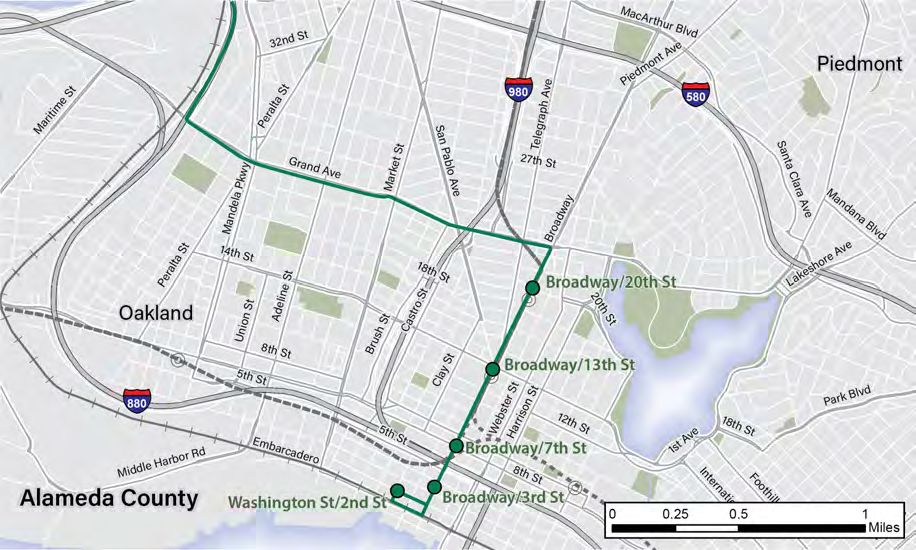
Original PDF, page 23
| Bus Fleet Size: 9 | |
|---|---|
| Required Capital Improvements | |
| Project # | Project Name |
| BS6 | Bus Stop Upgrades on Broadway (Oakland) |
| BA2 | Buses for Medium-/Long-Term Routes |
| Optimal Capital Improvements | |
|---|---|
| Project # | Project Name |
| TL1 | I-80 Part-Time Transit Lanes |
| FA1 | SR-4/John Muir Parkway/I-80 Access Improvement |
| FA2 | Richmond Parkway/I-80 Access Improvement |
| TSP6 | TSP on Grand Avenue (Oakland) |
| TC1 | Hercules Transit Center Capacity Enhancement |
| TC2/TC2-I | Richmond Parkway Transit Center Capacity/Access Enhancements |
| Capital Improvements Costs | Annual O&M Cost: $1,253,000 | |
|---|---|---|
| Required | $ 9,333,000 | |
| Full (Required + Optimal) | $ 86,009,000 |
| Estimated Travel Times (Minutes) | ||||
|---|---|---|---|---|
| Origin | Destination | Proposed Express Bus | Existing Transit | Existing Auto |
| Hercules Transit Center | Broadway & Grand Ave, Oakland | 38 | 50 | 51 |
| Richmond Parkway Transit Center | Broadway & Grand Ave, Oakland | 31 | 48 | 47 |
® ®
WEST CONTRA COSTA COUNTY
EXPRESS BUS IMPLEMENTATION PLAN Final Plan | February 2020
Route 2B - Hercules Transit Center, Richmond Parkway Transit Center to Oakland
Phase: Medium/Long
Proposed Operator: WestCAT
Destination Transit Connections
AC Transit: 20th Street Transit Center, East Bay BRT Capitol Corridor: Jack London Square BART: 19th St/Oakland Station, 12th St/Oakland City Center Station
Key Destinations Served
Uptown Oakland Downtown Oakland Jack London Square
Markets Served
Hercules Pinole Richmond Rodeo Crockett I-80 Commuters
Market Size
~1800 Commuters
Origin Transit Connections
WestCAT:
JR/JL, 10, 11, 12, 15, 16, 17, 18 19, 30Z, C3
AC Transit:
70, 71
Origin Alignment
Destination Alignment
Note: Market size defined as population whose current commute would be served by route. See Appendix A for full methodology. All costs are in 2020 dollars.
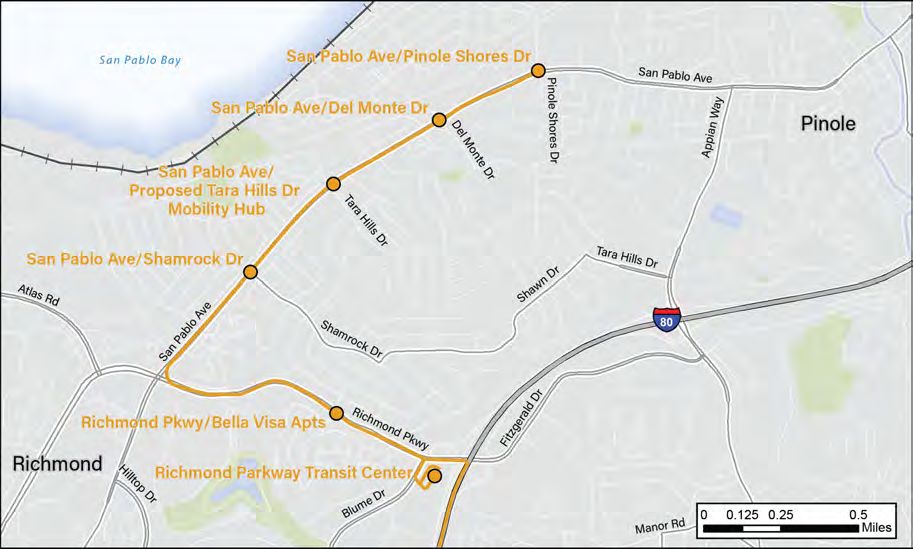
Original PDF, page 24
| Bus Fleet Size: 9 | |
|---|---|
| Required Capital Improvements | |
| Project # | Project Name |
| BS1 | Bus Stop Upgrades on San Pablo Avenue, Richmond Parkway (Pinole, Richmond, Contra Costa County) |
| BS6 | Bus Stop Upgrades on Broadway (Oakland) |
| MH1 | Tara Hills Drive Mobility Hub (Option 1) |
| BA2 | Buses for Medium-/Long-Term Routes |
| Optimal Capital Improvements | |||
|---|---|---|---|
| Project # | Project Name | ||
| FA2 | Richmond Parkway/I-80 Access Improvement | ||
| MH2 | Tara Hills Drive Mobility Hub (Option 2) | ||
| TSP6 | TSP on Grand Avenue (Oakland) | ||
| TC2/TC2-I | Richmond Parkway Transit Center Capacity/Access Enhancements | ||
| Capital Improvements Costs | Annual O&M Cost: $1,195,000 | ||
| Required | $ 13,373,000 | ||
| Full (Required + Optimal) | $ 74,249,000 |
| Estimated Travel Times (Minutes) | ||||
|---|---|---|---|---|
| Origin | Destination | Proposed Express Bus | Existing Transit | Existing Auto |
| San Pablo Ave & Tara Hills Avenue | Broadway & Grand Ave, Oakland | 42 | 60 | 51 |
| Richmond Parkway Transit Center | Broadway & Grand Ave, Oakland | 31 | 48 | 47 |
® ®
WEST CONTRA COSTA COUNTY
EXPRESS BUS IMPLEMENTATION PLAN Final Plan | February 2020
Route 3 - Pinole, Tara Hills Dr Mobility Hub, Richmond Parkway Transit Center to Oakland
Phase: Medium/Long
Proposed Operator: WestCAT
Destination Transit Connections
AC Transit: 20th Street Transit Center, East Bay BRT Capitol Corridor: Jack London Square BART: 19th St/Oakland Station, 12th St/Oakland City Center Station
Key Destinations Served
Uptown Oakland Downtown Oakland Jack London Square
Markets Served
Pinole Richmond I-80 Commuters
Market Size
~1300 Commuters
Origin Transit Connections
WestCAT:
JL/JR, 16, 17, 18, 19, C3
AC Transit:
70, 71
Origin Alignment
Destination Alignment
Note: Market size defined as population whose current commute would be served by route. See Appendix A for full methodology. All costs are in 2020 dollars.
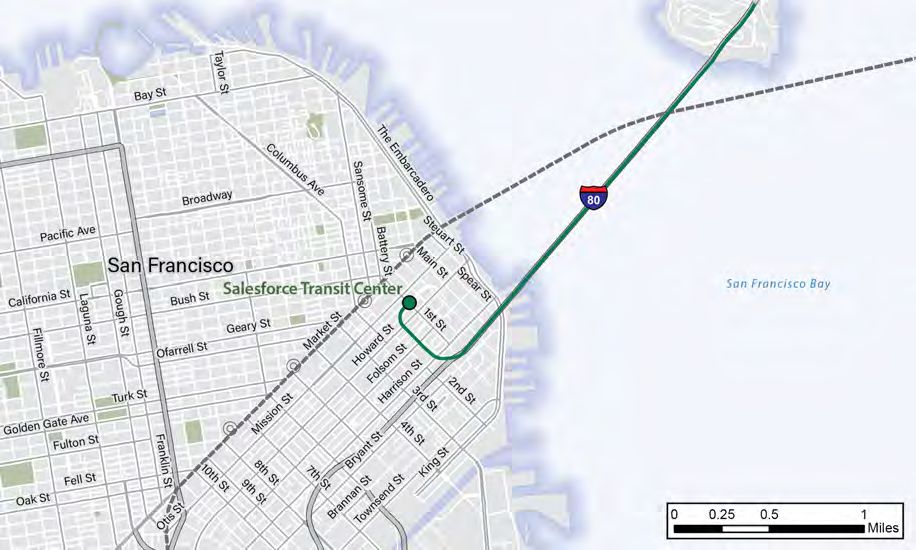
Original PDF, page 25
| Bus Fleet Size: 9 | |
|---|---|
| Required Capital Improvements | |
| Project # | Project Name |
| BS1 | Bus Stop Upgrades on San Pablo Avenue, Richmond Parkway (Pinole, Richmond, Contra Costa County) |
| MH1 | Tara Hills Drive Mobility Hub (Option 1) |
| BA1 | Buses for Near-Term Routes |
| Optimal Capital Improvements | |
|---|---|
| Project # | Project Name |
| FA2 | Richmond Parkway/I-80 Access Improvement |
| MH2 | Tara Hills Drive Mobility Hub (Option 2) |
| TC2/TC2-I | Richmond Parkway Transit Center Capacity/Access Enhancements |
| Capital Improvements Costs | Annual O&M Cost: $1,240,000 | ||||
|---|---|---|---|---|---|
| Required | $ 13,040,000 | ||||
| Full (Required + Optimal) | $ 73,716,000 | ||||
| Estimated Travel Times (Minutes) | |||||
| Origin | Destination | Proposed Express Bus | Existing Transit | Existing Auto | |
| San Pablo Ave & Tara Hills Avenue | SF Salesforce Transit Center | 61 | 67 | 80 | |
| Richmond Parkway Transit Center | SF Salesforce Transit Center | 50 | 55 | 56 |
® ®
WEST CONTRA COSTA COUNTY
EXPRESS BUS IMPLEMENTATION PLAN Final Plan | February 2020
Route 4 - Pinole, Tara Hills Dr P&R, Richmond Parkway Transit Center to Salesforce Transit Center
Phase: Near
Proposed Operator: WestCAT
Destination Transit Connections
SF Muni: Salesforce Transit Center J, K, L, M, N, T BART: Embarcadero Station, Montgomery Station
Key Destinations Served
Market Street SoMa Financial District
Markets Served
Pinole Richmond I-80 Commuters
Market Size
~1500 Commuters
Origin Transit Connections
WestCAT:
JL/JR, 16, 17, 18, 19, C3
AC Transit:
70, 71
Origin Alignment
Destination Alignment
Note: Market size defined as population whose current commute would be served by route. See Appendix A for full methodology. All costs are in 2020 dollars.
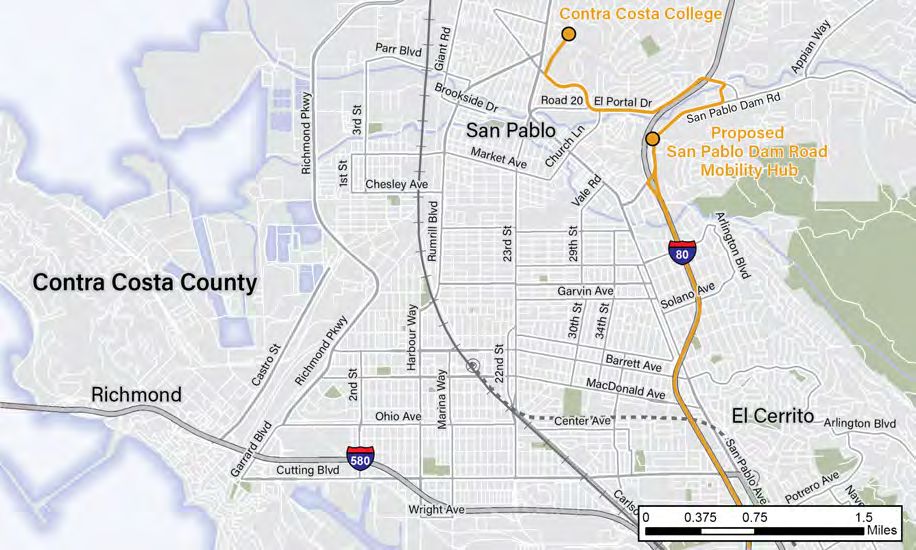
Original PDF, page 26
| Bus Fleet Size: 9 | |
|---|---|
| Required Capital Improvements | |
| Project # | Project Name |
| MH3 | San Pablo Dam Road Mobility Hub |
| BA2 | Buses for Medium-/Long-Term Routes |
| Optimal Capital Improvements | |
|---|---|
| Project # | Project Name |
| FA3 | San Pablo Dam Road/I-80 Access Improvement |
| TSP3 | TSP on El Portal Dr, San Pablo Dam Road (San Pablo, Contra Costa County) |
| Capital Improvements Costs | Annual O&M Cost: $1,422,000 | |
|---|---|---|
| Required | $ 18,900,000 | |
| Full (Required + Optimal) | $ 23,580,000 |
| Estimated Travel Times (Minutes) | ||||
|---|---|---|---|---|
| Origin | Destination | Proposed Express Bus | Existing Transit | Existing Auto |
| San Pablo Dam Road Mobility Hub | SF Salesforce Transit Center | 51 | 70 | 69 |
® ®
WEST CONTRA COSTA COUNTY
EXPRESS BUS IMPLEMENTATION PLAN Final Plan | February 2020
Route 5 - Contra Costa College, San Pablo Dam Road Mobility Hub to Salesforce Transit Center
Phase: Medium/Long
Proposed Operator: AC Transit
Destination Transit Connections
SF Muni: Salesforce Transit Center J, K, L, M, N, T BART: Embarcadero Station, Montgomery Station
Key Destinations Served
Market Street SoMa Financial District
Markets Served
San Pablo El Sobrante
Market Size
~400 Commuters
Origin Transit Connections
AC Transit:
Origin Alignment
Destination Alignment
Note: Market size defined as population whose current commute would be served by route. See Appendix A for full methodology. All costs are in 2020 dollars.
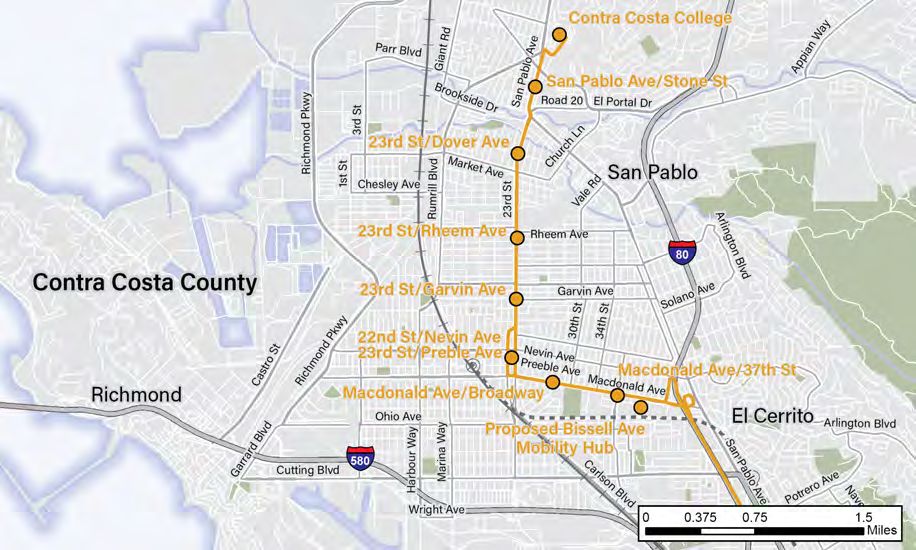
Original PDF, page 27
| Bus Fleet Size: 9 | |
|---|---|
| Required Capital Improvements | |
| Project # | Project Name |
| BS2 | Bus Stop Upgrades on 23rd Street, Macdonald Avenue (San Pablo, Richmond) |
| BS5 | Bus Stop Upgrades on Hollis Street/40th Street/Broadway (Emeryville, Oakland) |
| BS6 | Bus Stop Upgrades on Broadway (Oakland) |
| MH4 | Bissell Avenue Mobility Hub (Richmond east) |
| BA1 | Buses for Near-Term Routes |
| Optimal Capital Improvements | |
|---|---|
| Project # | Project Name |
| TSP1 | TSP on 23rd Street, Macdonald Avenue (San Pablo, Richmond) |
| TSP5 | TSP on Hollis Street, 40th Street (Emeryville, Oakland) |
| Capital Improvements Costs | Annual O&M Cost: $1,412,000 | |
|---|---|---|
| Required | $ 13,870,000 | |
| Full (Required + Optimal) | $ 14,550,000 |
| Estimated Travel Times (Minutes) | ||||
|---|---|---|---|---|
| Origin | Destination | Proposed Express Bus | Existing Transit | Existing Auto |
| 23rd Street & Rheem Avenue | Hollis St & 59th St, Emeryville | 36 | 56 | 32 |
| Macdonald Avenue & 39th Street | Hollis St & 59th St, Emeryville | 23 | 50 | 26 |
| 23rd Street & Rheem Avenue | Broadway & Grand Ave, Oakland via Emeryville | 58 | 49 | 38 |
| Macdonald Avenue & 39th Street | Broadway & Grand Ave, Oakland via Emeryville | 45 | 45 | 33 |
® ®
WEST CONTRA COSTA COUNTY
EXPRESS BUS IMPLEMENTATION PLAN Final Plan | February 2020
Route 6 - San Pablo, Richmond via 23rd St, Bissell Ave Mobility Hub to Emeryville & Oakland
Phase: Near
Proposed Operator: AC Transit
Destination Transit Connections
AC Transit: 1R, 72R Capitol Corridor: Emeryville Station BART: MacArthur Station Emery Go-Round: Hollis, Hollis South, Shellmound-Powell, Watergate Express AC Transit: 20th Street Transit Center, East Bay BRT Capitol Corridor: Jack London Square BART: 19th St/Oakland Station, 12th St/Oakland City Center Station
Key Destinations Served
Hollis Street Employment Corridor Kaiser Permanente Oakland Alta Bates Summit Medical Center Uptown Oakland Downtown Oakland Jack London Square
Markets Served
San Pablo Richmond
Market Size
~2500 Commuters
Origin Transit Connections
WestCAT:
AC Transit:
70, 71, 72/72R/72M, 74, 76
Origin Alignment
Destination Alignment
Note: Market size defined as population whose current commute would be served by route. See Appendix A for full methodology. All costs are in 2020 dollars.
Original PDF, page 28
| Bus Fleet Size: 8 | |
|---|---|
| Required Capital Improvements | |
| Project # | Project Name |
| BS2 | Bus Stop Upgrades on 23rd Street, Macdonald Avenue (San Pablo, Richmond) |
| BS4 | Bus Stop Upgrades on 6th Street, University Blvd, Shattuck Avenue (Berkeley) |
| MH4 | Bissell Avenue Mobility Hub (Richmond east) |
| BA1 | Buses for Near-Term Routes |
| Optimal Capital Improvements | |||
|---|---|---|---|
| Project # | Project Name | ||
| TSP1 | TSP on 23rd Street, Macdonald Avenue (San Pablo, Richmond) | ||
| TSP4 | TSP on 6th Street, Shattuck Avenue (Berkeley) | ||
| Capital Improvements Costs | Annual O&M Cost: $1,248,000 | ||
| Required | $ 12,547,000 | ||
| Full (Required + Optimal) | $ 13,127,000 |
| Estimated Travel Times (Minutes) | ||||
|---|---|---|---|---|
| Origin | Destination | Proposed Express Bus | Existing Transit | Existing Auto |
| 23rd Street & Rheem Avenue | 6th St & Virginia St, Berkeley | 27 | 53 | 25 |
| 23rd Street & Rheem Avenue | University Ave & Shattuck Ave, Berkeley | 39 | 36 | 33 |
| Macdonald Avenue & 39th Street | 6th St & Virginia St, Berkeley | 14 | 42 | 20 |
| Macdonald Avenue & 39th Street | University Ave & Shattuck Ave, Berkeley | 26 | 30 | 28 |
® ®
WEST CONTRA COSTA COUNTY
EXPRESS BUS IMPLEMENTATION PLAN Final Plan | February 2020
Route 7 - San Pablo, Richmond via 23rd St, Bissell Ave Mobility Hub to Berkeley
Phase: Near
Proposed Operator: AC Transit
Destination Transit Connections
AC Transit: Downtown Berkeley Transit Center Capitol Corridor: Berkeley Station BART: Downtown Berkeley Station
Key Destinations Served
West Berkeley Downtown Berkeley Alta Bates Summit Medical Center
Markets Served
San Pablo Richmond
Market Size
~1700 Commuters
Origin Transit Connections
WestCAT:
AC Transit:
70, 71, 72/72R/72M, 74, 76
Origin Alignment
Destination Alignment
Note: Market size defined as population whose current commute would be served by route. See Appendix A for full methodology. All costs are in 2020 dollars.
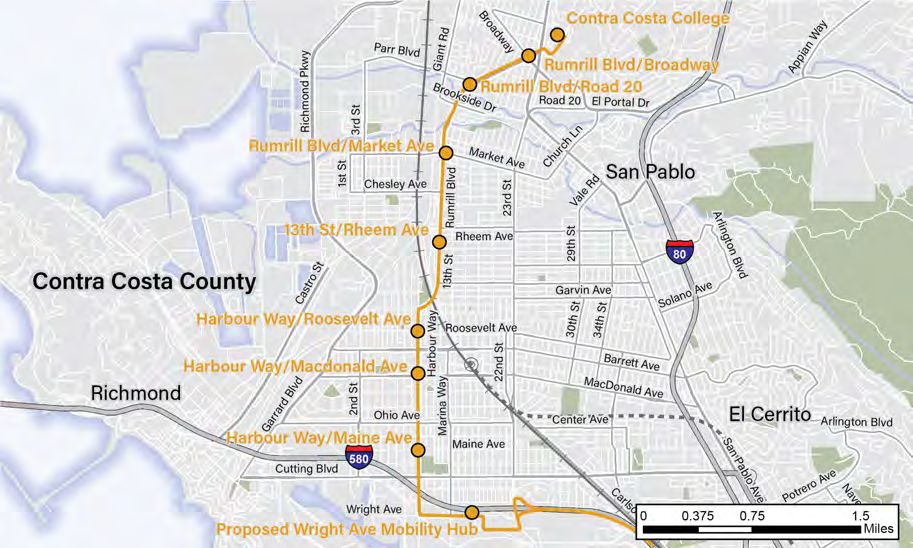
Original PDF, page 29
| Markets Served San Pablo Richmond I-580 Commuters | Market Size ~1200 Commuters |
|---|---|
| Origin Transit Connections WestCAT: C3 AC Transit: 70, 71, 72/72R/72M, 74, 76 Capitol Corridor/BART: Richmond Station |
| Bus Fleet Size: 9 | |
|---|---|
| Required Capital Improvements | |
| Project # | Project Name |
| BS3 | Bus Stop Upgrades on Rumrill Boulevard/13th Street/Harbour Way (San Pablo, Richmond) |
| BS6 | Bus Stop Upgrades on Broadway (Oakland) |
| MH5 | Wright Avenue Mobility Hub (Richmond west) |
| BA2 | Buses for Medium-/Long-Term Route |
| Optimal Capital Improvements | |
|---|---|
| Project # | Project Name |
| TSP2 | TSP on Rumrill Boulevard/13th Street/Harbour Way (San Pablo, Richmond) |
| TSP6 | TSP on Grand Avenue (Oakland) |
| Capital Improvements Costs | Annual O&M Cost: $1,413,000 | |
|---|---|---|
| Required | $ 22,826,000 | |
| Full (Required + Optimal) | $ 23,426,000 |
| Estimated Travel Times (Minutes) | ||||
|---|---|---|---|---|
| Origin | Destination | Proposed Express Bus | Existing Transit | Existing Auto |
| Rumrill Blvd & Market St | Broadway & Grand Ave, Oakland | 48 | 55 | 39 |
| Harbour Way & Macdonald Ave | Broadway & Grand Ave, Oakland | 38 | 40 | 36 |
| Wright Ave P&R | Broadway & Grand Ave, Oakland | 32 | 56 | 34 |
® ®
WEST CONTRA COSTA COUNTY
EXPRESS BUS IMPLEMENTATION PLAN Final Plan | February 2020
Route 8 - San Pablo, Richmond via Rumrill Blvd, Harbour Way, Wright Ave Mobility Hub to Oakland
Phase: Medium/Long
Proposed Operator: AC Transit
Destination Transit Connections
AC Transit: 20th Street Transit Center, East Bay BRT Capitol Corridor: Jack London Square BART: 19th St/Oakland Station, 12th St/Oakland City Center Station
Key Destinations Served
Uptown Oakland Downtown Oakland Jack London Square
Origin Alignment
Destination Alignment
Note: Market size defined as population whose current commute would be served by route. See Appendix A for full methodology. All costs are in 2020 dollars.
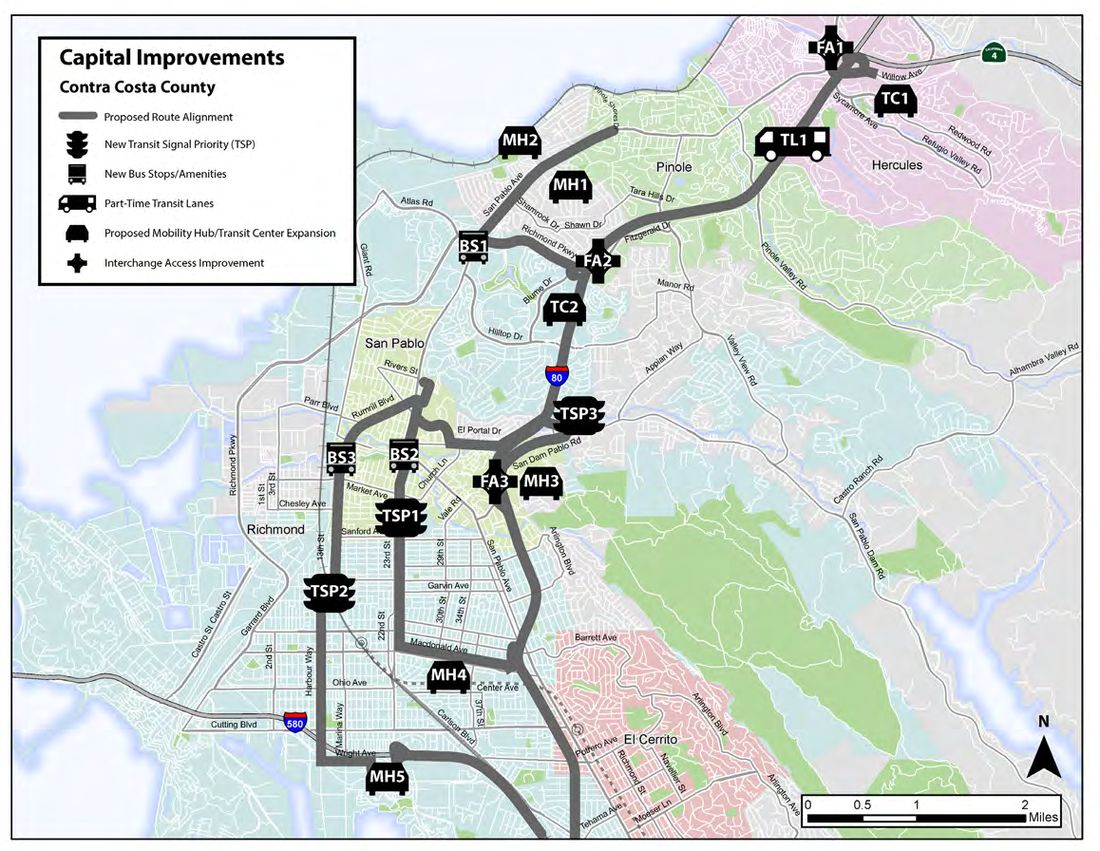
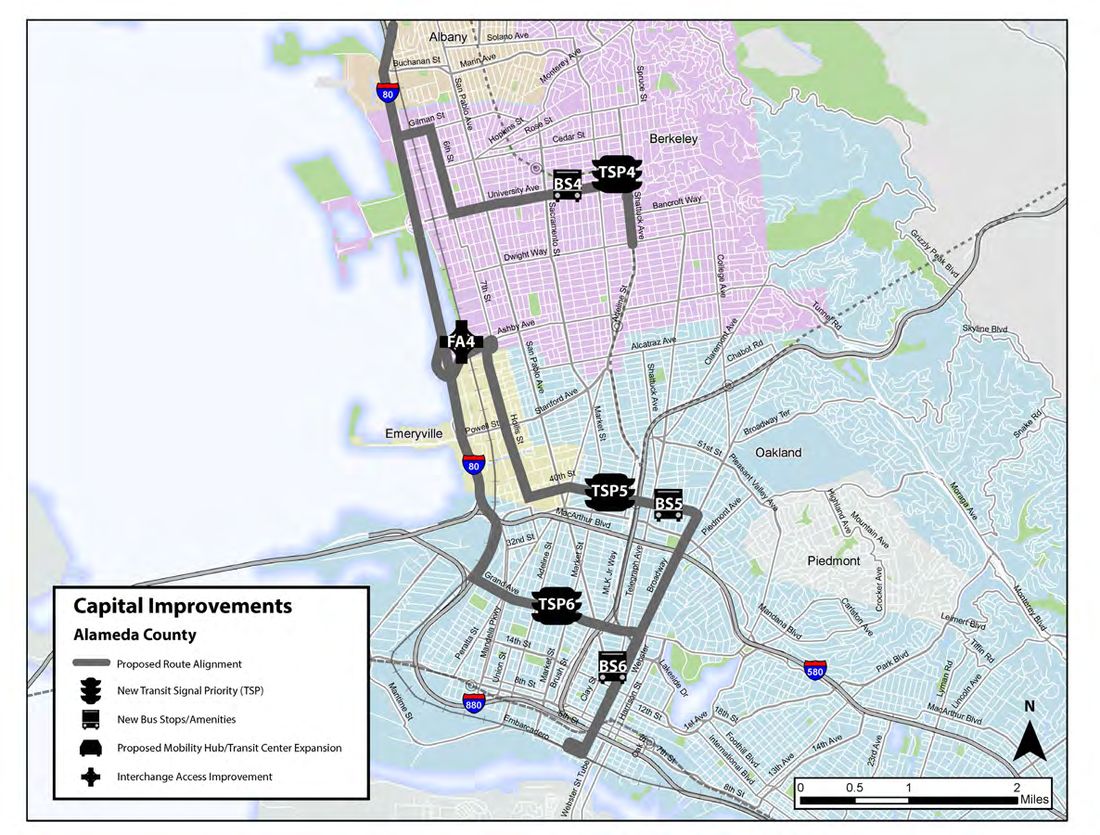
Original PDF, page 30
® ®
WEST CONTRA COSTA COUNTY
EXPRESS BUS IMPLEMENTATION PLAN Final Plan | February 2020
6. CAPITAL IMPROVEMENTS
The public outreach findings for this project and input from operators relating to their experience with current transit service motivated the need to identify a series of capital improvement to enhance the effectiveness, accessibility, and desirability of the service. Key findings include:
- The transit experience should be comfortable on both the origin and destination end of the trip.
- Bus travel times must be competitive with auto travel for many potential riders to consider making a switch between modes.
- Given the land use characteristics of the West County area, many potential riders would need express bus routes that serve multimodal mobility hubs rather than walk-up service.
To address these stated preferences, a series of capital improvements were developed to (1) provide a high-quality rider experience, (2) ensure that transit vehicles are given priority over lower-efficiency modes, and (3) enhance access to the service through mobility hubs and bus stop improvements.
Capital improvement projects are grouped below by type. Figure 6-1 shows all proposed improvements in Contra Costa County and Figure 6-2 shows all improvements in Alameda County.
Capital improvement projects are summarized in the form of Capital Improvement Profiles. These profiles describe the proposed improvement, the route(s) it would benefit, the estimated cost to implement, and an assessment of the benefit it would provide. The profiles also contain a listing of the implementation steps anticipated for the projects to proceed to construction. The implementation steps are based on the information currently known about project status and may evolve based on available funding sources and inputs from project partners. The capital projects identified have been developed at a conceptual design stage. Further design development may refine project definitions based on more detailed design development and additional information such as topographic survey, traffic analysis, and additional stakeholder coordination.
Conceptual layouts for these improvements and detailed cost estimates may be found in Appendix E. Figure 6-1 - Contra Costa County Capital Improvements Figure 6-2 - Alameda County Capital Improvement Projects February 19, 2020 February 19, 2020
Original PDF, page 31
| Berkeley | Unincorp. Contra Costa County | Emeryville | Oakland | Pinole | Richmond | San Pablo | Total | |
|---|---|---|---|---|---|---|---|---|
| Route #s | 1, 7 | 3, 4 | 2, 2A, 6 | 2, 2B, 3, 8 | 3, 4 | 6, 7, 8 | 6, 7, 8 | - |
| Project # | BS4* | BS1 | BS5 | BS5, BS6 | BS1 | BS1, BS2, BS3 | BS2, BS3 | - |
| Total Stops | 16 | 4 | 12 | 14 | 4 | 20 | 10 | 80 |
| New or Relocated Stops | 1 | 1 | 2 | 0 | 0 | 5 | 4 | 13 |
| Tier 1 Amenities | ||||||||
| ADA Landing Zone | 1 | 1 | 0 | 0 | 0 | 1 | 2 | 5 |
| Shelter | 13 | 3 | 11 | 9 | 4 | 20 | 9 | 69 |
| Bench | 8 | 1 | 8 | 5 | 2 | 15 | 9 | 48 |
| Lighting | 14 | 4 | 9 | 7 | 4 | 19 | 10 | 67 |
| Trash Receptacle | 7 | 4 | 0 | 7 | 4 | 15 | 9 | 46 |
| Tier 2 Amenities | ||||||||
| System Map | 14 | 4 | 12 | 13 | 4 | 20 | 9 | 76 |
| Bicycle Parking | 11 | 4 | 10 | 11 | 4 | 20 | 10 | 70 |
® ®
WEST CONTRA COSTA COUNTY
EXPRESS BUS IMPLEMENTATION PLAN Final Plan | February 2020
6.1 Bus Stop Amenities
Every bus trip begins by accessing a bus stop or transit center. To ensure the waiting period before a bus arrives is comfortable, bus stops and transit centers should provide amenities such as shelters, seating, lighting, real-time arrival information, bike parking, and other features. Riders are more likely to consider riding transit over driving if they know that their transit experience will be convenient, safe, quick, and comfortable.
The service will primarily use existing bus stops. In some cases, bus stops are proposed to be relocated to a more accessible location or one that is preferred to bus operations (far-side at intersections). Existing local stops in both West Contra Costa and Alameda Counties vary substantially in the quality and quantity of amenities provided. Many stops consist of only a bus stop pole with a sign and nothing else, the bare minimum for a transit stop. Bus stops in the AC Transit service area should comply with AC Transit Multimodal Corridor Guidelines (2018) and Designing with Transit (2004). All stops identified for proposed express service will be made fully ADA-accessible. For a full list of bus stop amenity improvements, see Appendix D.
Recommended amenities are divided into two tiers. Tier 1 amenities are highly recommended for all express service stops. Tier 2 amenities are beneficial to stop access or the rider experience, but are expected to be limited to high-ridership stops and are not necessary at every stop.
Tier 1 Amenities
ADA-Compliant Landing Zone To maintain compliance with the Americans with Disabilities Act (ADA), and ensure accessibility to all users, bus stops should have a concrete landing zone adjacent to the curb. This landing zone, which should be a minimum of 5’ wide and 8’ deep and free of street furniture is necessary for a bus to deploy a ramp allowing wheelchair users to board.
Shelter A shelter is a two- or three-walled structure installed at the bus stop that allows waiting passengers to stand outside of direct sunlight or inclement weather. Shelters may come in different sizes and shapes, but typically require a larger footprint in the right-of-way than other stop amenities. Detailed stop design is needed to verify the feasibility of shelter placement at identified stop locations. If a shelter is not feasible within a constrained sidewalk space, then the stop could be relocated in a nearby location or a shelter may not be provided.
Bench Bus stop benches are particularly important in places with higher expected wait times, routes that serve older populations, and locations with a higher volume of boardings. If the bus stop also has a shelter, the bench should generally be placed within the shelter. Busy stops or transfer points may require multiple benches to serve all passengers who want a place to sit.
Pedestrian-Scale Lighting Standard street lamps are intended to illuminate the roadway for motorists and are not always ideal for providing adequate lighting for passengers waiting for the bus. Pedestrian-scale lighting is installed lower to the ground and with the intent of providing a well-lit place to stand or sit while waiting for the bus, increasing riders’ sense of security. This lighting can sometimes be provided from the bus stop shelters themselves. Consideration should be given to providing solar-powered lighting, removing the need to connect bus stops with utility lines.
Trash Receptacle To help ensure that bus stops stay clean with as little maintenance as possible, trash receptacles should be installed close to, or at, the bus stop. Depending on the level of activity at the bus stops, trash receptacles must be emptied frequently to avoid overflow.
Tier 2 Amenities
System Map A large, legible system map is a useful bus stop amenity. Passengers can plan trips without needing to access the website of the service provider via smartphone. The system map can also provide contact information so that passengers may contact a transit agency representative for further information.
Bicycle Parking Bicycles can allow transit riders to reach stops from farther away than if they were walking, potentially increasing the number of riders.
Secure bicycle parking, such as lockers and emerging technologies such as BIKEEP, allows riders to park their bicycle with greater confidence that it will not be stolen.
Table 6-1 shows the number of recommended bus stop amenities by jurisdiction. The Project # row corresponds to the capital improvement project profiles found below. Each project (numbered BS1-BS6) corresponds to a set of bus stops that would be upgraded to accommodate a route.
Table 6-1 - Bus Stop Amenity Upgrade Quantities by Jurisdiction February 19, 2020
- Project numbers refer to project profiles below
Original PDF, page 32
® ®
WEST CONTRA COSTA COUNTY
EXPRESS BUS IMPLEMENTATION PLAN Final Plan | February 2020
BS1: Bus Stop Improvements - Pinole, Richmond, Unincorp. Contra Costa County
BS2: Bus Stop Improvements - San Pablo, Richmond
Improvement Type: Bus Stops
Timeline to Implement:
3-12 months
Location:
San Pablo Avenue, Richmond Parkway (Pinole, Richmond, Unincorporated Contra Costa County)
Implementation Steps:
- Coordinate with City of Pinole, City of Richmond, and Contra Costa County
- PE and environmental
- Operator final design of stop layout and amenities
- Construct stop amenities
- Ongoing monitoring of stop ridership levels to determine if additional amenities are necessary
Term: Near
Quantity: 10 Stops
Cost: $440,000
Need: Required
Routes Benefitting:
Express Bus: 3, 4 • WestCAT: JPX, JR/JL, C3,
Benefit:
Improve comfort and safety of riders (amenities) Enhance system legibility (wayfinding, branding) Enhance efficiency (stop locations)
Description of Proposed Improvement:
- Install/improve bus stop amenities:
- ADA Landing Zone
- Shelter
- Bench
- Pedestrian-scale Lighting
- Trash Receptacle
- System Map
- Bicycle Parking
Improvement Type: Bus Stops
Timeline to Implement:
3-12 months
Location:
23rd Street, Macdonald Avenue (San Pablo, Richmond)
Implementation Steps:
- Coordinate with City of San Pablo and City of Richmond
- PE and environmental
- Operator final design of stop layout and amenities
- Construct stop amenities
- Ongoing monitoring of stop ridership levels to determine if additional amenities are necessary
Term: Near
Quantity: 14 Stops
Cost: $626,000
Need: Required
Routes Benefitting:
Express Bus: 6, 7 • AC Transit: 74, 72M
Benefit:
Improve comfort and safety of riders (amenities) Enhance system legibility (wayfinding, branding) Enhance efficiency (stop locations)
Description of Proposed Improvement:
- Install/improve bus stop amenities:
- ADA Landing Zone
- Shelter
- Bench
- Pedestrian-scale Lighting
- Trash Receptacle
- System Map
- Bicycle Parking
Note: All costs are in 2020 dollars.
Original PDF, page 33
® ®
WEST CONTRA COSTA COUNTY
EXPRESS BUS IMPLEMENTATION PLAN Final Plan | February 2020
BS3: Bus Stop Improvements - San Pablo, Richmond
BS4: Bus Stop Improvements - Berkeley
Improvement Type: Bus Stops
Term: Medium/Long
Quantity: 14 Stops
Need: Required
Improvement Type: Bus Stops
Term: Near
Quantity: 16 Stops
Need: Required
Timeline to Implement:
3-12 months
Location:
Rumrill Boulevard, 13th Street, Harbour Way (San Pablo, Richmond)
Implementation Steps:
- Coordinate with City of San Pablo, City of Richmond
- PE and environmental
- Operator final design of stop layout and amenities
- Construct stop amenities
- Ongoing monitoring of stop ridership levels to determine if additional amenities are necessary
Cost: $693,000
Routes Benefitting:
Express Bus: 8 • AC Transit: 71,
Benefit:
Improve comfort and safety of riders (amenities) Enhance system legibility (wayfinding, branding) Enhance efficiency (stop locations)
Description of Proposed Improvement:
- Install/improve bus stop amenities:
- ADA Landing Zone
- Shelter
- Bench
- Pedestrian-scale Lighting
- Trash Receptacle
- System Map
- Bicycle Parking
Timeline to Implement:
3-12 months
Location:
6th Street, University Boulevard, Shattuck Avenue (Berkeley)
Implementation Steps:
- Coordinate with City of Berkeley
- PE and environmental
- Operator final design of stop layout and amenities
- Construct stop amenities
- Ongoing monitoring of stop ridership levels to determine if additional amenities are necessary
Cost: $621,000
Routes Benefitting:
Express Bus: 1, 7 • AC Transit: 18, 51B, 52, F, FS, Z
Benefit:
Improve comfort and safety of riders (amenities) Enhance system legibility (wayfinding, branding) Enhance efficiency (stop locations)
Description of Proposed Improvement:
- Install/improve bus stop amenities:
- ADA Landing Zone
- Shelter
- Bench
- Pedestrian-scale Lighting
- Trash Receptacle
- System Map
- Bicycle Parking
Note: All costs are in 2020 dollars.
Original PDF, page 34
® ®
WEST CONTRA COSTA COUNTY
EXPRESS BUS IMPLEMENTATION PLAN Final Plan | February 2020
BS5: Bus Stop Improvements - Emeryville, Oakland
BS6: Bus Stop Improvements - Oakland
Improvement Type: Bus Stops
Term: Near
Quantity: 16 Stops
Need: Required
Improvement Type: Bus Stops
Term: Near
Quantity: 10 Stops
Need: Required
Timeline to Implement:
3-12 months
Location:
Broadway (Oakland)
Implementation Steps:
- Coordinate with City of Oakland\PE and environmental
- Operator final design of stop layout and amenities
- Construct stop amenities
- Ongoing monitoring of stop ridership levels to determine if additional amenities are necessary
Cost: $333,000
Routes Benefitting:
Express Bus: 2, 2B, 3, 6, 8 • AC Transit: 1, 11, 12, 18, 51A, 58L, 72, 72M, 72R
Benefit:
Improve comfort and safety of riders (amenities) Enhance system legibility (wayfinding, branding) Enhance efficiency (stop locations)
Description of Proposed Improvement:
- Install/improve bus stop amenities:
- ADA Landing Zone
- Shelter
- Bench
- Pedestrian-scale Lighting
- Trash Receptacle
- System Map
- Bicycle Parking
Timeline to Implement:
3-12 months
Location:
Hollis Street, 40th Street, Broadway (Emeryville, Oakland)
Implementation Steps:
- Coordinate with City of Emeryville, City of Oakland
- PE and environmental
- Operator final design of stop layout and amenities
- Construct stop amenities
- Ongoing monitoring of stop ridership levels to determine if additional amenities are necessary
Cost: $611,000
Routes Benefitting:
Express Bus: 2, 2A, 6 • AC Transit: 31, 57, C, F, J
Benefit:
Improve comfort and safety of riders (amenities) Enhance system legibility (wayfinding, branding) Enhance efficiency (stop locations)
Description of Proposed Improvement:
- Install/improve bus stop amenities:
- ADA Landing Zone
- Shelter
- Bench
- Pedestrian-scale Lighting
- Trash Receptacle
- System Map
- Bicycle Parking
Note: All costs are in 2020 dollars.
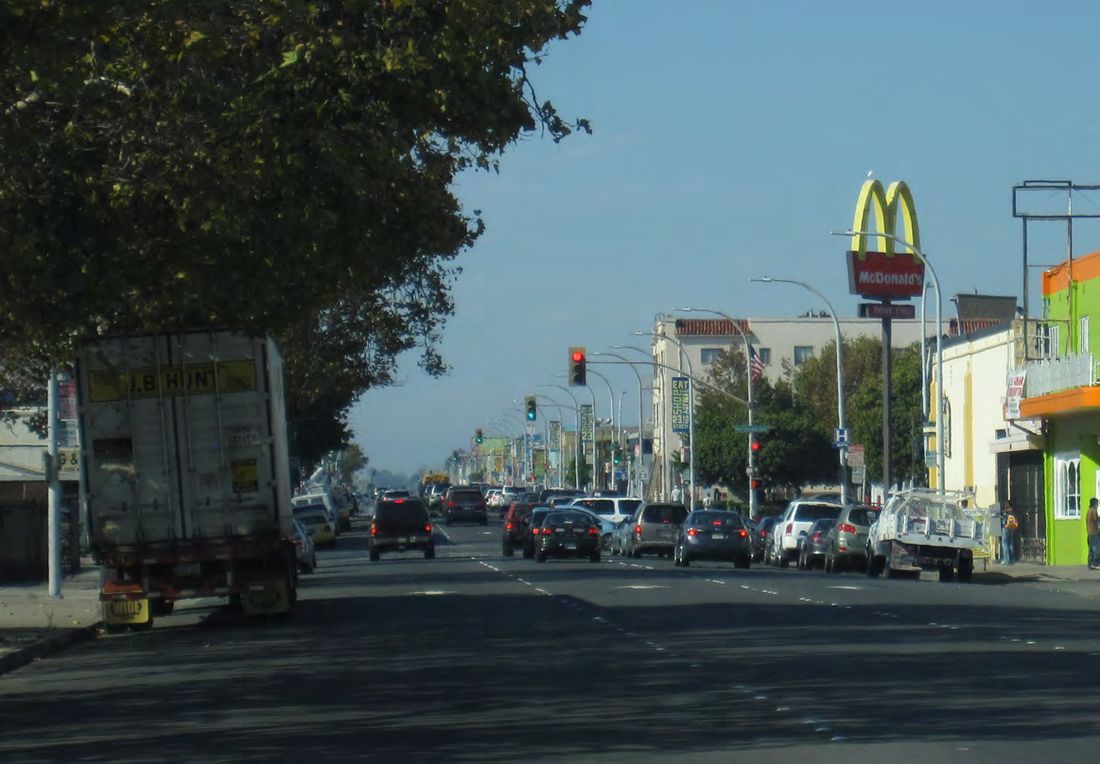
Original PDF, page 35
| Project # | Route #s | Street | Extents | Jurisdiction | Intersections |
|---|---|---|---|---|---|
| TSP1 | 6, 7 | San Pablo Ave/23rd St | Broadway to Market Ave | City of San Pablo | 2 |
| TSP1 | 6, 7 | 22nd/23rd St | Rheem to Macdonald Ave | City of Richmond | 11 |
| TSP1 | 6, 7 | Macdonald Ave | 22nd St to 44th St | City of Richmond | 5 |
| TSP2 | 8 | Rumrill Blvd | San Pablo Ave to Sanford Ave | City of San Pablo | 7 |
| TSP2 | 8 | 13th St/Harbour Way | Rheem Blvd to Hoffman Blvd | City of Richmond | 13 |
| TSP3 | 5 | El Portal Dr | Road 20 to San Pablo Dam Rd | City of San Pablo | 2 |
| TSP3 | 5 | San Pablo Dam Rd | El Portal Dr to I-80 | Unincorp. Contra Costa County | 2 |
| TSP4 | 1, 7 | 6th St | Gilman St to University Ave | City of Berkeley | 3 |
| TSP4 | 1, 7 | Shattuck Ave | University Ave to Dwight Way | City of Berkeley | 8 |
| TSP5 | 2, 2A, 6 | Hollis St | 65th St to 40th St | City of Emeryville | 7 |
| TSP5 | 2, 2A, 6 | 40th St | Hollis St to Adeline St | City of Emeryville | 3 |
| TSP5 | 2, 2A, 6 | 40th St | Market to Broadway | City of Oakland | 6 |
| TSP6* | 2, 2B, 3, 8 | Grand Ave | Frontage Rd to Broadway | City of Oakland | 10 |
® ®
WEST CONTRA COSTA COUNTY
EXPRESS BUS IMPLEMENTATION PLAN Final Plan | February 2020
6.2 Transit Signal Priority
Transit Signal Priority (TSP) describes technologies used to reduce transit vehicle delays at signalized intersections, by either holding lights green for an extended period or shortening the length of red light periods. To improve travel time along arterial-running segments of the proposed express routes, TSP is recommended at all traffic signals where it is it not already in operation. TSP is a highly-desired amenity for express bus service, but is not a pre-requisite for service operation. The proposed routes travel along streets within seven different cities, and a portion of unincorporated Contra Costa County. TSP requires technology both at the signal controller operated by the municipality or Caltrans and on-board the vehicle. Both AC Transit and WestCAT vehicles currently have the capability for TSP. Inter-agency coordination is necessary to implement and maintain TSP.
AC Transit is currently implementing a project to upgrade TSP on San Pablo Avenue between Rumrill Boulevard in Richmond and 20th Street in Oakland. Additionally, TSP is already in operation on University Avenue in Berkeley between 6th Street and Shattuck Avenue and on Broadway in Oakland between 40th Street and 20th Street. TSP is planned on Broadway in Oakland between 20th Street and 11th Street as part of the AC Transit East Bay BRT project.
Table 6-2 shows the street segments where TSP is recommended. For a detailed list of intersections where TSP is recommended, refer to Appendix D.
Table 6-2 - TSP Signal Upgrades by Street Segment Traffic signals on 23rd Street in Richmond February 19, 2020
- TSP is currently planned on Grand Avenue as part of the AC Transit Rapid Corridors project
Original PDF, page 36
® ®
WEST CONTRA COSTA COUNTY
EXPRESS BUS IMPLEMENTATION PLAN Final Plan | February 2020
TSP1: Transit Signal Priority - San Pablo, Richmond
TSP2: Transit Signal Priority - San Pablo, Richmond
Improvement Type: Transit Signal Priority
Term: Near
Quantity: 18 Intersections
Need: Optimal
Improvement Type: Transit Signal Priority
Term: Medium/Long
Quantity: 20 Intersections
Need: Optimal
Timeline to Implement:
6-12 months
Location:
23rd Street, Macdonald Avenue (San Pablo, Richmond)
Implementation Steps:
- Coordinate with transit operators to determine technology requirements
- Coordinate with City of San Pablo, City of Richmond to design (may require traffic study)
- Implement upgrades
Cost: $360,000
Routes Benefitting:
Express Bus: 6, 7 • AC Transit: 72M,
Benefit:
Provides transit priority treatments that will reduce signal delay and travel time variability for express buses. Travel time savings estimated at approximately 8,700 Annual Rider Hours
Description of Proposed Improvement:
- Provide transit signal priority (TSP) at all signalized intersections
Timeline to Implement:
6-12 months
Location:
Rumrill Boulevard, 13th Street, Harbour Way (San Pablo, Richmond)
Implementation Steps:
- Coordinate with transit operators to determine technology requirements
- Coordinate with City of San Pablo, City of Richmond to design (may require traffic study)
- Implement upgrades
Cost: $400,000
Routes Benefitting:
Express Bus: 8 • AC Transit: 71,
Benefit:
Provides transit priority treatments that will reduce signal delay and travel time variability for express buses. Travel time savings estimated at approximately 3,500 Annual Rider Hours
Description of Proposed Improvement:
- Provide transit signal priority (TSP) at all signalized intersections
Original PDF, page 37
® ®
WEST CONTRA COSTA COUNTY
EXPRESS BUS IMPLEMENTATION PLAN Final Plan | February 2020
TSP3: Transit Signal Priority - San Pablo, Unincorp. Contra Costa County
TSP4: Transit Signal Priority - Berkeley
Improvement Type: Transit Signal Priority
Term: Medium/Long
Quantity: 4 Intersections
Need: Optimal
Improvement Type: Transit Signal Priority
Term: Near
Quantity: 11 Intersections
Need: Optimal
Timeline to Implement:
6-12 months
Location:
El Portal Drive, San Pablo Dam Road (San Pablo, Unincorporated Contra Costa County)
Implementation Steps:
- Coordinate with transit operators to determine technology requirements
- Coordinate with City of San Pablo, Contra Costa County to design (may require traffic study)
- Implement upgrades
Cost: $80,000
Routes Benefitting:
Express Bus: 5 • AC Transit: 70, 74, L
Benefit:
Provides transit priority treatments that will reduce signal delay and travel time variability for express buses. Travel time savings estimated at approximately 1,100 Annual Rider Hours
Description of Proposed Improvement:
- Provide transit signal priority (TSP) at all signalized intersections
Timeline to Implement:
6-12 months
Location:
6th Street, Shattuck Avenue (Berkeley)
Implementation Steps:
- Coordinate with transit operators to determine technology requirements
- Coordinate with City of Berkeley to design (may require traffic study)
- Implement upgrades
Cost: $220,000
Routes Benefitting:
Express Bus: 1, 7 • AC Transit: 1, 18, 49, F
Benefit:
Provides transit priority treatments that will reduce signal delay and travel time variability for express buses. Travel time savings estimated at approximately 5,500 Annual Rider Hours
Description of Proposed Improvement:
- Provide transit signal priority (TSP) at all signalized intersections
Original PDF, page 38
® ®
WEST CONTRA COSTA COUNTY
EXPRESS BUS IMPLEMENTATION PLAN Final Plan | February 2020
TSP5: Transit Signal Priority - Emeryville, Oakland
TSP6: Transit Signal Priority - Oakland
Improvement Type: Transit Signal Priority
Term: Near
Quantity: 16 Intersections
Need: Optimal
Improvement Type: Transit Signal Priority
Term: Near
Quantity: 10 Intersections
Need: Optimal
Timeline to Implement:
6-12 months
Location:
Hollis Street, 40th Street, Broadway (Emeryville, Oakland)
Implementation Steps:
- Coordinate with transit operators to determine technology requirements
- Coordinate with City of Emeryville, City of Oakland to design (may require traffic study)
- Implement upgrades
Cost: $320,000
Routes Benefitting:
Express Bus: 2, 2A, 6 • AC Transit: 31, 57, C, F, J
Benefit:
Provides transit priority treatments that will reduce signal delay and travel time variability for express buses. Travel time savings estimated at approximately 8,900 Annual Rider Hours
Description of Proposed Improvement:
- Provide transit signal priority (TSP) at all signalized intersections
Timeline to Implement:
6-12 months
Location:
Grand Avenue (Oakland)
Implementation Steps:
- Coordinate with transit operators to determine technology requirements
- Coordinate with City of Oakland to design (may require traffic study)
- Implement upgrades
Cost: $200,000
Routes Benefitting:
Express Bus: 2B, 3, 8 • AC Transit: NL
Benefit:
Provides transit priority treatments that will reduce signal delay and travel time variability for express buses. Travel time savings estimated at approximately 13,600 Annual Rider Hours
Description of Proposed Improvement:
- Provide transit signal priority (TSP) at all signalized intersections
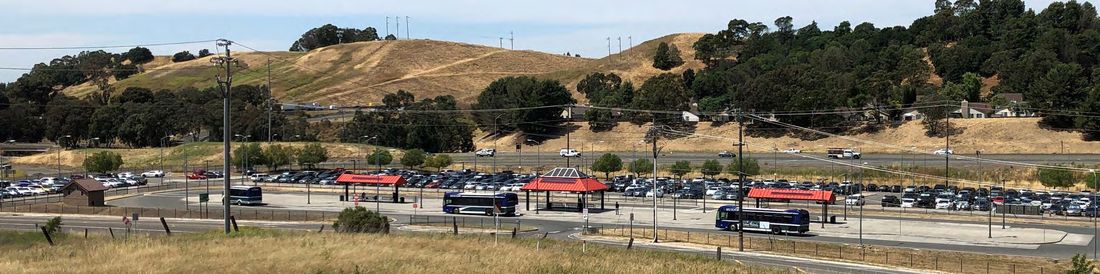
Original PDF, page 39
® ®
WEST CONTRA COSTA COUNTY
EXPRESS BUS IMPLEMENTATION PLAN Final Plan | February 2020
6.3 Freeway Access Improvements
Each of the proposed express bus routes uses I-80 for a portion of its alignment. Interchanges between I-80 and the surrounding streets are frequently congested with auto and truck traffic during peak commute periods. These areas are often significant contributors to bus delay and travel time variability. To reduce delay experienced by transit riders at these locations and enhance efficiency and reliability, several freeway access improvements are recommended for the interchanges where the express bus routes would access or egress I-80. These improvements would benefit transit travel times, making the riding bus more time-competitive with driving and reducing operating costs. However, they are not pre-requisites for service operations and may be implemented over time both before and after the start of service.
Improvements are recommended at the following interchanges:
- SR-4/John Muir Parkway/I-80 (FA1)
- Richmond Parkway/I-80 (FA2)
- San Pablo Dam Road/I-80 (FA3)
- Ashby Avenue/I-80 (FA4)
For conceptual designs of the above improvements as well as detailed cost estimates, refer to Appendix E. Hercules Transit Center, with most parking occupied
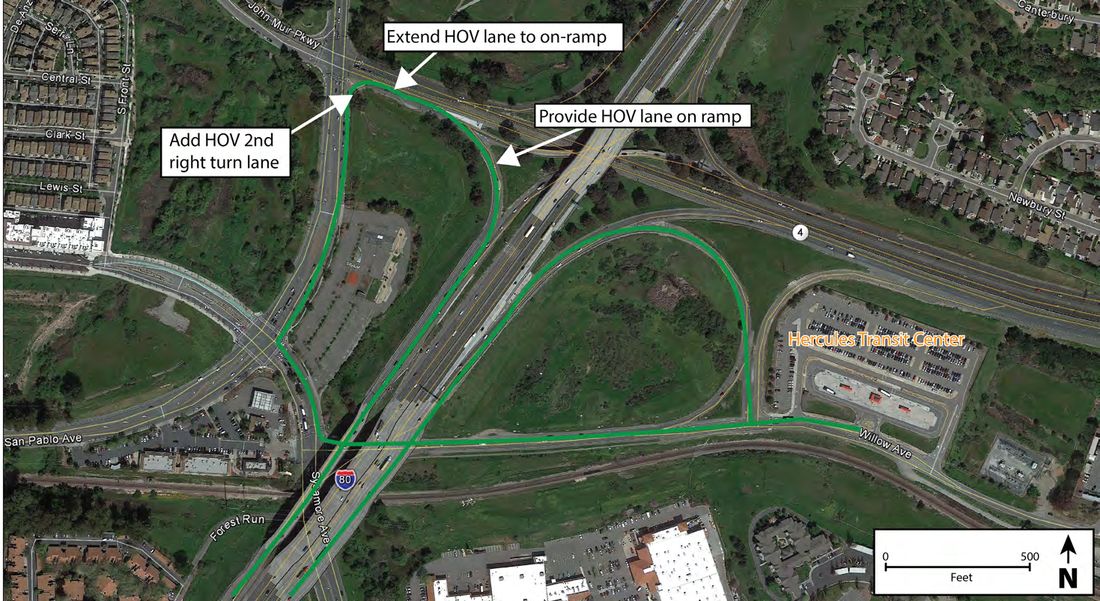
Original PDF, page 40
® ®
WEST CONTRA COSTA COUNTY
EXPRESS BUS IMPLEMENTATION PLAN Final Plan | February 2020
FA1: SR-4/John Muir Parkway Freeway Access Improvement
Improvement Type: Freeway Access
Timeline to Implement:
33-44 months
Location:
SR-4/John Muir Parkway/I-80 Interchange (Hercules)
Implementation Steps:
- Caltrans Capital Improvement Process:
- Concept of Operations • PSR-PR • CE/CE • PS&E
- Coordinate with Caltrans, City of Hercules
- Install recommended improvements
Term: Near
Quantity: N/A
Cost: $3,600,000
Need: Optimal
Routes Benefitting:
Express Bus: 1, 2, 2A, 2B • WestCAT: Lynx, JX
Benefit:
Allows buses from Hercules Transit Center to bypass queues, improving reliability and travel time during peak congestion periods. Travel time savings estimated at approximately 16,400 Annual Rider Hours. This figure considers only routes proposed in this plan. Total time savings across operators would be greater.
Description of Proposed Improvement:
- Provide HOV-only second right-turn lane on San Pablo Avenue to John Muir Parkway
- Extend HOV lane on John Muir Parkway to I-80 WB on-ramp
- Provide HOV lane on I-80 WB on-ramp
Figure 6-3 - SR-4/John Muir Parkway/I-80 Access Improvements (FA1) Hercules Transit Center, located east of I-80 and south of SR-4, is served by several WestCAT local routes and acts as the northern terminus of the JX and JPX express routes. The transit center is also served by WestCAT’s Lynx service to the Salesforce Transit Center in San Francisco. Proposed express bus service traveling south from Hercules Transit Center would merge onto I-80 WB via Willow Avenue, Sycamore Avenue, San Pablo Avenue, and John Muir Parkway. Existing express bus services (such as the WestCAT LYNX and JPX) running in the same alignment experience auto-based congestion on San Pablo Avenue and John Muir Parkway on their approach to the freeway. Improvements are recommended to improve transit vehicle access to I-80 from the transit center.
The right-turn lane from northbound San Pablo Avenue onto John Muir Parkway is recommended to be widened with an HOV lane added. The HOV lane would extend east on John Muir Parkway to the I-80 on-ramp. The roadway widening on John Muir Parkway would occur within Caltrans right-of-way. The I-80 WB on-ramp is currently sufficiently wide for addition of an HOV lane, which would join the existing HOV lane on I-80.
February 19, 2020
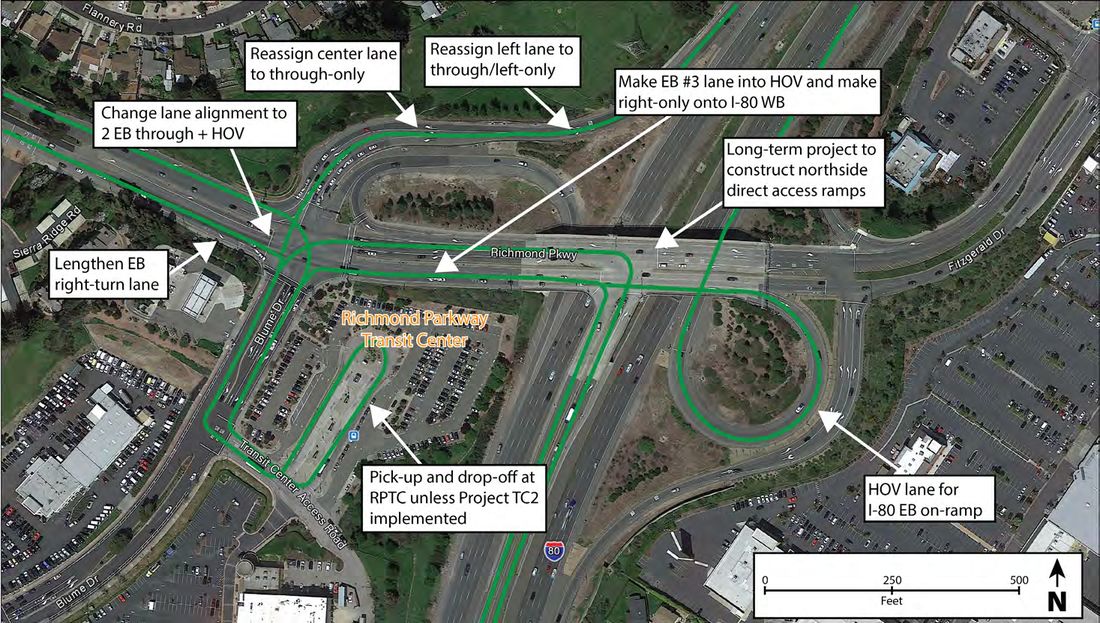
Original PDF, page 41
® ®
WEST CONTRA COSTA COUNTY
EXPRESS BUS IMPLEMENTATION PLAN Final Plan | February 2020
FA2: Richmond Parkway Freeway Access Improvement
Improvement Type: Freeway Access
Timeline to Implement:
27-36 months
Location:
Richmond Parkway/I-80 Interchange (Richmond)
Implementation Steps:
- Obtain Caltrans encroachment permit
- Coordinate with Caltrans, City of Richmond
- Analysis of ramp metering and traffic impacts
- Coordinate with utility agency for utility box relocation
- Restrip intersection
Term: Near
Quantity: N/A
Cost: $900,000
Need: Optimal
Routes Benefitting:
Express Bus: 1, 2, 2A, 2B, 3,
AC Transit: 71, LA, LC • WestCAT: JPX, JR
Benefit:
Allows buses from Richmond Parkway Transit Center to bypass queues, improving reliability and travel time during peak congestion periods. Travel time savings estimated at approximately 19,500 Annual Rider Hours.
This figure considers only routes proposed in this plan. Total time savings across operators would be greater.
Description of Proposed Improvement:
- Restripe I-80 WB off-ramp and Richmond Parkway E/B
- Extend WB right-turn lane from Richmond Pkwy to Blume Dr
- Add HOV right-turn lane to I-80 WB Direct Access Ramp
- Add HOV lane on I-80 EB on-ramp
Figure 6-4 - Richmond Parkway/I-80 Access Improvements (FA2) The I-80/Richmond Parkway Interchange is used by buses traveling between the freeway and Richmond Parkway Transit Center. The interchange allows access to both I-80 EB and I-80 WB, including direct access ramps (DARs) to/from the HOV lane south of Richmond Parkway.
Improvements are recommended to reduce the impact of congestion on bus travel times and reliability along Richmond Parkway and between I-80 and the Transit Center.
Improvements include restriping the lanes approaching Richmond Parkway from the I-80 WB off-ramp and the lanes approaching Blume Drive from eastbound Richmond Parkway. Additionally, an HOV lane is recommended on eastbound Richmond Parkway on the I-80 overpass, continuing onto the I-80 EB on-ramp. Consideration should be given to completing the direct access ramps (DARs) between Richmond Parkway and I-80 to the north in the long term (cost of this improvement not included here).
The identified improvements would leverage the investment in the DARs by improving HOV access and circulation, benefiting both existing and proposed routes. These improvements need to be coordinated with interim access improvements (Project TC2-I) which would relocate southbound rider pick-up to a bus pullout on Richmond Parkway with a ramp and sidewalk to provide link from the adjacent transit center lot.
February 19, 2020
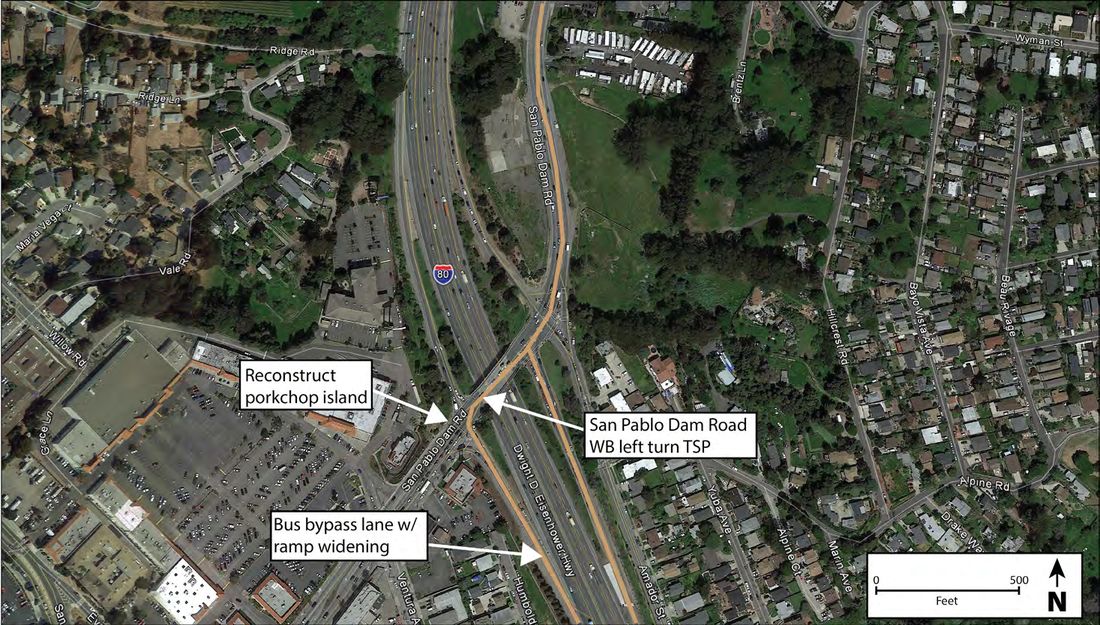
Original PDF, page 42
® ®
WEST CONTRA COSTA COUNTY
EXPRESS BUS IMPLEMENTATION PLAN Final Plan | February 2020
FA3: San Pablo Dam Road Freeway Access Improvement
Improvement Type: Freeway Access
Timeline to Implement:
39-54 months
Location:
San Pablo Dam Road/I-80 Interchange (San Pablo)
Implementation Steps:
- Caltrans Capital Improvement Process:
- Concept of Operations • PSR-PR • CE/CE • PS&E
- Coordinate with Caltrans, City of San Pablo
- Coordinate with CCTA to incorporate improvements into interchange project definition
- ROW coordination with owner of SW corner parcel
- Conduct analysis of ramp metering and traffic impacts
Term: Medium/
Long
Quantity: N/A
Cost: $4,600,000
Need: Optimal
Routes Benefitting:
Express Bus: 5 • AC Transit:
Benefit:
Allows buses from El Sobrante to bypass queues, improving reliability and travel time during peak con- gestion periods. Travel time savings estimated at approximately 800 Annual Rider Hours. This figure considers only routes proposed in this plan. Total time savings across operators would be greater.
Description of Proposed Improvement:
- Provide bus-only lane on I-80 WB on-ramp
- Add TSP to on- and off-ramp signals
Figure 6-5 - San Pablo Dam Road/I-80 Access Improvements (FA3) To improve transit vehicle access between I-80 and the proposed mobility hub on San Pablo Dam Road (project MH3), improvements are recommended on the I-80 overpass and I-80 WB on-ramp. Recommended improvements include TSP between San Pablo Dam Road and the on-ramp, and widening the on-ramp to provide an HOV bypass lane, reducing delay at the signal and allowing buses to bypass queued vehicles. This interchange is slated for major reconstruction as part of a Contra Costa Transportation Authority (CCTA) project. The project currently does not have sufficient funding, although it is included in the agency’s Transportation Expenditure Plan included in the March 2020 ballot initiative. If funding for that project is secured, the identified transit priority treatments should be included in that project. If funding for that project is not secured, then the transit-focused priority access treatments should be pursued as an alternative.
February 19, 2020
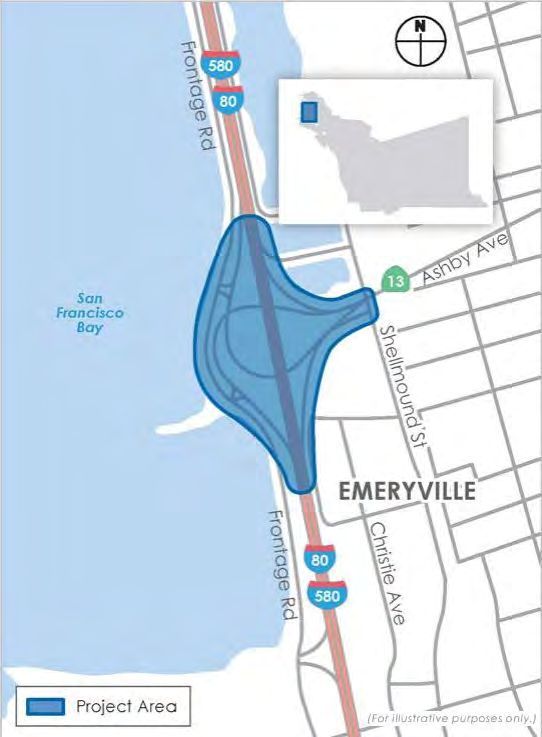
Original PDF, page 43
® ®
WEST CONTRA COSTA COUNTY
EXPRESS BUS IMPLEMENTATION PLAN Final Plan | February 2020
FA4: Ashby Avenue Freeway Access Improvement
Improvement Type: Freeway Access
Timeline to Implement:
Completed Summer 2025
Location:
Ashby Avenue/I-80 Interchange (Emeryville, Berkeley)
Implementation Steps:
- Coordinate with ACTC, Caltrans to incorporate bus-only or HOV lane into interchange construction project
Term: Medium/
Long
Quantity: N/A
Cost: $-
Need: Optimal
Routes Benefitting:
Express Bus: 2, 2A,
Benefit:
Allows buses from Emeryville to bypass queues, improving reliability and travel time during peak congestion periods. Travel time savings would accrue to 183,000 northbound trips annually. This figure consid- ers only routes proposed in this plan.
Description of Proposed Improvement:
- Provide bus-only or HOV lane on I-80 EB on-ramp
Figure 6-6 - Ashby Avenue/I-80 Interchange Project Map (FA4) Alameda County Transportation Commission (Alameda CTC) has an ongoing project to reconfigure the Ashby Avenue and I-80 interchange. The project is currently evaluating alternatives with construction slated to begin in 2022. Because there is no existing bus service through the Ashby Avenue interchange, the project is not currently considering transit access priority treatments.
However, with the service proposed in this Plan, routes serving Emeryville (2, 2A, and 6) would use the interchange to access I-80. Therefore, it is recommended that transit priority treatments be incorporated to prioritize bus movements to and from the north on I-80. The exact nature of the treatments will need to be coordinated with Alameda CTC.
As Emeryville and Oakland continue to grow as employment centers, the need for roadway treatments that promote high- efficiency travel will be increasingly important. The reconstructed interchange will be in place for several decades, making this an opportunity to ensure that the facility will accommodate a changing mode share. While no transit operators use the interchange for existing service, the presence of an HOV lane or transit priority lane could lead operators to use the interchange as part of an alignment, beyond those proposed in this Plan.
Source: Alameda CTC Project Fact Sheet
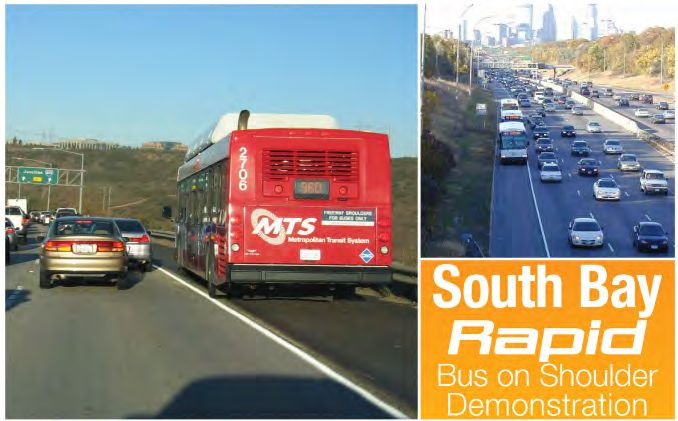
Original PDF, page 44
® ®
WEST CONTRA COSTA COUNTY
EXPRESS BUS IMPLEMENTATION PLAN Final Plan | February 2020
6.4 Part-Time Transit Lanes
Several of the proposed routes, including Route 2 in the near-term, would travel on I-80 between SR-4 and Richmond Parkway, a corridor that experiences significant congestion in the peak directions. Several existing express bus routes already travel on this segment of I-80, including the Lynx and the WestCAT JX/JPX. Between these two points, I-80 is configured with three general purpose lanes, an HOV 3+ lane (requiring at least three occupants in the vehicle), and an auxiliary lane in each direction. While buses currently use the HOV lane, the lane is quite congested and offers limited performance benefit compared to the mixed flow lanes. In addition, buses must merge across all of the mixed flow lanes to access the HOV lane. For bus routes that would serve both Hercules Transit Center and Richmond Parkway Transit Center (Routes 1, 2, 2A, and 2B), the short distance between the two Transit Centers is not sufficient to access the HOV lane and then egress back to the off-ramp.
To improve bus travel speeds and bus schedule reliability along this corridor, pursuing approval for part-time transit lane operation (also known as bus-on-shoulder) with use of the auxiliary lanes is recommended. Rather than crossing back and forth to the HOV lane or traveling in the general-purpose lanes, buses would travel in the auxiliary lanes for the approximately three-mile segment between SR-4 in Hercules and Richmond Parkway in Richmond in both the northbound and southbound directions. In segments where auxiliary lanes are not provided, the bus would operate on the shoulder. This will require upgrading shoulder pavement structures and adding signage and striping. CCTA is currently pursuing a part-time transit lane pilot program on I-680, MTC is pursuing a similar project on the approach to the Dumbarton Bridge, and SANDAG (the San Diego County metropolitan planning organization) has received approval for bus-on-shoulder on I-805 in San Diego. Bus-on- shoulder operations has been used with significant success in the state of Minnesota, which has over 250 miles of freeway shoulder on which buses are allowed to operate.
Where buses are proposed to travel on shoulders, they would only do so when speeds fall below a predetermined level and, for safety purposes, would maintain a constant differential between bus travel speeds and the speed of traffic in the adjacent general-purpose lane (specific operational parameters will be the subject of future policy). The maximum speed assumed for bus-on-shoulder operations is assumed to be 35 miles per hour. While this improvement would greatly benefit transit travel times for proposed routes using I-80 between Hercules Transit Center and Richmond Parkway Transit Center, it is not a pre-requisite for service operations.
One of the major stakeholders whose support is required to implement the proposed Part-Time Transit Lanes is the California Highway Patrol (CHP). The CHP uses the freeway shoulder for enforcement and for clearing traffic incidents, making it central to much of their work. In order to obtain CHP and Caltrans support, providing pullouts, signage, or additional infrastructure may be required.
For conceptual designs of the above improvements as well as detailed cost estimates, refer to Appendix E. San Diego will be opening a Bus on Shoulder Demonstration Project in 2020
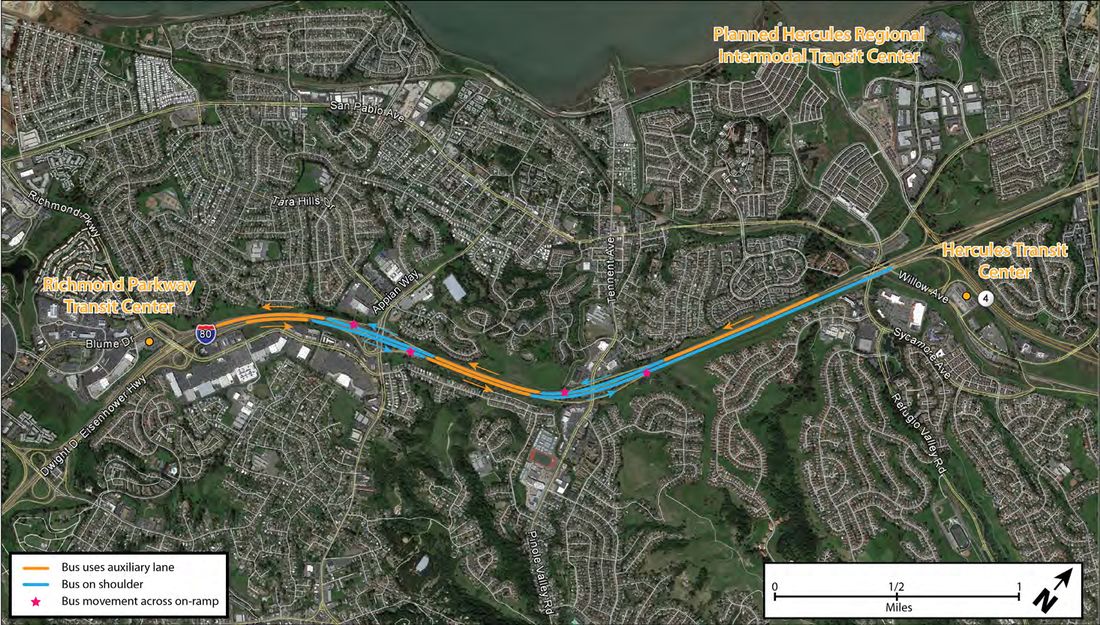
Original PDF, page 45
® ®
WEST CONTRA COSTA COUNTY
EXPRESS BUS IMPLEMENTATION PLAN Final Plan | February 2020
TL1: I-80 Part-Time Transit Lanes
Improvement Type: Freeway
Timeline to Implement:
27-36 months
Location:
I-80 Between SR-4 and Richmond Parkway Interchanges
Implementation Steps:
- Caltrans Capital Improvement Process:
- Concept of Operations • PSR-PR • CE/CE • PS&E
- Coordinate with Caltrans
- Coordinate with CHP
- Coordinate with WestCAT
- Coordinate with other transit operators using I-80
Term: Near
Quantity: N/A
Cost: $6,000,000
Need: Optimal
Routes Benefitting:
Express Bus: 1, 2, 2A, 2B • WestCAT: Lynx, JPX/JX • FAST: GX • Soltrans: R, 82 • Vine Transit: 29
Benefit:
Allows buses to maintain minimum speed on I-80, improving reliability and travel time during peak congestion periods. Travel time savings estimated at approximately 53,400 Annual Rider Hours. This figure considers only routes proposed in this plan. Total time savings across operators would be greater.
Description of Proposed Improvement:
- Bus-only lane between SR-4 and Richmond Pkwy, 3-mile segment
- Use auxiliary lane between interchanges
- Allow use of shoulder through interchanges
- Provide signage, markings, and shoulder improvements to facilitate shoulder use by buses during congested period
Figure 6-7 – I-80 Part-Time Transit Lanes (TL1) February 19, 2020
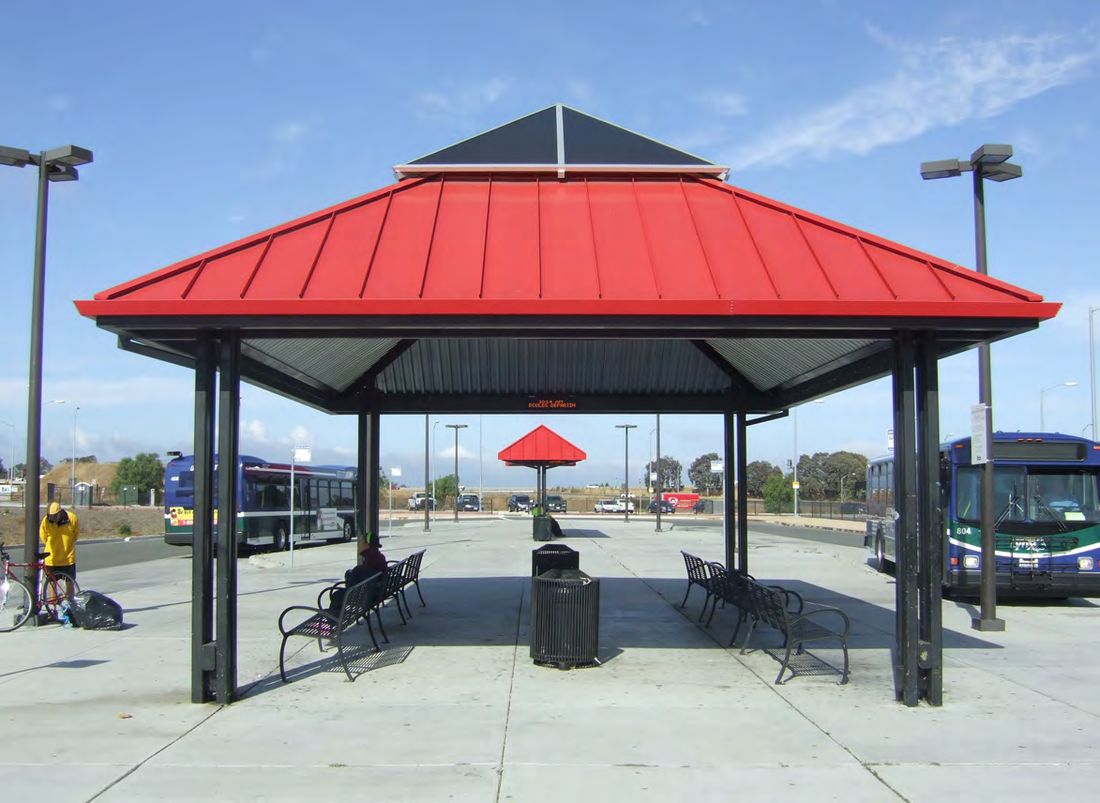
Original PDF, page 46
® ®
WEST CONTRA COSTA COUNTY
EXPRESS BUS IMPLEMENTATION PLAN Final Plan | February 2020
6.5 Transit Centers and Mobility Hubs
Existing express bus service in Contra Costa County is primarily accessed via parking in lots at transit centers. Due to the roadway network and existing land use distribution and density, it is not possible to provide transit access within the walkshed for all West County commuters.
However, the evolution of transportation technology is providing new options for how people who live outside of the walkshed can access transit.
Whichever travel mode a rider uses, for the foreseeable future, aggregation points will be needed for the effective deployment of transit. For both the existing transit centers and new transit access points, multimodal mobility hub features are proposed. This collection of mobility hubs and transit centers would feature a comprehensive suite of mobility options to allow a range of users to access transit. The mobility hubs and transit center enhancements proposed by this project are assumed to include automobile and secure bike parking, real-time arrival displays, pick-up/drop-off areas for rideshare, mobility network information, shared micro-mobility services, and electric vehicle charging. Because safety is a key consideration for many current and potential riders, lighting and anti-theft infrastructure to keep people and their belongings secure will be important to the success of the transit centers/mobility hubs.
One of the most space-intensive components of current transit center design is automobile parking. Auto parking is currently considered necessary for convenient transit access in the West County area due to incomplete bicycle and pedestrian networks, limited local transit service, and lower-density housing. In the future, multimodal improvements, infill development, or autonomous vehicles may reduce or eventually eliminate the need for auto parking at some of these facilities. Therefore, while auto parking is recommended at all of the transit center and mobility hub locations, it may be converted in the future to development or other uses and all facilities should be designed accordingly.
For conceptual designs of the above improvements as well as detailed cost estimates, refer to Appendix E.
Ownership and Maintenance of Mobility Hubs
One challenge faced in the development of the mobility hubs proposed in this Chapter is the question of ownership and maintenance. Currently two of the parcels proposed for mobility hubs are privately owned (MH1, MH2), two are owned by Caltrans (MH3, MH5), and one is owned by Contra Costa County (MH4). Historically Caltrans has operated and maintained park and ride facilities on freeway-adjacent rights-of-way.
However, recently Caltrans has expressed reservations about taking on responsibilities for new facilities. WestCAT does not currently own or operate any park and ride facilities and AC Transit is reluctant to take on any new park and ride facility obligations. However, an owner and/or operator must be identified. Options include the transit operators, the local jurisdiction that the facility is sited within, or MTC, which is currently in the process of developing three new park and ride lots as part of the Bay Bridge Forward initative.
Interim Recommendations for Richmond Parkway Transit Center
The existing excess parking demand at the Richmond Parkway Transit Center will likely limit the potential ridership for express bus routes serving the transit center prior to implementation of the capacity enhancement project (TC2). Additionally, due to its high cost, it will likely not be the first capital improvement project developed. Therefore, several potential solutions to enhance express bus access are proposed:
- The proposed mobility hub(s) at Tara Hills Drive (MH1, MH2) and San Pablo Avenue (MH3), if implemented, and additional proposed express bus service along San Pablo Avenue would likely absorb some of the current demand for parking at Richmond Parkway Transit Center.
- There is additional parking capacity located on private property near the transit center. The availability of that parking for park and ride use is not currently known. Some of the parking that may be most readily available is located further south of the transit center on Blume Drive.
Deviating buses south of Richmond Parkway Transit Center would incur a substantial penalty for riders from Hercules Transit Center and is not recommended. If, in the future, Routes 1 or 2 are split to only serve Richmond Parkway Transit Center, this deviation may be beneficial. It is assumed that the cost to provide parking on existing nearby lots would be covered by parking charges for those facilities.
- Bicycle and pedestrian treatments near Richmond Parkway Transit Center could allow users who currently drive to access it via other modes
- While the proposed capital improvement project for Richmond Parkway includes a variety of mobility hub elements, it may be feasible to implement a subset of the improvements and accompanying policies to encourage optimization of the limited parking supply, such as increased carpool priority, improved pick-up/drop-off facilities, a parking reservation system, and shared micro-mobility services.
- As a first phase, it maybe be feasible to locate bus bays on Richmond Parkway, improving service for southbound or eastbound buses (TC2-I)
Interim Recommendations for Hercules Transit Center
Like Richmond Parkway Transit Center, the Hercules Transit Center is nearing its parking capacity. The proposed project to increase parking capacity (TC1) would not require any impact to the existing parking and would be contained on property currently owned by BART. However, it will require coordination with BART, PG&E (which owns a utility substation immediately south of the property), WestCAT, and the City of Hercules.
BART, the landowner, could potentially serve as project implementation lead. Further investigation could determine the feasibility of the proposed parking in relation to the existing PG&E utility line across the property. It may be feasible to build interim parking prior to the construction of a structure if a ramp to the unused property were constructed. In addition, the proposed parking facility may require modifications to the I-80/SR-4 access improvements identified in the High-Capacity Transit study (referenced in Section 2.1), although it is not expected to preclude that future, unfunded improvement. While feasibility of the proposed parking expansion is being determined, several potential interim solutions to enhance express bus access are proposed:
- Bicycle and pedestrian treatments near Hercules Transit Center could allow users who currently drive to access it via other modes
- While the proposed capital improvement project for Hercules includes a variety of mobility hub elements, it may be feasible to implement a subset of the improvements and accompanying policies to encourage optimization of the limited parking supply, such as increased carpool priority, improved pick-up/drop-off facilities, and shared micro-mobility services.
Hercules Transit Center shelter and benches
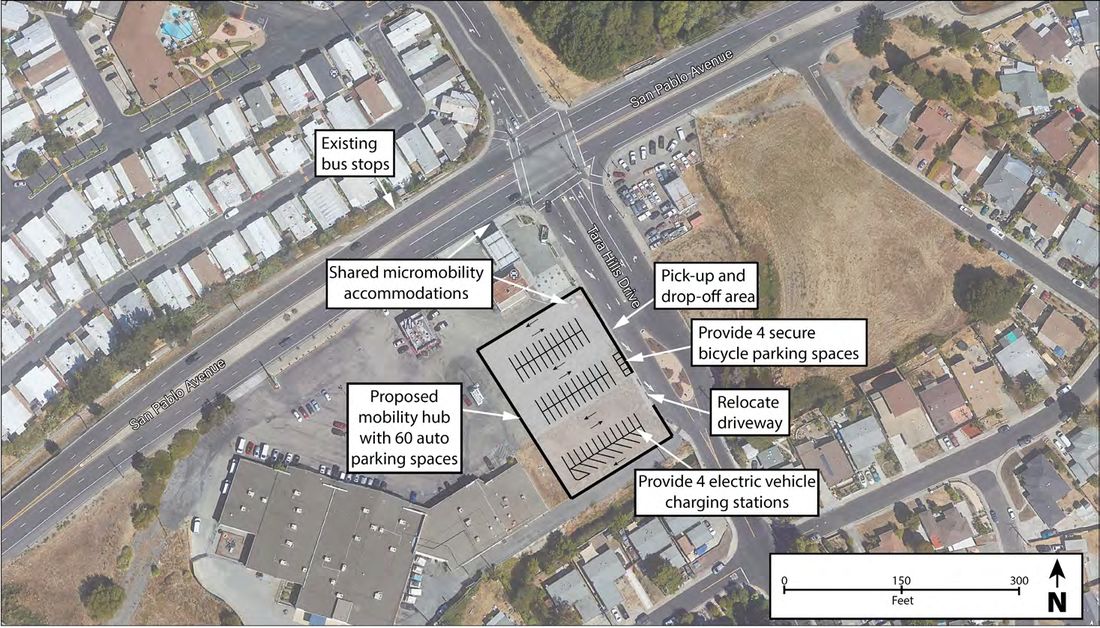
Original PDF, page 47
® ®
WEST CONTRA COSTA COUNTY
EXPRESS BUS IMPLEMENTATION PLAN Final Plan | February 2020
MH1: Tara Hills Drive Mobility Hub - Option
Improvement Type: Proposed Mobility Hub
Timeline to Implement:
9-21 months
Location:
San Pablo Avenue and Tara Hills Drive (Unincorporated Contra Costa County)
Implementation Steps:
- Identify funding to purchase property
- Coordinate with Contra Costa County over zoning and ownership
- Obtain permissions for parking lot via administrative review with Contra Costa County (requires finding that parking lot is adjacent to public transportation hub)
- Design and environmental clearance
- Traffic analysis for intersection of Tara Hills Drive and San Pablo Avenue
- Develop MOU to provide mobility hub maintenance
- Construct lot and mobility hub features
Term: Near
Quantity: 60 Stalls
Cost: $3,600,000
Need: Required
Routes Benefitting:
Express Bus: 3, 4 • WestCAT: JR/JL
Benefit:
Provides opportunity to access the express bus for Pinole and Unincorporated County residents not living within walking distance of a proposed stop. Anticipated to generate 50,000 Annual Additional Transit Trips
Description of Proposed Improvement:
- Rehabilitate pavement
- Provide transit stop amenities
- Provide secure bicycle parking
- Provide electric vehicle charging
Figure 6-8 - Proposed Tara Hills Drive Mobility Hub, Option 1 (MH1) Two potential locations for a mobility hub serving the Pinole and unincorporated Contra Costa County communities have been identified, both at the intersection of San Pablo Avenue and Tara Hills Drive. Option 1 (project MH1) is on the west side of Tara Hills Drive immediately south of the existing Valero gas station. The 1.2-acre parcel is currently partially paved. As part of the General Plan 2040 update, Contra Costa County is meeting with the community to discuss the community’s desired future use of this site. Current zoning allows for provision of a transportation hub.
The parcel could accommodate approximately 60 parking spaces within the existing lot while maintaining access through the lot to the Spectrum Center School immediately to the southwest. Existing bus stops are along San Pablo Avenue west of Tara Hills Drive, which would be used if Option 1 were selected. The mobility hub could provide an important link for commuters in Pinole and unincorporated Contra Costa County; Hercules Transit Center requires out-of-direction northward travel and the Richmond Parkway Transit Center to the south regularly reaches parking capacity. The site is far enough from I-80 that it is unlikely that commuters using I-80 would divert to travel to the site. It is recommended that MH1 be pursued first; if use is high, the other site (MH2) may also be pursued.
February 19, 2020
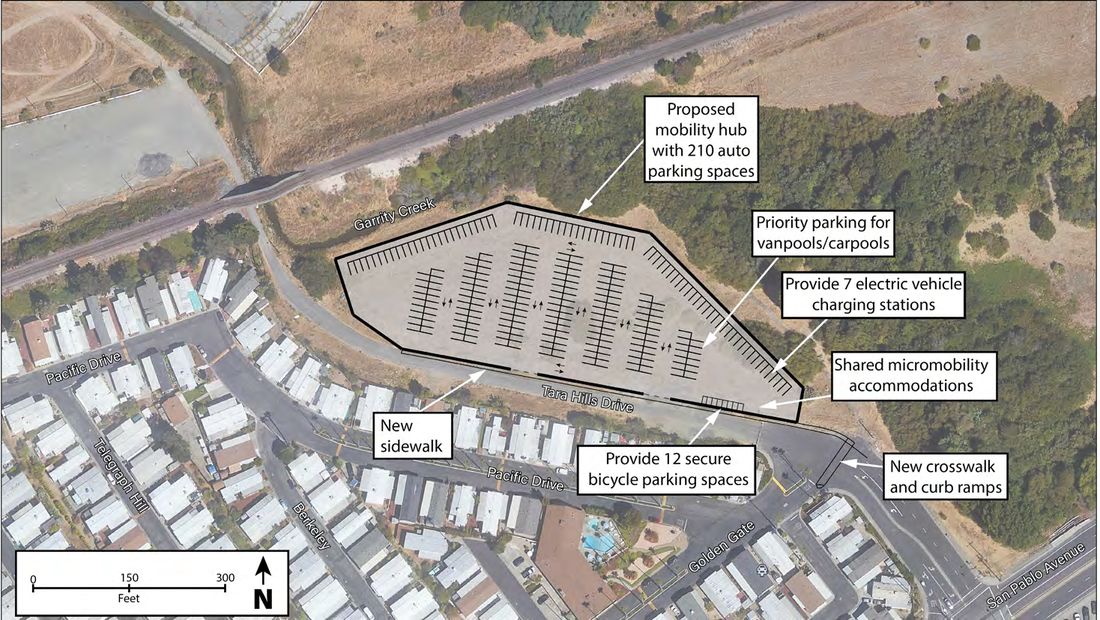
Original PDF, page 48
® ®
WEST CONTRA COSTA COUNTY
EXPRESS BUS IMPLEMENTATION PLAN Final Plan | February 2020
MH2: Tara Hills Drive Mobility Hub - Option
Improvement Type: Proposed Mobility Hub
Timeline to Implement:
24-33 months
Location:
San Pablo Avenue and Tara Hills Drive (Unincorporated Contra Costa County)
Implementation Steps:
- Identify funding to purchase property
- Coordinate with Contra Costa County over zoning and ownership
- Obtain permissions for parking lot via administrative review with Contra Costa County (requires finding that parking lot is adjacent to public transportation hub)
- Design and environmental clearance
- Traffic analysis for intersection of Tara Hills Drive and San Pablo Avenue
- Develop MOU to provide mobility hub maintenance
- Construct lot and mobility hub features
Term: Near
Quantity: 210 Stalls
Cost: $13,300,000
Need: Optimal
Routes Benefitting:
Express Bus: 3, 4 • WestCAT: JR/JL
Benefit:
Provides opportunity to access the express bus for Pinole and Unincorporated County residents not living within walking distance of a proposed stop. Anticipated to generate 160,000 Annual Additional Transit Trips
Description of Proposed Improvement:
- Clear, grade and pave site
- Provide parking lot lighting
- Provide sidewalk and stripe crosswalks
- Provide transit stop amenities
- Provide secure bicycle parking
- Provide electric vehicle charging
Figure 6-9 - Proposed Tara Hills Drive Mobility Hub, Option 2 (MH2) Tara Hills Drive Mobility Hub Option 2 (project MH2) is on the north side of Tara Hills Drive north of San Pablo Avenue, opposite the housing development. Of the 13.4 acre site, 2.3 acres are proposed for the mobility hub to provide a maximum capacity of approximately 210 auto parking spaces. Stops serving the lot would remain along San Pablo Avenue. A northbound stop could be provided along the sidewalk of the southeast corner of the intersection as a part of a proposed and entitled development there.
Crossing improvements are recommended to be provided at the intersection of Tara Hills Drive and Golden Gate to improve access to the mobility hub from the adjoining community.
Like MH1, the mobility hub could provide an important link for commuters in Pinole and unincorporated Contra Costa County; Hercules Transit Center requires out-of- direction northward travel and the Richmond Parkway Transit Center to the south regularly reaches parking capacity. The site is far enough from I-80 that it is unlikely that commuters using I-80 would divert to travel to the site. MH2 is recommended to be developed if MH1 is successful enough to regularly reach capacity.
February 19, 2020
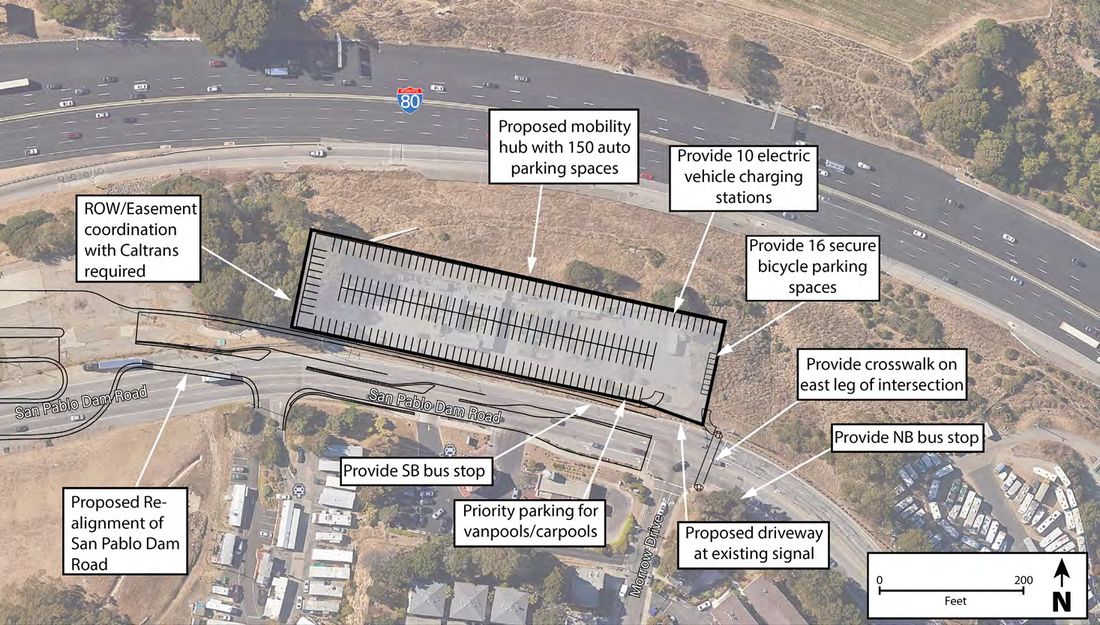
Original PDF, page 49
® ®
WEST CONTRA COSTA COUNTY
EXPRESS BUS IMPLEMENTATION PLAN Final Plan | February 2020
MH3: San Pablo Dam Road Mobility Hub
Improvement Type: Proposed Mobility Hub
Timeline to Implement:
33-42 months
Location:
San Pablo Dam Road and Morrow Drive (San Pablo)
Implementation Steps:
- Caltrans Capital Improvement Process:
- Concept of Operations • PSR-PR • CE/CE • PS&E
- Coordinate with Caltrans, City of San Pablo
- Coordinate with CCTA to incorporate improvements into interchange project definition
- Construct lot and mobility hub features
Term: Medium/
Long
Quantity: 150 Stalls
Cost: $9,900,000
Need: Required
Routes Benefitting:
Express Bus: 5 • AC Transit: L
Benefit:
Provides opportunity to access the express bus for El Sobrante residents not living within walking distance of a proposed stop. Anticipated to generate 115,000 Annual Additional Trips
Description of Proposed Improvement:
- Clear, grade, pave, and stripe mobility hub site
- Provide signal at mobility hub entrance
- Provide transit shelters with amenities
- Provide lot lighting
- Provide secure bicycle parking
- Provide electric vehicle charging
Figure 6-10 - Proposed San Pablo Dam Road Mobility Hub (MH3) The El Sobrante community is currently not-well served by transit to reach San Francisco and employment centers in the East Bay. The largest transit centers, Hercules and Richmond Parkway, are north of the community (and require out-of-direction travel), likely a factor in many residents’ choice to drive. A proposed express bus route serving a mobility hub on San Pablo Dam Road would provide an opportunity to convert those existing drivers to use transit without requiring any detour or out-of-direction travel.
Due to the lower-density nature of this part of West County, it is recommended that a mobility hub be built to connect residents to proposed express bus service, as the surrounding area is unsuitable for walk-up express bus service.
CCTA/Caltrans are currently pursuing funding to reconstruct the I-80/San Pablo Dam Road interchange; the parcel recommended for the MH3 mobility hub is planned as the staging area for this project. The mobility hub could be incorporated into the design of the interchange reconstruction and would be constructed when the parcel is vacated following project completion. Due to the topography of the parcel additional geotechnical studies may be required to determine required engineering of the site to accommodate a mobility hub.
February 19, 2020
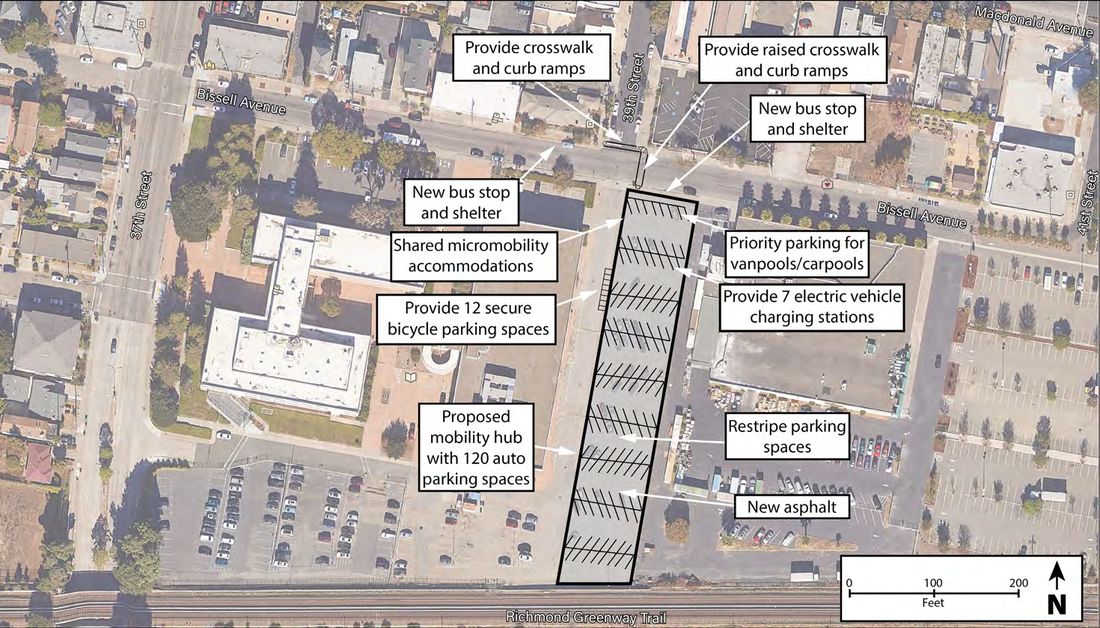
Original PDF, page 50
® ®
WEST CONTRA COSTA COUNTY
EXPRESS BUS IMPLEMENTATION PLAN Final Plan | February 2020
MH4: Bissell Avenue Mobility Hub
Improvement Type: Proposed Mobility Hub
Timeline to Implement:
9-21 months
Location:
Bissell Avenue & 39th Avenue (Richmond)
Implementation Steps:
- Coordinate with Contra Cost County for ROW
- Develop MOU with Contra Costa County
- Coordinate with City of Richmond for roadway improvements
- Evaluate opportunity for joint development
- Repave lot and provide mobility hub features
Term: Near
Quantity: 120 Stalls
Cost: $3,300,000
Need: Required
Routes Benefitting:
Express Bus: 6,
Benefit:
Provides opportunity to access the express bus for Richmond residents not living within walking distance of a proposed stop. Anticipated to generate 90,000 Annual Additional Transit Trips
Description of Proposed Improvement:
- Rehabilitate pavement
- Provide transit shelters with amenities
- Provide secure bicycle parking
- Provide electric vehicle charging
- Stripe crosswalk and provide new curb ramps
Figure 6-11 - Proposed Bissell Avenue Mobility Hub (MH4) A mobility hub is proposed on the surface parking lot of the (now vacated) Richmond Health Center on the south side of Bissell Avenue in the City of Richmond between 37th Street and 42nd Street. A mobility hub on this parcel would have capacity for approximately 120 vehicles. Bus stops serving the lot would be on the north and south sides of Bissell Avenue. The mobility hub is envisioned to serve Richmond communities, primarily to the north of the site, that are not within walking distance of the proposed route on 23rd Street or the Richmond BART Station. There are a number of residences located to the north of the facility not well-served by existing local transit that could connect to the express bus service and other nearby transit services on Macdonald Avenue at this mobility hub.
The parcel is owned by Contra Costa County and is currently being considered for sale by the Real Estate Division. Further diligence will determine whether a mobility hub is feasible at this location given County plans for the parcel.
February 19, 2020
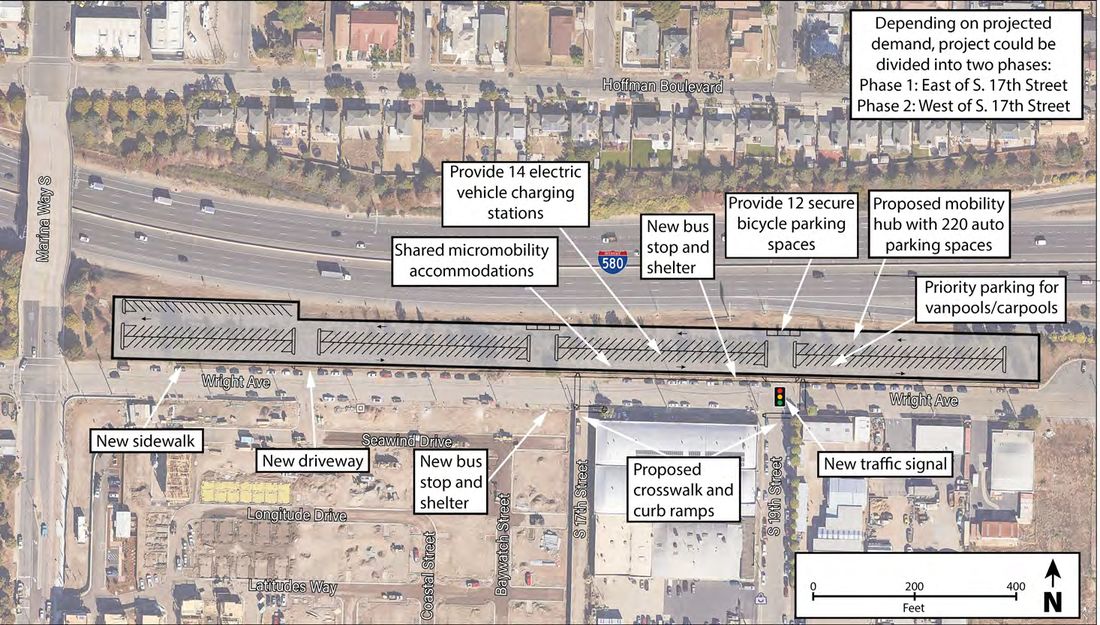
Original PDF, page 51
® ®
WEST CONTRA COSTA COUNTY
EXPRESS BUS IMPLEMENTATION PLAN Final Plan | February 2020
MH5: Wright Avenue Mobility Hub
Improvement Type: Proposed Mobility Hub
Timeline to Implement:
30-39 months
Location:
Wright Avenue and 17th Street (Richmond)
Implementation Steps:
- Caltrans Capital Improvement Process:
- Concept of Operations • PSR-PR • CE/CE • PS&E
- Coordinate with Caltrans
- Develop MOU with Caltrans for lot maintenance
- Determine need for upgrades to Wright Avenue
- Coordinate with City of Richmond for required roadway improvements
- Design and environmental clearance
- Construct lot
Term: Medium/
Long
Quantity: 220 Stalls
Cost: $12,800,000
Need: Required
Routes Benefitting:
Express Bus: 8 • Golden Gate Transit: 40, 40X
Benefit:
Provides opportunity to access the express bus for Richmond residents (and I-580 users) not living within walking distance of a proposed stop.
Anticipated to generate 170,000 Annual Additional Trips
Description of Proposed Improvement:
- Clear, grade and pave site
- Provide parking lot lighting
- Provide sidewalk and stripe crosswalks
- Provide transit shelter
- Provide secure bicycle parking
- Provide electric vehicle charging
Figure 6-12 - Proposed Wright Avenue Mobility Hub (MH5) A mobility hub is proposed on the south side of I-580 between Marina Way S and Marina Bay Parkway. The mobility hub would be constructed in the Caltrans right-of- way between Wright Avenue and I-580. The lot would have a maximum capacity of approximately 220 parking spaces. Re-grading of the site and a retaining wall are likely required to reach that capacity. A smaller park & ride may be constructed with less modification to the existing topography and thus lower cost. The hub would serve commuters from Point Richmond and Marina Bay developments. A mobility hub at this location also has the potential to capture existing I-580 users, reducing auto demands on I-580. It could also potentially be utilized by existing Golden Gate Transit service on I-580.
Conversations with MTC have suggested interest in mobility hub development as part of an ongoing Richmond-San Rafael Bridge Forward initiative. Coordination with MTC will be particularly important in pursuing this project.
February 19, 2020
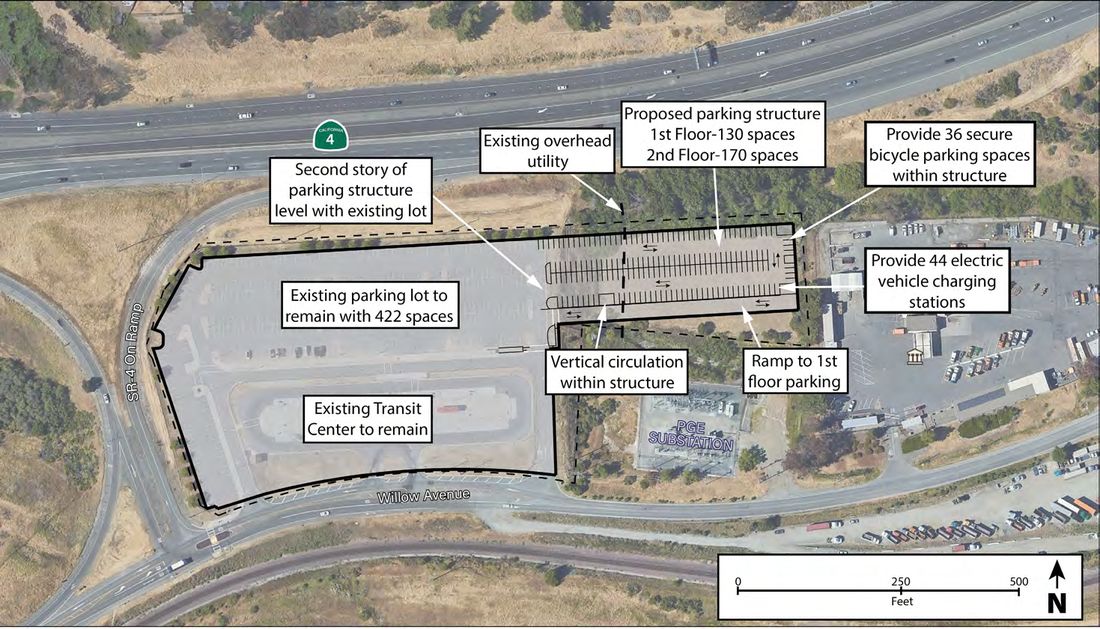
Original PDF, page 52
® ®
WEST CONTRA COSTA COUNTY
EXPRESS BUS IMPLEMENTATION PLAN Final Plan | February 2020
TC1: Hercules Transit Center Capacity Enhancement
Improvement Type: Transit Center Capacity Enhancement
Timeline to Implement:
34-40 months
Location:
Hercules Transit Center, Hercules
Implementation Steps:
- Coordinate with City of Hercules
- Coordinate with BART to gain access to parcel
- Coordinate with PG&E to relocate overhead power line
- Develop MOU to provide mobility hub maintenance
- Prepare long-term feasibility study and phasing plan
- Establish construction easement
- Evaluate whether project is suitable candidate for design-build contract
- Design and environmental clearance
- Construct parking structure
Term: Medium/
Long
Quantity: 300 Additional
Stalls
Cost: $19,500,000
Need: Optimal
Routes Benefitting:
Express Bus: 1, 2, 2A, 2B • WestCAT: LYNX, JX/JPX, JR/JL, C3, 30Z
Benefit:
Provides additional capacity to allow for continued transit user growth in accessing the express bus for Hercules residents and I-80 users not living within walking distance of a proposed stop. Anticipated to generate 230,000 Annual Additional Transit Trips
Description of Proposed Improvement:
- Relocate PG&E overhead utility line
- Provide parking structure east of existing lot
- Provide secure bicycle parking
- Provide electric vehicle charging
Figure 6-13 - Proposed Hercules Transit Center Capacity Enhancement (TC1) Owned and operated by BART, the Hercules Transit Center currently consists of 422 auto parking spaces, 12 secure bicycle parking spaces, and 12 bus bays. Parking is currently priced at $3 per day. The lot was formerly located on San Pablo Avenue on the west side of I-80 but was moved in 2009, allowing it to expand from 250 parking stalls to the current 422. Despite the expansion, parking demand is nearing the available supply, with few spaces available on a typical day.
With additional transit service proposed in this Plan, parking demand is expected to increase. To accommodate additional vehicles, a 300-stall parking structure is proposed on the BART-owned parcel immediately to the east of the existing transit center, bringing the transit center to a total of 722 parking spaces. The grade of the unimproved parcel to the east is approximately one story below that of the existing surface parking lot, allowing direct access between the existing lot and the second story of the proposed structure. Drivers would reach the first floor of the structure via a ramp. BART has a current project to install solar panels, upgrade lighting, wayfinding, and transit facilities at the existing transit center, which could complement these separate improvements.
Consideration should be given to the PG&E electrical substation located immediately to the south of the expansion parcel. A utility line travels between the substation and the development north of SR-4, passing directly over the proposed parking structure. In its current condition, the utility line would preclude a two-story structure due to clearance requirements. Therefore, some modification to the utility line is likely required. The complexity of this improvement will depend on the access rights agreement between BART and PG&E. Further coordination with BART will be necessary to determine feasibility of the proposed project.
February 19, 2020
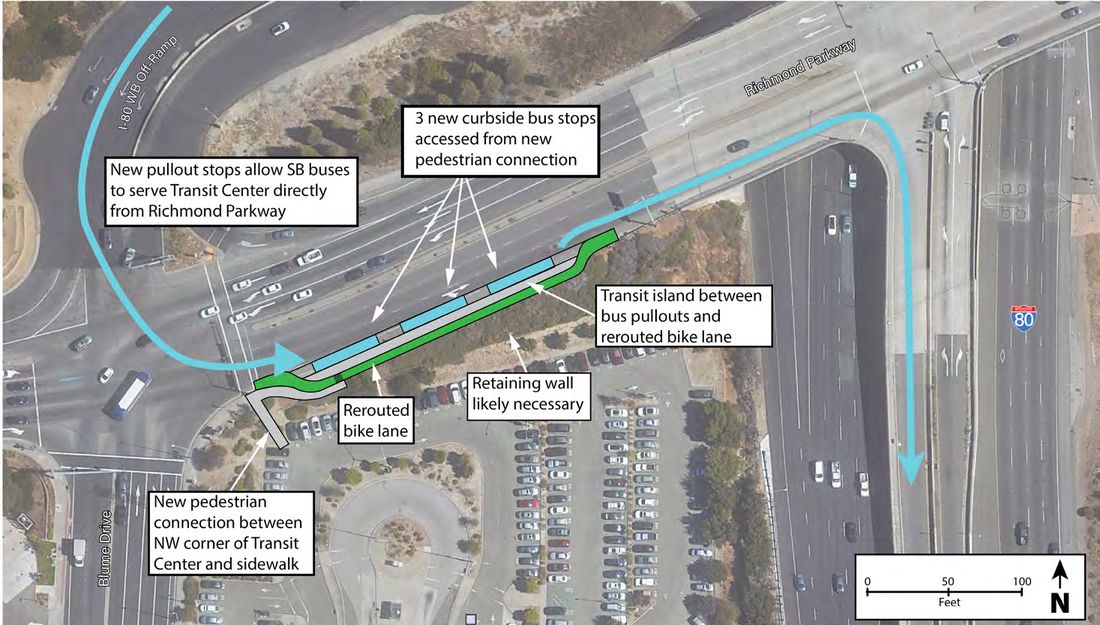
Original PDF, page 53
® ®
WEST CONTRA COSTA COUNTY
EXPRESS BUS IMPLEMENTATION PLAN Final Plan | February 2020
TC2-I: Richmond Parkway Transit Center Access Enhancement
Improvement Type: Transit Center Access Enhancement
Timeline to Implement:
18-24 months
Location:
Richmond Parkway Transit Center, Richmond
Implementation Steps:
- Prepare feasibility study • Concept development • Cost estimation • Phasing and implementation plan
- Caltrans Capital Improvement Process: • Concept of Operations • CE/CE • PS&E •
Encroachment Permit
- Coordinate with Caltrans, City of Richmond
- Design and environmental clearance
- Install bus stops on EB Richmond Parkway
Term: Near
Quantity: N/A
Cost: $3,784,000
Need: Optimal
Routes Benefitting:
Express Bus: 1, 2, 2A, 2B, 3, 4 • WestCAT: JPX, JR
Benefit:
Allows southbound or eastbound buses to serve Transit Center without circulating within. Travel time savings estimated at approximately 13,000 Annual Rider Hours.
This figure considers only routes proposed in this plan. Total time savings across operators would be greater.
Description of Proposed Improvement:
- Develop pedestrian connection between NW corner and Richmond Parkway
- Provide retaining wall if necessary
- Provide bus pull-out area on EB Richmond Parkway
Figure 6-14 - Proposed Richmond Parkway Transit Center Access Enhancement (TC2-I)
- Provide new transit island
- Reroute existing bike lane behind transit island
The Richmond Parkway Transit Center, located immediately west of the I-80/Richmond Parkway interchange, is owned by Caltrans but operated and maintained by AC Transit. The Transit Center consists of a 206-stall park & ride and six bus bays. The parking lot is currently oversubscribed and is regularly filled by 7:00 A.M. Parking is currently priced at $4 per day.
Project TC2 (subsequent page) describes the full suite of recommended improvements that would provide additional bus and parking capacity, as well as other improvements that would enhance multimodal access to the Transit Center. However, these improvements would take a significant amount of time to fully implement. In the near-term, a subset of improvements are recommended, described here.
The improvements would add a stop with three first-in-first-out bus bays on the south side of eastbound Richmond Parkway. These bus bays would allow southbound buses traveling from I-80 or eastbound buses from Richmond Parkway to serve riders without turning onto Blume Drive and circulating within the Transit Center, saving a significant amount of time (northbound or westbound buses would still be required to enter the Transit Center). Buses would be accessed via a new sidewalk on the south side of Richmond Parkway and a pedestrian connection from the northwest corner of the Transit Center. The existing class II bike lane would be rerouted behind the proposed transit island.
Additional policies that could be implemented in the interim phase include designating specific parking spaces as HOV-only, raising the parking fee to encourage more drivers to carpool, or providing an advance parking reservation system.
February 19, 2020
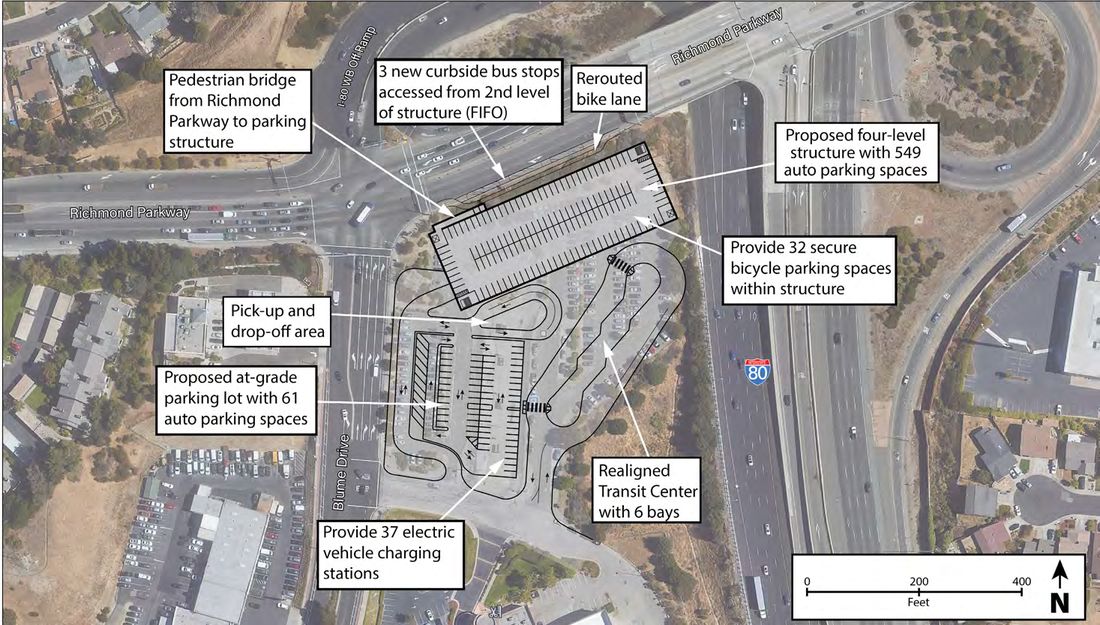
Original PDF, page 54
® ®
WEST CONTRA COSTA COUNTY
EXPRESS BUS IMPLEMENTATION PLAN Final Plan | February 2020
TC2: Richmond Parkway Transit Center Capacity Enhancement
Improvement Type: Transit Center Capacity Enhancement
Timeline to Implement:
40-46 months
Location:
Richmond Parkway Transit Center, Richmond
Implementation Steps:
- Prepare feasibility study • Concept development • Cost estimation • Funding and revenue projections • Phasing and implementation plan
- Coordinate with PG&E for possible accommodation of overhead transmission line
- Caltrans Capital Improvement Process: • Concept of Operations • PSR-PR • CE/CE • PS&E
- Coordinate with Caltrans, City of Richmond
- Develop phasing plan for continued provision of parking
- Design and environmental clearance
- Construct parking structure
Term: Medium/
Long
Quantity: 404 Additional
Stalls
Cost: $42,692,000
Need: Optimal
Routes Benefitting:
Express Bus: 1, 2, 2A, 2B, 3, 4 • AC Transit: 70, 71, LA, LC • WestCAT: JPX, JR
Benefit:
Provides additional capacity to allow for continued transit user growth in accessing the express bus for Richmond, Unincorporated County, San Pablo residents, and I-80 users not living within walking distance of a proposed stop. Anticipated to generate 295,000 Additional Transit Trips
Description of Proposed Improvement:
- Provide parking structure with 549 stalls
- Provide at-grade parking with 61 stalls
- Provide secure bicycle parking
Figure 6-15 - Proposed Richmond Parkway Transit Center Capacity Enhancement (TC2)
- Provide electric vehicle charging
Proposed interim improvements to the Richmond Parkway Transit Center are detailed in Project TC2-I above. This profile describes the full suite of proposed improvements. As described above, the existing 206-stall parking lot is currently oversubscribed and is regularly filled by 7:00 A.M, limiting the amount of park and ride access to the Transit Center.
Given the constrained footprint of the site and nearby topography, additional auto parking capacity may only be added through construction of structured parking. A four-story structure with 549 stalls is proposed in addition to reconfigured surface parking with 61 stalls, bringing the total number of parking stalls to 610. This would be an increase of 404 stalls over the existing parking capacity. The parking structure would be developed so that the second floor would align with the bus stops on Richmond Parkway, proposed in the interim improvements above (Project TC2-I), allowing direct access between the parking structure and the bus stops, improving service for eastbound and southbound buses, which would be able to pick up riders without circulating within the Transit Center. A pick-up/drop-off area would be added between the remaining at-grade lot and the new parking structure.
The proposed improvements would require that much of the existing surface parking be replaced. This would present staging challenges, given that a substantial amount of parking would be unavailable during construction. During this period, replacement parking nearby should be considered to reduce the impact of parking loss at the Transit Center, such as existing surface lots at Hilltop Mall or along Blume Drive.
February 19, 2020
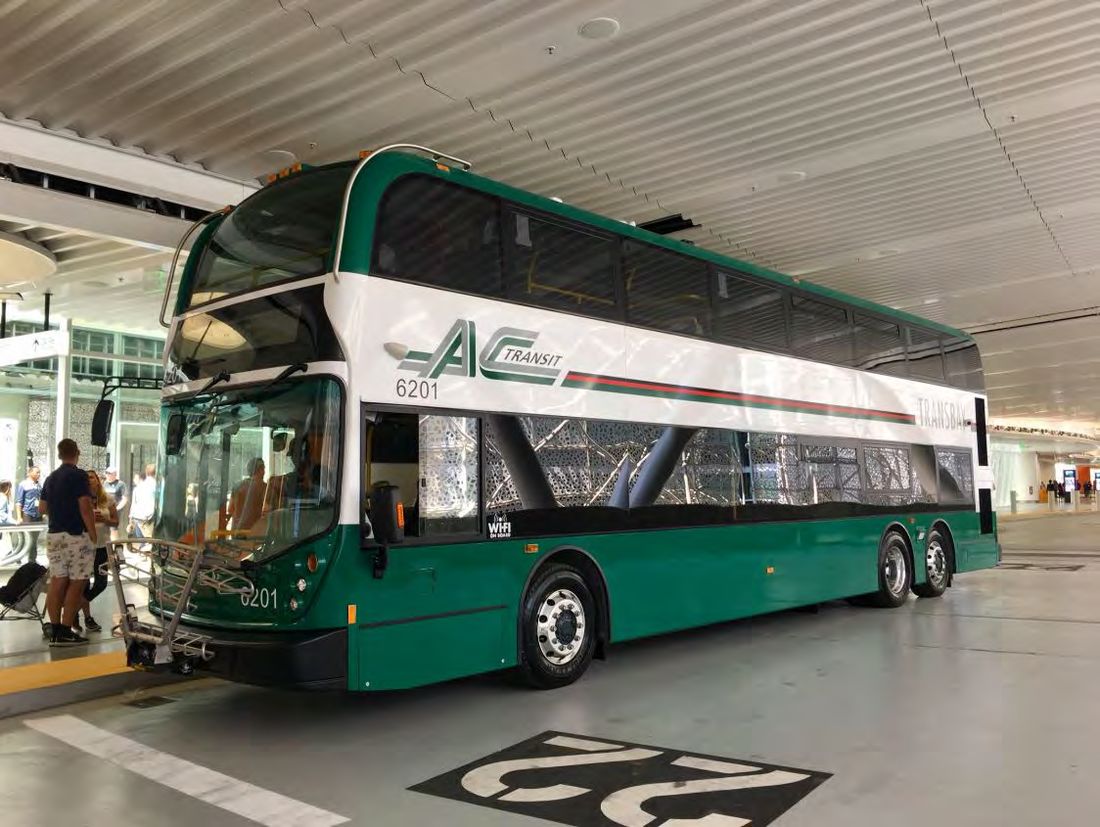
Original PDF, page 55
| Route | Term | Peak Buses | Fleet Buses | Operator |
|---|---|---|---|---|
| 1 | Medium/Long | 6 | 8 | WestCAT |
| 2 | Near | 8 | 10 | WestCAT |
| 2A | Medium/Long | 7 | 9 | WestCAT |
| 2B | Medium/Long | 7 | 9 | WestCAT |
| 3 | Medium/Long | 7 | 9 | WestCAT |
| 4 | Near | 7 | 9 | WestCAT |
| 5 | Medium/Long | 7 | 9 | AC Transit |
| 6 | Near | 7 | 9 | AC Transit |
| 7 | Near | 6 | 8 | AC Transit |
| 8 | Medium/Long | 7 | 9 | AC Transit |
| Total - Near | 15 | 19 | WestCAT | |
| 13 | 17 | AC Transit | ||
| Total - Medium/Long February 19, 2020 | 13 | 25 | WestCAT | |
| 14 | 18 | AC Transit |
® ®
WEST CONTRA COSTA COUNTY
EXPRESS BUS IMPLEMENTATION PLAN Final Plan | February 2020
6.6 Bus Fleet Acquisition
For the proposed express bus service to be implemented, buses would need to be allocated to the new routes and space must be identified at maintenance facilities for them to be maintained and stored. Neither of the two transit operators involved in this project, AC Transit and WestCAT, currently possess a sufficient number of unused vehicles to operate any new routes. To provide expanded express bus service, new vehicles will need to be purchased prior to the start of service. These vehicles are anticipated to be double decker coaches similar to those currently used by AC Transit and WestCAT for transbay services. Concurrence on vehicle type with current operator practices will reduce costs associated with maintenance and driver training. The vehicles are anticipated to include Wi-Fi and sufficient seating for all riders. All buses would be fully ADA- accessible.
High-capacity transit, if well-used, is an inherently more energy-efficient means of transportation than a private automobile. However, recent technological advances have made zero-emission buses (such as those powered by hydrogen fuel cells or lithium ion batteries) more feasible.
While these buses require significant new infrastructure and staff training, they have many benefits such as lower life cycle emissions and reduced maintenance costs (due to their simpler drivetrains). When acquiring new buses, strong consideration should be given to zero-emission vehicles.
Table 6-3 summarizes the buses required for each route identified in the Plan. The table denotes the number of minimum number of buses required to operate each route (“Peak Buses”), which is determined by the length of the alignment and the proposed frequencies (full proposed route schedules may be found in Appendix G).
To insure against bus breakdown, operators own and maintain spare buses for each route, typically 20% over the number of buses required to operate the route during the peak period. This number, referred to in the table below as “Fleet Buses” is the number of vehicles that must be purchased to operate each route. The useful lifetime of coach transit buses is at least 14 years. Any required replacement buses would be outside of the 10-year funding window described in Appendix H.
Table 6-3 - Required Buses by Route and Operator AC Transit double-decker Transbay Bus (photo credit: AC Transit)
Original PDF, page 56
® ®
WEST CONTRA COSTA COUNTY
EXPRESS BUS IMPLEMENTATION PLAN Final Plan | February 2020
BA1: Buses for Near-Term Routes
Improvement Type: Bus Acquisition
Timeline to Implement:
18-24 months
Location:
N/A
Implementation Steps:
- Coordinate with transit operators on vehicle type and cost
- Coordinate with transit operators on bus features (e.g. technology, configuration, wrap)
- Order buses from manufacturer
Term: Near
Quantity: 36 Buses
Cost: $36,000,000
Need: Required
Routes Benefitting:
Express Bus: 2, 4, 6,
Benefit:
N/A
Description of Proposed Improvement:
- Purchase 36 buses, 17 for AC Transit-operated routes and 19 for WestCAT- operated routes
BA2: Buses for Medium/Long-Term Routes
Improvement Type: Bus Acquisition
Timeline to Implement:
18-24 months
Location:
N/A
Implementation Steps:
- Coordinate with transit operators on vehicle type and cost
- Coordinate on bus features (e.g. technology, configuration, wrap)
- Order buses from manufacturer
Term: Medium/
Long
Quantity: 43 Buses
Cost: $43,000,000
Need: Required
Routes Benefitting:
Express Bus: 1, 2A, 2B, 3, 5,
Benefit:
N/A
Description of Proposed Improvement:
- Purchase 43 buses, 18 for AC Transit-operated routes and 25 for WestCAT- operated routes
| Project Number | Improvement Name | Phase | Cost |
|---|---|---|---|
| BS1 | Bus Stop Improvements - Pinole, Richmond, Contra Costa County | Near | $ 440,000 |
| BS2 | Bus Stop Improvements - San Pablo, Richmond | Near | $ 626,000 |
| BS3 | Bus Stop Improvements - San Pablo, Richmond | Medium/Long | $ 693,000 |
| BS4 | Bus Stop Improvements - Berkeley | Near | $ 621,000 |
| BS5 | Bus Stop Improvements - Emeryville, Oakland | Near | $ 611,000 |
| BS6 | Bus Stop Improvements - Oakland | Near | $ 333,000 |
| TSP1 | Transit Signal Priority - San Pablo, Richmond | Near | $ 360,000 |
| TSP2 | Transit Signal Priority - San Pablo, Richmond | Medium/Long | $ 400,000 |
| TSP3 | Transit Signal Priority - San Pablo, Contra Costa County | Medium/Long | $ 80,000 |
| TSP4 | Transit Signal Priority - Berkeley | Near | $ 220,000 |
| TSP5 | Transit Signal Priority - Emeryville, Oakland | Near | $ 320,000 |
| TSP6 | Transit Signal Priority - Oakland | Near | $ 200,000 |
| FA1 | SR-4/John Muir Parkway Freeway Access Improvement | Near | $ 3,600,000 |
| FA2 | Richmond Parkway Freeway Access Improvement | Near | $ 900,000 |
| FA3 | San Pablo Dam Road Freeway Access Improvement | Medium/Long | $ 4,600,000 |
| FA4 | Ashby Avenue Freeway Access Improvement | Medium/Long | $ - |
| TL1 | I-80 Part-Time Transit Lanes | Near | $ 6,000,000 |
| MH1 | Tara Hills Drive Mobility Hub - Option 1 | Near | $ 3,600,000 |
| MH2 | Tara Hills Drive Mobility Hub - Option 2 | Near | $ 13,300,000 |
| MH3 | San Pablo Dam Road Mobility Hub | Medium/Long | $ 9,900,000 |
| MH4 | Bissell Avenue Mobility Hub | Near | $ 3,300,000 |
| MH5 | Wright Avenue Mobility Hub | Medium/Long | $ 12,800,000 |
| TC1 | Hercules Transit Center Capacity Enhancement | Medium/Long | $ 19,500,000 |
| TC2-I | Richmond Parkway Transit Center Access Enhancement | Near | $ 3,784,000 |
| TC2 | Richmond Parkway Transit Center Capacity Enhancement | Medium/Long | $ 42,692,000 |
| BA1 | Buses for Near-Term Routes | Near | $ 36,000,000 |
| BA2 | Buses for Medium-/Long-Term Routes | Medium/Long | $ 43,000,000 |
| Subtotals | Near-Term Projects | $ 74,215,000 | |
| Medium/Long-Term Projects | $ 133,665,000 | ||
| Total Cost | All Projects | $ 207,880,000 |
| Facility Name | Current Capacity | Current Available Capacity | Additional Capacity Needed for Near Term Routes |
|---|---|---|---|
| AC Transit Division 2 | 147 | 0 (24 buses over capacity) | 0 |
| AC Transit Division 3 | 90 | 0 (19 buses over capacity) | 17 |
| WestCAT | 50 | 0 | 19 |
| Improvement Type | Project Code | Cost |
|---|---|---|
| Bus Stops | BS | $ 3,324,000 |
| Transit Signal Priority | TSP | $ 1,580,000 |
| Bus Acquisition | BA | $ 79,000,000 |
| Mobility Hub | MH | $ 42,900,000 |
| Transit Center Improvement | TC | $ 65,976,000 |
| Freeway Access Improvement | FA | $ 9,100,000 |
| Part-Time Transit Lanes | TL | $ 6,000,000 |
® ®
WEST CONTRA COSTA COUNTY
EXPRESS BUS IMPLEMENTATION PLAN Final Plan | February 2020
6.7 Operator Maintenance Facility Improvements
AC Transit manages four operating divisions supported by the Central Maintenance Facility. Of these facilities, Division 2 (D2) in Emeryville and Division 3 (D3) in Richmond are the closest to the route alignments proposed in this Plan. WestCAT operates a single maintenance facility in Pinole. As of the writing of this report, both AC Transit and WestCAT lack additional bus storage capacity at these maintenance facilities, meaning that capacity expansion at the WestCAT facility and at least one of the AC Transit facilities will be necessary before additional express bus service can begin operation. Table 6-4 shows the current capacity and usage of each of these facilities.
To address its storage constraints, WestCAT plans an expansion of its existing facility. The parcel adjacent the existing yard has been purchased and funding is available from RM3 to construct the new facility, pending resolution of the lawsuit challenging RM3.
AC Transit has stated that, to accommodate buses at the D3 facility in Richmond, buses serving existing routes would need to be shifted among its other maintenance yards to provide sufficient space. The specific changes necessary would depend on allocation of AC Transit buses at the time of the launch of proposed expanded express service.
Table 6-4 - AC Transit and WestCAT Facility Capacity
6.8 Summary of Costs
Estimates of probable cost were developed for all of the capital expenditures included in this Plan, including physical improvements and bus acquisition. Costs were estimated based on a conceptual level of design and refined based on further design development. All costs are provided in 2019 dollars for consistency, although year of expenditure estimates were utilized in the development of the financial plan. Estimated costs for all proposed capital improvements are shown below. Table 6-5 summarizes proposed project cost by type and Table 6-6 provides the cost of each proposed project. For detailed cost estimates, refer to Appendix E.
Table 6-5 - Estimated Capital Improvement Cost by Project Type Table 6-6 - Estimated Capital Improvement Cost by Project Note: All costs in 2019 dollars Note: All costs in 2019 dollars February 19, 2020 February 19, 2020
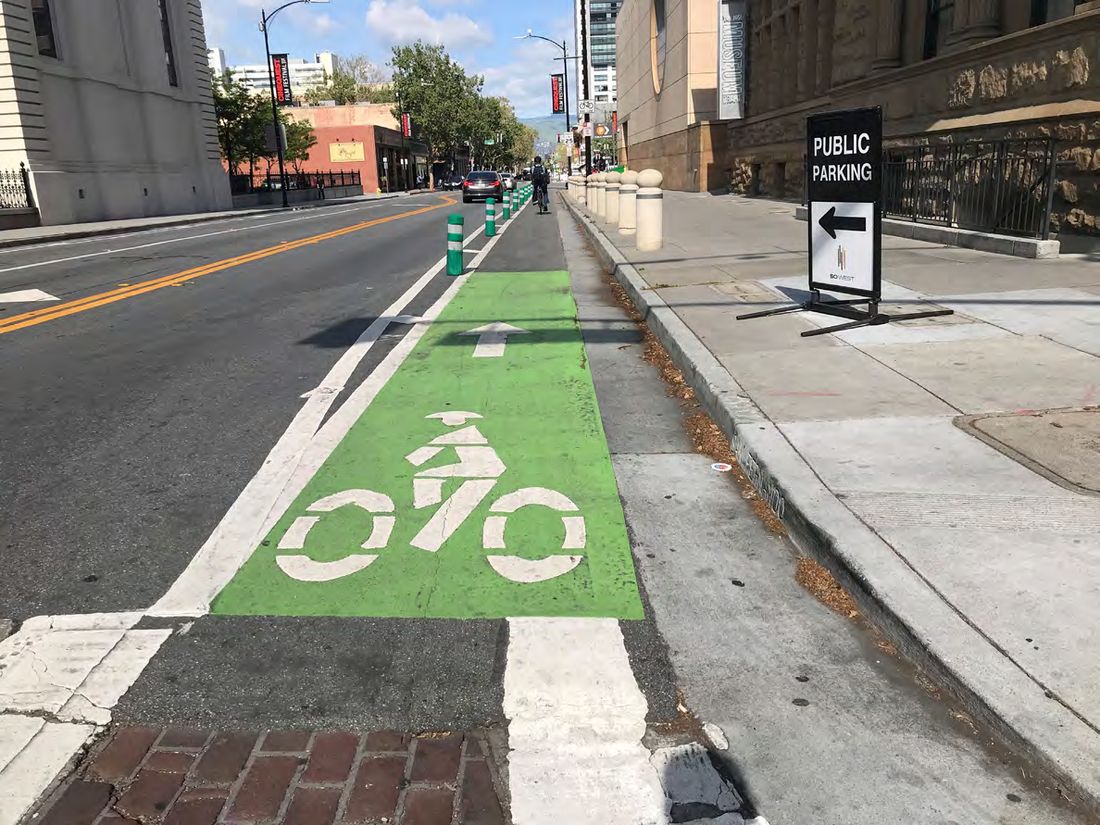
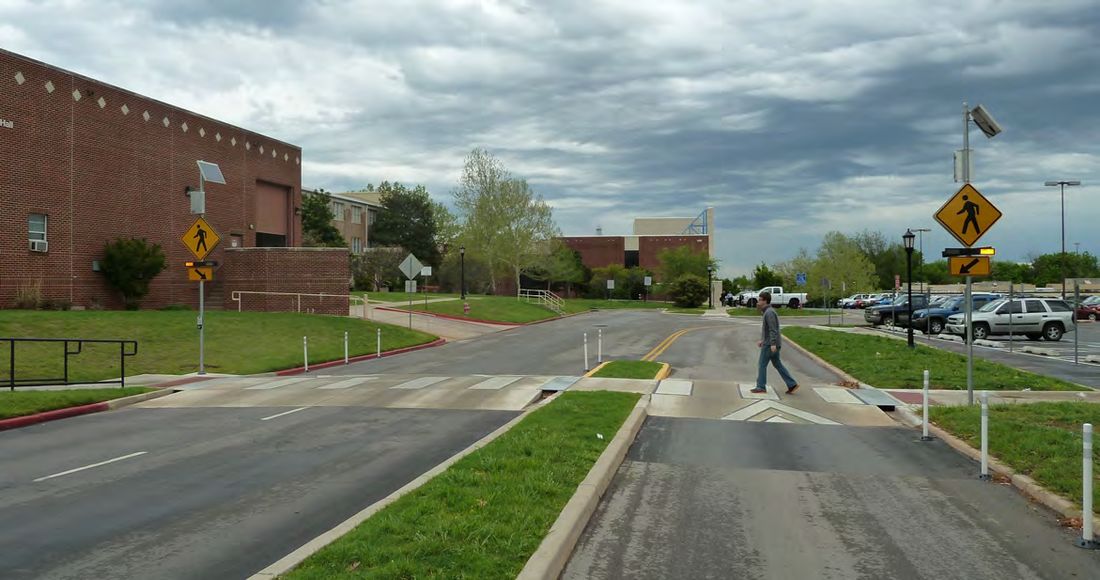
Original PDF, page 58
® ®
WEST CONTRA COSTA COUNTY
EXPRESS BUS IMPLEMENTATION PLAN Final Plan | February 2020
6.9 Bicycle and Pedestrian Improvements
Existing pedestrian and bicycle facilities within 0.25 miles of all proposed stops were analyzed to determine whether there were infrastructure gaps that would prevent easy and safe access by foot for by bicycle. Closing these gaps is especially important on the destination side of the proposed routes, as riders will need to travel between the bus stop and their place of work on foot or via bicycle (either one brought from home via an onboard bicycle rack or accessed from a bikeshare station).
To address existing gaps, recommendations were made that either prioritize already-planned improvements or suggest improvements not already planned. These gaps and recommendations to address them are identified in Appendix F.
It is recommended that the local jurisdictions incorporate these recommendations in future bicycle and pedestrian planning efforts. The identification of these recommendations as being critical for transit access should enhance the competitiveness of the identified projects for grant applications and should increase their priority within implementation programs. These projects are not included in the capital improvements costs identified in this Plan as they are anticipated to be implemented by local jurisdictions and not out of the primary funding sources identified for this project.
Class IV bollard-separated bikeway in San José, California Raised crosswalk and Rectangular Rapid Flash Beacon (RRFB)
Original PDF, page 59
® ®
WEST CONTRA COSTA COUNTY
EXPRESS BUS IMPLEMENTATION PLAN Final Plan | February 2020
7. FINANCIAL PLAN
A ten-year financial model was developed to assess the implementation feasibility of the proposed express bus routes and the associated capital projects. The goal of the analysis is to identify and confirm the feasible sub-set of routes and projects that could be implemented within the known funding sources, and then to quantify the remaining funding gaps to help decision-makers seek funding to support the implementation of the full Plan. The complete Financial Plan can be found in Appendix H. The remainder of this chapter is organized into two sections:
- Funding Sources lists the set of capital and operating monies that were considered, including several sources that are well-defined at this time and some additional prospective sources.
- Financial Model describes the inputs and assumptions that shaped the financial calculations, the conclusions of the model calculations for two different identified scenarios and recommendations for next steps.
7.1 Funding Sources
The funding for the new express bus routes could come primarily from two sources that are not yet available. The Metropolitan Transportation Commission’s Regional Measure 3 (RM3) and the Contra Costa Transportation Authority’s new Transportation Expenditure Plan (TEP) both have specific funding allocations dedicated to support the express bus services. There are other minor funding sources available to supplement these core revenues, but they do not materially affect the financial analysis.
MTC Regional Measure
Passed by voters in the nine-county Bay Area in June of 2018, RM3 raised tolls on seven bridges (excluding the Golden Gate Bridge) by $3 to fund $4.5 billion of Bay Area transportation projects. The measure is the subject of a lawsuit challenging its validity, and while funds are being collected into an escrow account, no funds can be disbursed. RM3 funds may be allocated to projects in either Contra Costa or Alameda County Capital Projects The RM3 expenditure plan includes a $25 million set-aside for three capital projects known as “I-80 Transit Improvements.” The WestCAT Bus Operations Facility Expansion and Modernization ($5 Million) will help fund the costs of the expansion of WestCAT facilities that would be necessary to launch additional express bus services. The Express Bus Service Expansion in I-80 Corridor ($5 Million) will provide funding to acquire new express bus vehicles for WestCAT service. The I-80 Corridor Transit Improvements ($15 Million) will be evenly divided to support this express bus service in West Contra Costa County and improvements to Rapid Bus and BRT services along San Pablo Avenue. RM3 also includes funds for AC Transit Rapid Bus Corridor Improvements, which several of the express bus routes operate on and may fund Transit Signal Priority projects and stop enhancements.
Regional Express Bus Operating Funds RM3 also allocates $20 million per year towards regional express bus services. The routes proposed in this study relieve congestion in the bridge corridors and would almost certainly be eligible for these operating funds. The financial analysis assumes that up to 25 percent of the funds ($5 million per year) could flow to support new express bus routes in West Contra Costa County. That allocation does not increase with inflation and does not allow for carry-over from year-to-year.
CCTA Transportation Expenditure Plan
The Contra Costa Transportation Authority (CCTA) has approved a new 35-year Transportation Expenditure Plan (TEP) that will on the ballot in March 2020. The TEP includes “Improve Transit Reliability Along the I-80 Corridor” ($90 Million) specifically focused on new transit projects for congestion relief in the I-80 corridor in West Contra Costa County. The TEP specifically cites new express bus service, highway interchange and access improvements, and dedicated part-time transit lanes on I-80 as potential investments, all of which are included as elements of the Implementation Plan. Discussions with CCTA staff indicated that this $90 million would be considered dedicated funding towards the recommendations of this study, and that the funds could be spent on any project components that are physically located in Contra Costa County as well as vehicle purchases and operating expenses. Should the TEP pass we expect funds could become available as soon as FY2021-2022.
Three other TEP project funding categories, “Relieve Congestion and Improve Local Access Along the I-80 Corridor” ($57 Million), “Improve Traffic Flow on Major Roads in West County” ($38 Million) and “Increase Bus Services and Reliability in West County” ($250 Million) include projects that would align with those proposed to support the express bus service, such as transit priority treatments and freeway access enhancements. As a conservative assumption, the financial analysis does not include any funds from these categories towards the completion of those aligned capital projects. Project sponsors should apply for funding in this category to supplement confirmed available sources. Funds from the CCTA TEP are restricted to projects in Contra Costa County and may not be spent in Alameda or other counties.
Additional Funding Sources
Beyond these two major potential sources of funding, other grants and fund sources are available to the project sponsors. Capital project funds from state and federal sources almost always require competitive grant applications and it is virtually impossible to predict how the projects from this study would fare relative to other potential applicants; therefore, the financial model does not portray any revenues from these sources. The Financial Plan includes identification of these grant programs and discussion on their applicability to proposed capital projects. There are a few facility and interchange projects that will support the express bus service that are being independently funded and pursued as components of larger projects and are excluded from the Financial Plan.
Several existing state and federal sources fund transit operations through formula-based allocations. The addition of new transit service can trigger some incremental revenue allocations due to the new passengers and fares they generate. The financial analysis includes estimates of the incremental and relatively minor revenues that could be available from these sources. It is beneficial to future grant efforts however that much of the Plan area is a designated community of concern, within a Priority Development Area and is along one of the region’s major, congested corridors. Also the area has a nationally significant freight corridor, with significant greenhouse gas emissions from port, oil refinery and other industrial uses.
A full description of all these additional capital and operating fund sources are included in Appendix H.
7.2 Financial Model
The financial model is a ten-year composite calculation of costs and revenues, with separate calculations for capital and operating needs. Results are presented in year of expenditure dollars (YOE$). As a baseline input, the financial model assumes that any available funds, as described above, would be released at the beginning of FY 2021-22. A baseline inflation rate of 3.5 percent per year was used to represent background inflation effects, based on the long-term trend in the consumer price index (CPI). The inflation rate was utilized to grow fares, operating costs, and capital costs. The transit operators provided a conservative estimate of marginal operating cost per total hour to use in the calculations. This financial analysis does not include future costs beyond the 10 year horizon, such as the renewal and replacement of major assets including transit vehicles and fixed facilities in transit centers and mobility hubs.
Capital Costs
As noted in Chapter 6, each of the recommended capital projects was labeled as either required or optimal to initiate express bus service and associated with the route(s) they would benefit. The financial model included optimal project related to near-term routes.
Another key factor in determining financial feasibility is project eligibility. For example, funds from the TEP cannot be spent on projects located in Alameda County and RM3 funds assigned to Rapid Bus Corridor Improvements can only be used on designated Rapid Bus Corridors. To facilitate alignment of capital funding sources and uses, the capital project list was further segmented to reflect these two distinctions.
The capital costs incorporated into the model are noted in Chapter 6.
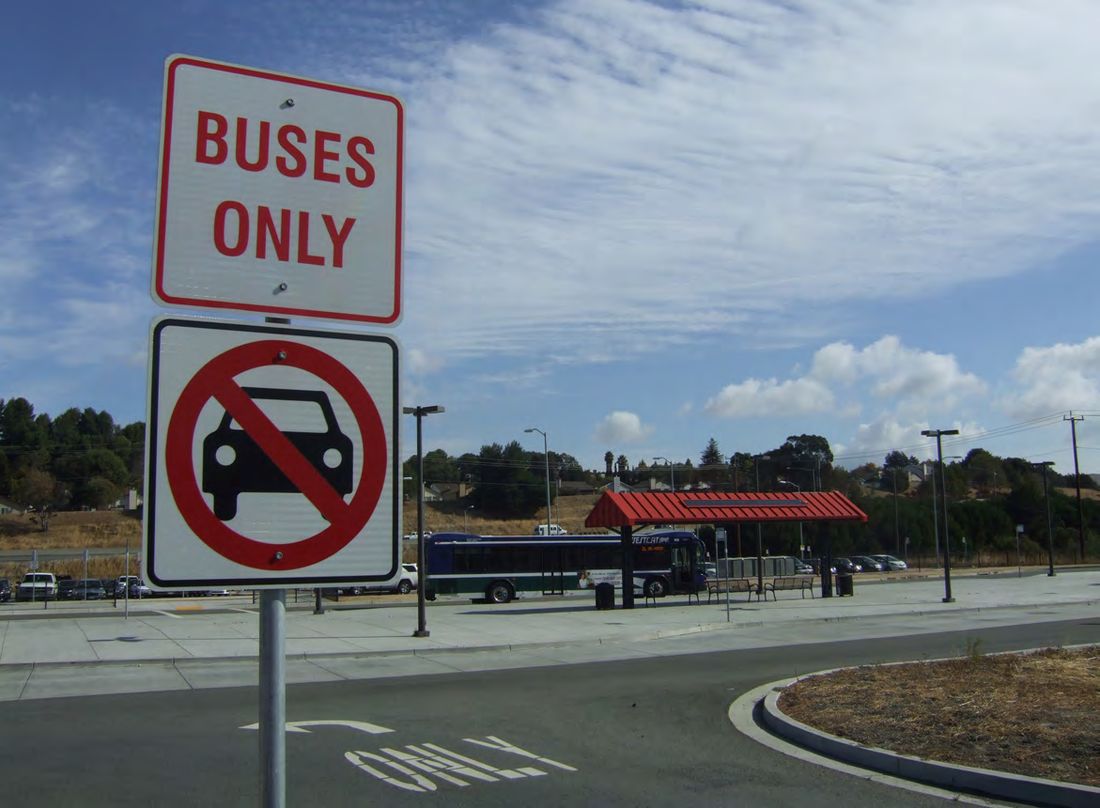
Original PDF, page 60
® ®
WEST CONTRA COSTA COUNTY
EXPRESS BUS IMPLEMENTATION PLAN Final Plan | February 2020
Operating Expenses and Revenues
Two route groupings were analyzed in the financial model. The first grouping includes only the near-term routes, and the second grouping includes near-term routes plus the medium/long-term routes, with the medium/long-term routes deployed at least four years after service begins on the near-term routes. For the purposes of the financial analysis, it was assumed that no route warrants midday service within the ten-year horizon of the Plan; all routes are assumed to be peak-only operation. The operating cost for each route is noted in Chapter 5 and further discussed in the Service Plan in Appendix G.
The operation of the express bus routes will generate revenues from passenger fares that can be applied towards the cost of the new service. A range of fare revenues for each route were developed, which was assumed to grow as the cost and travel time competitiveness of transit improves through the capital program included in this Plan and other factors.
The operating and maintenance cost of transit centers and mobility hubs are assumed to be covered from user charges. All other operating and maintenance costs, such as bus stops and maintenance facilities, are assumed to be included in the operating cost rate provided by the operators.
The final input to the financial analysis was the inclusion of non-operating funding available from the funding sources noted previously.
Model Results
Two separate funding scenarios were performed: one in which only RM3 would be available (without the CCTA TEP) and another where both RM3 and the TEP were utilized.
A scenario that relies primarily on funding from RM3 is unlikely to be both technically and financially viable. By itself, RM3 provides only $12.5M in guaranteed funding for express bus capital projects and $5M per year in operating funding. New buses cost about $1 million each in current dollars, and each of the routes in the Plan requires between 7 and 10 vehicles. Therefore, no new service would be recommended in an RM3-only financial scenario.
The RM3 + TEP scenario is financially viable under certain conditions. The TEP provides a significant boost to the capital funding capacity, which would be enough to fund all of the required projects necessary to launch the near-term routes, together with the operating costs through the first ten years of implementation. The financial analysis assumes that nearly $14 million in RM3 money would be made available to the project through a combination of $12.5 million from the dedicated express bus line items plus up to $1.2 million from the Rapid Bus line item. About $49 million in capital costs would be funded from the dedicated TEP line item for the required projects for near-term express bus services, leaving a balance $41 million in that line item for other expenditures. The expansions of the two transit centers at Hercules and Richmond Parkway and the second site at the Tara Hills Drive mobility hub are the primary items that are considered optimal projects and not included in the $49 million. It is not possible to complete all three of those projects as currently envisioned within the remaining $41 million.
Prioritization of these addition capital improvements will depend on future conditions. The second Tara Hills Drive Mobility Hub (project MH2) should only be pursued if the first Tara Hills Drive Mobility Hub (project MH1) has been successful and is reaching capacity. The improvements for Hercules Transit Center (project TC1) and Richmond Parkway Transit Center (TC2) should be advanced based on funding availability and will require extensive coordination with BART, AC Transit, and Caltrans, which will determine a possible timeline.
The annual operating cost for the four near-term routes is $5.4 million in current dollars. This figure increases to $6.4 million in current dollars when the conversion from Route 2 to Routes 2A and 2B is implemented. In YOE dollars, the total operating expenses over the ten-year Implementation Plan are just above $59 million. About $15.6 million of the total operating expense is covered by fare revenues, with majority of the balance coming from the RM3 operating funds and a modest contribution from state and federal grant programs like TDA-STA and FTA 5307.
It should be noted that in Year 8 of the Implementation Plan, the operating expenses increase to the point that the required RM3 funding contribution would hit the assumed $5 million cap. The funding plan contemplates that additional operating contributions would come from the CCTA TEP to fill the gap.
Based on the analysis, in an RM3 + TEP scenario, the four near-term routes are feasible and could be implemented as soon as both RM3 and the TEP funds are confirmed to be available. The remaining medium/long-term routes would require an additional influx of funding to bring into operation. The required projects for the near-term routes can be built immediately with available funds, and even some of the optimal projects can be pursued right away while additional funding is identified to complete the full funding package needed to construct the transit center expansions and additional mobility hubs. Available TEP money beyond what is needed to build the required projects and operate the near-term routes for a ten-year period could be utilized as seed money to pursue grant funds to cover the full cost of the optimal projects for the near-term routes, could be used to advance interim projects that would increase the capacity of the transit centers and mobility hubs while the long-term projects are being pursued, or could be stored away to cover future operating costs that due to inflation would exceed what is envisioned to be available from RM3.
Based on consultation among members of the Project Management Team, it was determined that operating funds will be allocated directly to each of the transit agencies each year, similar to the mechanism currently in use for CCTA’s existing Measure J. Operators could choose to allocate additional funds from their other resources to augment the express bus services beyond the service levels contemplated in this Plan, but that has not been assumed here. Additional funding is necessary to realize the full-scale implementation of all express bus routes proposed in this Plan.
Hercules Transit Center Bus Entrance
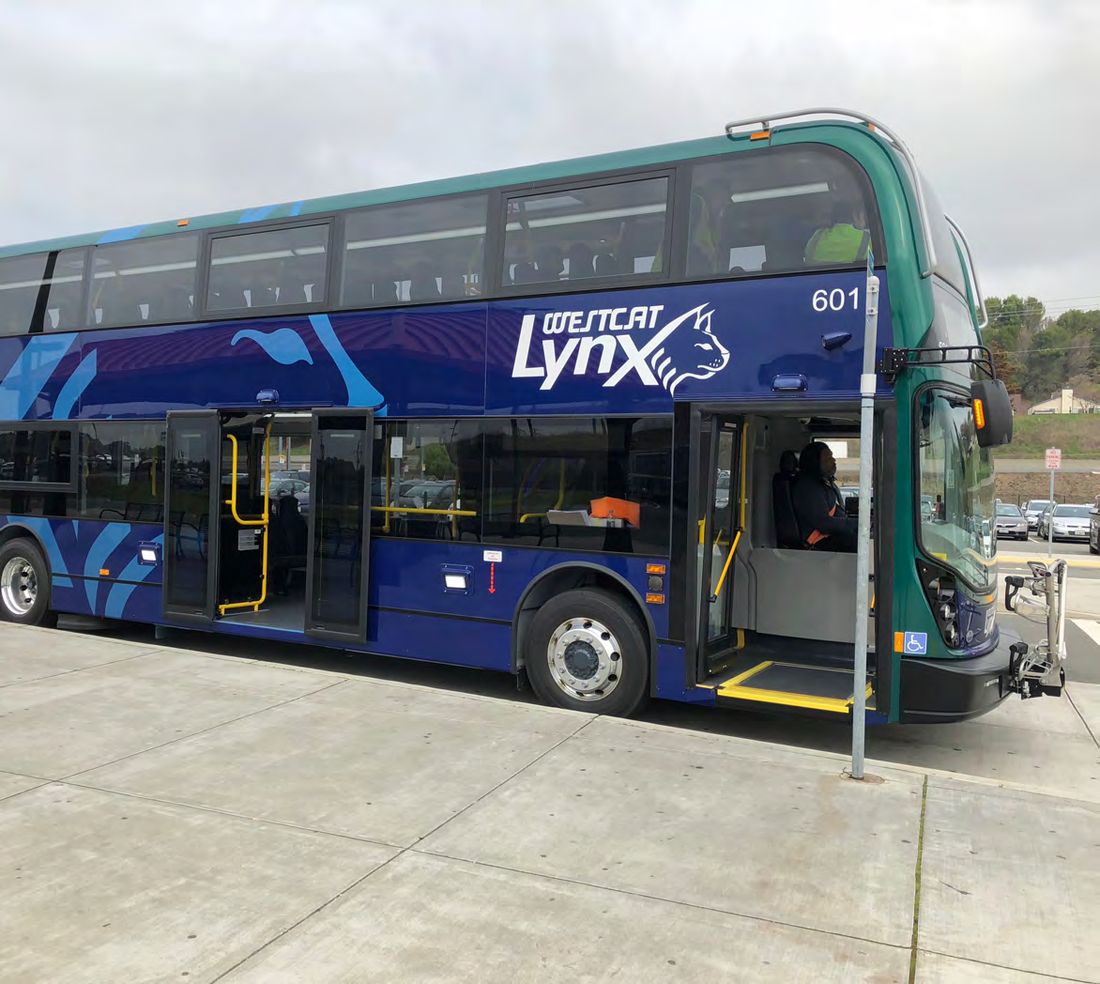
Original PDF, page 61
® ®
WEST CONTRA COSTA COUNTY
EXPRESS BUS IMPLEMENTATION PLAN Final Plan | February 2020
8. MARKETING AND BRANDING
The project included development of a marketing plan describing recommended strategies to be deployed before and during service implementation to establish awareness and excitement around the new service. This also included recommendations around branding of the service. A Marketing and Branding Plan was prepared and provided to the transit operators. It is anticipated to be utilized as a living document and will undergo further refinement prior to the start of route operations.
8.1 Marketing and Branding Goals
The Marketing and Branding Plan laid out a framework to achieve the following goals:
- Create expanded express bus service awareness. The express bus represents an expansion of service for both AC Transit and WestCAT.
While these two transit providers have specific current branding and significant base ridership, an extended relationship with the community will be cultivated for the expanded express bus service. This plan presents branding options to educate the West Contra Costa community about the ability of the express bus service to meet their individual ridership needs and to teach potential riders how to use the services.
- Enhance the image of transit service. The express bus service will be provided by AC Transit and WestCAT with support from WCCTAC.
Each transit service provider has cultivated a positive reputation through service quality, timing, reliability, and amenities. The marketing and branding recommended in this plan intends to increase visibility of the new and existing express bus services, calling attention to AC Transit’s and WestCAT’s portfolios of services.
- Steer existing transit users to the expanded service. This plan offers strategies to generate interest and increase service awareness among specific potential rider segments that currently use a variety of transit services to commute.
- Encourage new ridership. New transit users will be sought via both community-wide marketing strategies and tactics targeted to potential riders.
The express bus services will represent an expansion of existing express bus services provided by both AC Transit and WestCAT. Therefore, it is critical to market and brand the services consistent with current brands. However, this service will represent new transit connection options that are not currently available to residents. Therefore, widely and effectively distributing information about the new service will be paramount in attracting new riders. The Marketing and Branding Plan identifies roles for both WCCTAC and the transit operators to support the creation of informational and advertising materials. It is anticipated that the responsibility for marketing will largely lie with the transit operators, although WCCTAC will serve a critical coordination role in ensuring a cohesive message for West County residents.
8.2 Messaging
Given the nature of the service, the following benefits should be the core drivers of messaging:
- Expansion of service: The express bus service will be an expansion of existing express bus services offered by AC Transit and WestCAT to bridge gaps in their existing services. For WestCAT, the existing express routes offered through Lynx will now be expanded to include express bus services to northern Alameda County. For AC Transit, existing Transbay routes will be expanded to run express services from Contra
Costa College to Berkeley, Emeryville, and Oakland.
- Reliable and consistent: Riders will be able to rely on everyday service and regular timed arrival to their destination.
- Affordable: The express bus will be priced to be competitive with other travel modes such as driving alone and/or taking BART. It will also curtail costs incurred from expensive parking and be cheaper than the combined total fare charged for riders currently transferring between multiple transit systems.
- Efficient: Express bus service will be direct and fast, improving upon current local and express bus services for the service area.
- Comfortable: The service will allow riders to sit down in a comfortable seat for the duration of the ride, unbothered by traffic. The buses will also offer convenient passenger amenities.
- Relaxation: Riders will be able to reduce daily stress generated by long driving times, hunting for parking, aggressive driving culture, multiple transit transfers, or other transportation stressors. They will have leisure time to read a book, log onto a laptop, catch up on emails, or even take a nap.
- Productive: Riders will be able to multi-task on the trip with free onboard Wi-Fi.
- Sustainable: The use of alternative transportation will decrease the carbon footprint of riders and decrease congestion on major transportation routes.
WestCAT Lynx double-decker bus
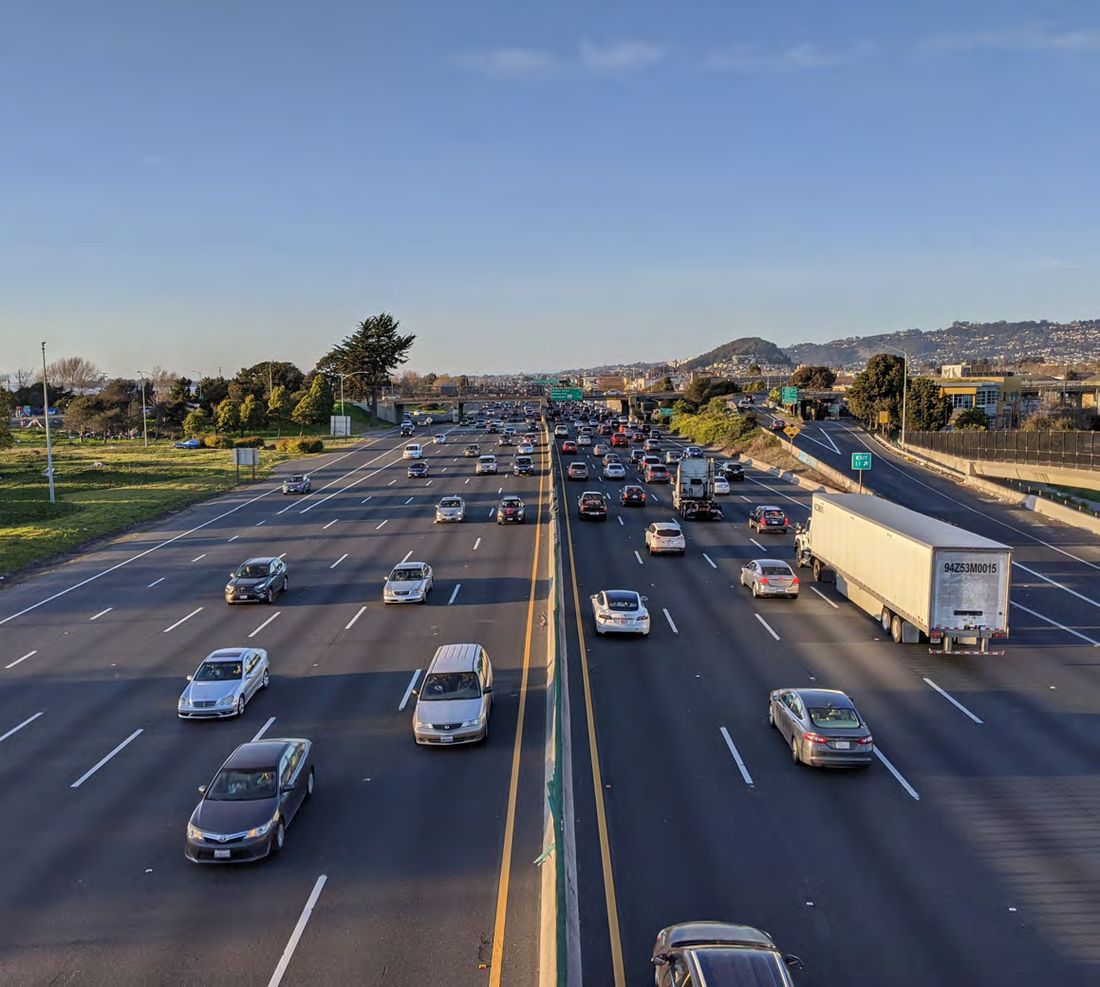
Original PDF, page 62
® ®
WEST CONTRA COSTA COUNTY
EXPRESS BUS IMPLEMENTATION PLAN Final Plan | February 2020
9. PERFORMANCE MONITORING
The implementation of the proposed express services should also include a performance monitoring element to ensure that the routes are operating successfully. While the key measure of success for any transit service is ridership, other factors should also be analyzed as part of a regular performance review.
It is proposed that on a regular basis, consistent with performance monitoring routinely performed by each transit operator for their existing services (no less than annually), each route be evaluated for ridership and operating performance. The regular review could include the following key performance information:
- Daily Boardings (Passengers)
- Boardings by Trip
- Load Factor by Trip
- Revenue Hours of Service
- Boardings (Passengers) per Revenue Hour
- Gross and Net Costs (after fares)
- Title VI-based Equity Analysis
- Farebox Recovery Ratio
- Net Cost per Rider
- Miles per Hour (operating speed)
- On-Time Performance
- Passenger Comments
Three key performance indicators are highlighted below. For the proposed express services, it is suggested that the key ridership standard to evaluate the route performance is Boardings (i.e. passengers) per Trip. For typical local transit service the standard measure would be boardings per hour. This measure reflects the nature of this service whereby passengers continually board and deboard along the entire route. Express services however do not “turn over” ridership. Once the boardings are complete in the residential areas, the passenger load is essentially fixed until the final destinations (employment centers, schools, etc.) are reached. A high-performing route will have a Boarding per Trip close it the vehicles’ passenger capacity.
AC Transit uses a standard of 25 passengers per trip for its Transbay services, which this service is proposed to meet to maintain consistency.
WestCAT aims to maintain or improve on previous year’s performance levels. The service proposed in this Plan should at least meet the WestCAT system’s fixed route performance average. As a reference point, performance on the WestCAT Lynx transbay route was 17.5 passengers/vehicle- revenue-hour in FY18/19, but proposed express bus service should be compared to the WestCAT systemwide fixed route network average.
However, new transit services take some time to become established in the community and reach their full ridership potential. Accordingly, new routes should be given two years to reach the ridership standard presented above. At the one-year review, routes should be performing at 75% of their standard to ensure they are on the path to complete success.
Another key performance indicator to monitor for the express service is Load Factor by Trip. This is the ratio of the numbers of passengers on board the bus to the number of seats. Typically, high-quality, higher-fare express services don’t exceed a load factor of 1.0, which means every passenger has a seat. Since these routes use the freeway for long distances at higher speeds, comfort and safety are critical. In practice, some trips may operate above 1.0, which will also likely generate passenger concerns and the need to adjust service. Adjusting the schedule of the other trips to serve this time frame better or adding another trip if feasible are potential solutions.
Finally, express riders are extremely time sensitive, so it important that the routes operate with a high level of On-Time Performance. AC Transit defines on time performance by one minute early to five minutes late. WestCAT is similar at 0 minutes early to five minutes late. For this service a goal of 85-90% on time is desirable. Since the nature of express bus services is to collect all boardings at the origin-side stops and then all alightings at the destination-side stops, the critical components of on-time performance are somewhat different than for a typical local bus service. On the origin end of each trip (typically home in the morning and the job site in the evening) on-time performance is very important.
Buses should never leave early because departures are relatively infrequent and riders typically aim to board a specific trip. However, on the destination end of each trip, buses arriving early do not cause schedule disruptions because riders are only alighting and not boarding.
The route performance findings should be shared between the operators and with WCCTAC to confirm the optimal distribution of available funds between West County express bus services. Some express routes will have higher ridership and perform better than others. A review of the performance information amongst the three parties will help inform decisions to allocate funding from lower-performing routes to higher- performing routes that require additional resources. The Implementation Plan has identified additional route pairs and operational enhancements (such as mid-day service) that can be considered should the initial set of routes and operating schedule perform above or below standards.
I-80/I-580 South of University Avenue
Original PDF, page 63
® ®
WEST CONTRA COSTA COUNTY
EXPRESS BUS IMPLEMENTATION PLAN Final Plan | February 2020
10. NEXT STEPS
10.1 Project Timeline
The exact time frame for project implementation is not yet known. There is uncertainty around each of the primary project funding sources. However, it is assumed that funding will become available for route implementation in the 2021-2022 fiscal year. Bus acquisition currently takes approximately 18 to 24 months from time of order to receipt of buses in order for the buses to be constructed. Therefore, it is anticipated that the earliest start of service on the highest priority routes could occur would be approximately 2024. Purchases of express buses for proposed service should be coordinated between operators and with any other required express bus purchases in order to reduce the cost per bus to the degree possible.
During the period between the start of funding and the start of service, capital improvement projects should be advanced through the approvals and design process. Projects have only been developed at a conceptual level through this Plan effort. The capital projects will require varying levels of preliminary engineering, environmental clearance, and final design as well as extensive stakeholder coordination. In particular, required capital improvement projects such as bus stops and mobility hubs should be advanced once funding is secured. Some of the optimal capital improvements, such as the transit center expansions, will require a longer project approvals and design process and thus should be advanced as early as possible as funding allows. Project development (environmental clearance, design, and approvals) could range from six months up to three years, depending on complexity and jurisdictions.
10.2 Project Advancement/Policy Development
The Express Bus Implementation Plan identifies a comprehensive set of recommendations, including both operating parameters and capital projects, to expand express bus service in West Contra Costa County. This program of recommendations is comprised of a coordinated set of individual recommendations that need to be implemented in a cohesive manner. It is recommended that WCCTAC assume responsibility for advancing the program as a whole to ensure a well-coordinated and comprehensive implementation that marries capital and operating needs.
As WCCTAC does not have any land use jurisdiction nor does it own or operate any transportation facilities, it will need close cooperation with the transit agencies, Caltrans, the local jurisdictions, and CCTA in order to implement the program.
In order to execute the program, it is recommended that an Express Bus Task Force be formed involving AC Transit, WestCAT, CCTA, Caltrans, MTC, and the local jurisdictions. The Task Force is recommended to meet at least quarterly. Its primary function will be to coordinate project advancement activities amongst the different individual projects, many of which involve multiple agencies. The Task Force will seek to identify and coordinate grant opportunities, which may require different entities to take the lead and multiple letters of support depending on the terms and requirements of each grant. A coordinated effort will also aid in the pursuit of funding by demonstrating regional cooperation and support for the recommended projects, often a key factor in grant evaluation.
WCCTAC should coordinate with Alameda County Transportation Commission and Alameda County jurisdictions for the implementation of recommendations in Alameda County. This should include issuing formal letters and meetings at the staff, executive, and elected levels, as appropriate.
Several aspects of project funding and implementation will require regional or state evaluation or approval. Therefore, it is recommended that elected officials in the West County area (and other jurisdictions benefitting from the program) advocate for the project by emphasizing the project need and benefits. Areas of advocacy include:
- At the regional level for allocation of RM3 express bus operations funds to program needs
- At the regional and state level for prioritization of Caltrans-involved projects
- At the state level for legislation to facilitate part-time transit lanes operation
- At the regional and state level for grant funds, such as SB1 Congested Corridors and other programs
A critical follow-on step to this Plan is for local jurisdictions and regional entities to incorporate recommendations into future planning efforts.
This will unlock the projects for various grant and regional funding opportunities. Examples include:
- General Plan Updates (local jurisdictions)
- Specific Plans (local jurisdictions)
- Traffic Impact Fee Programs, including both the Subregional Transportation Mitigation Program (STMP) Impact Fee and local City programs (WCCTAC and local jurisdictions)
- Countywide Transportation Plan (CCTA)
- Short-Range (and Long-Range) Transit Plan (transit agencies)
- West County Action Plan (WCCTAC/CCTA)
- Bicycle and Pedestrian Plans (CCTAC and local jurisdictions)
- Corridor Plans (MTC/CCTA)
10.3 Funding Sources
As of the time of this Plan’s writing, Regional Measure 3 is the subject of legal challenge and, while the increased bridge tolls are currently being collected, they are being held in escrow and are not yet able to be distributed. As described in Chapter 7, RM3 funds are critical to ongoing operations funding of proposed express routes. Until the legal challenges has been settled in favor of MTC, the express bus routes proposed in this Plan may not be able to be implemented. RM3 includes an allotment of funds for express bus operation. The calculation that will determine the regional distribution of these funds is not yet known. WCCTAC and the proposed operators should continue to coordinate with MTC to ensure that the proposed routes are best qualified for the anticipated funds.
Another key part of Financial Plan described in Chapter 7 will be capital funding from the CCTA 2020 TEP. The TEP will be subject to voter approval in March 2020. If the sales tax measure passes, then CCTA will undertake a transit planning process that will further detail how the funds will be distributed. The TEP requires that CCTA complete an Integrated Transit Plan (ITP) to achieve a vision of regional coordination of transit services. It is anticipated that the recommendations generated in this Plan will be beneficial in formulating the ITP. WCCTAC and the operators should ensure that the ITP is prepared consistent with the recommendations of this Plan. WCCTAC and the operators should continue to coordinate with CCTA on the timing and mechanism for fund distribution to ensure that funds are available when needed for express bus service and supporting capital improvement projects.
Funding identified from RM3 and the TEP is anticipated to only be sufficient to implement the highest priority routes. Additional funding through regional and state programs should be pursued for the subsequent implementation of additional routes identified in this Plan.
10.4 Advancement of Capital Projects
Mobility Hub Ownership and Operation
An unresolved question at the time of this Plan’s writing is what entity will own and/or operate the mobility hubs proposed in Chapter 6.5. Historically Caltrans has operated park and ride facilities in their rights-of-way adjacent to freeway interchanges. However, in recent years Caltrans has expressed reluctance to establish and operate new such facilities. Other entities that might operate such mobility hubs include the municipalities in which they would be located, the transit operators, WCCTAC, CCTA, or MTC. Coordination will these entities will be required to implement and operate the proposed mobility hubs.
As part of the MTC project Bay Bridge Forward, several new park and ride facilities will open in 2020: two in Oakland under I-580 and another in Albany under I-80. A similar ongoing project for the Richmond-San Rafael Bridge may include the development of additional park and ride or mobility hub facilities adjacent to I-580 to accompany the provision of an HOV lane along I-580. The mobility hub proposed on Wright Avenue (MH5) may be aligned with this project. WCCTAC and AC Transit should continue to coordinate with MTC on future expansion of the park and program, including consideration of the mobility hub at Wright Avenue.
Original PDF, page 64
® ®
WEST CONTRA COSTA COUNTY
EXPRESS BUS IMPLEMENTATION PLAN Final Plan | February 2020 Regardless of the entity ultimately selected to own and/or operate of the proposed mobility hubs, the mobility hub development and transit center expansion will require coordination with the following entities:
- Tara Hills Avenue Mobility Hub (MH1, MH2)
- Contra Costa County (jurisdiction)
- CCTA
- San Pablo Dam Road Mobility Hub (MH3)
- Caltrans (landowner)
- City of San Pablo (jurisdiction)
- CCTA
- Bissell Avenue Mobility Hub (MH4)
- City of Richmond (jurisdiction)
- Contra Costa County (landowner)
- CCTA
- Wright Avenue Mobility Hub (MH5)
- Caltrans (landowner)
- City of Richmond (jurisdiction)
- Hercules Transit Center (TC1)
- BART (landowner)
- City of Hercules (jurisdiction, currently responsible for maintenance)
- WestCAT (MOU partner)
- Richmond Parkway Transit Center (TC2)
- AC Transit (operator)
- Caltrans (landowner)
- City of Richmond (jurisdiction)
As part of this project, the project team met with many of the entities identified above to review the project recommendations. Additional effort is still needed in order to secure the identified property and advance mobility hub planning. WCCTAC should provide a formal letter of interest to the property owner and/or jurisdiction to continue the dialogue. If any of the jurisdictions embark on a General Plan or Specific Plan process, then WCCTAC should coordinate with the jurisdiction to ensure that the mobility hubs are identified and recommended within the land use and/or circulation components of those efforts.
In addition, WCCTAC should work with potential owners and operators to identify an acquisition process, identify MOU parties and requirements, and refine project descriptions. Once ownership and operations roles are defined, WCCTAC and/or the owner and operator should coordinate with public and private entities to program the mobility hub features to be included in each site.
Bus Acquisition
Additional buses will need to be acquired for operation of the proposed express routes. These buses will need to be purchased from bus manufacturers by AC Transit and WestCAT. It is anticipated that this purchase will be completed through typical bus acquisition processes currently used by each transit agency. Additionally, the acquisition of buses will require the transit agencies to ensure space for the new buses in existing maintenance yards and incorporate new buses into maintenance plans. WestCAT’s storage and maintenance needs are expected to be met with the obligation identified in RM3, but the resolution of AC Transit’s needs are not yet known. AC Transit will need to further define modifications to their fleet assignments and potentially further explore storage and maintenance capacity enhancements in order to provide storage and maintenance space for the buses required to implement the service included in this Plan.
Freeway Access Improvements and Part-Time Transit Lanes
This Plan recommends several treatments to reduce transit travel time and improve bus reliability on the state highway system or on facilities used to access the state highway system. These improvements include part-time transit lanes (bus on shoulder operations), transit signal priority, restriping, and new HOV lanes. This will require coordination with Caltrans and the local jurisdictions to implement traffic studies, acquire adjacent right-of-way (if necessary), pursue funding opportunities, and take other necessary steps.
Part-time transit lanes running on a freeway shoulder is still a new treatment in California. However, CCTA is currently pursuing a pilot project on I-680 to allow express buses to operate on the shoulder. WCCTAC and the transit operators should continue to coordinate with CCTA and MTC on the proposed pilot program to determine an appropriate process and necessary measures to implement part-time transit lanes on I-80. This will require further coordination with Caltrans and the California Highway Patrol. The Federal Highway Administration will be required to approve the part-time transit lane Concept of Operations as well since I-80 is part of the federal highway system. Part-time transit lanes on I-80 may be able to leverage agreements and procedures developed through CCTA’s I-680 project. However, different approaches may be considered given the much shorter length of the proposed bus on shoulder operation on I-80, the much greater bus frequency, and consideration of the ultimate desire for a full-time (non-pilot) approval. Therefore, it is recommended that WCCTAC continue to consult with CCTA to stay apprised of the I-680 project and opportunities to advance the I-80 recommendation.
There are several pathways to advance the transit priority projects associated with the I-80 corridor. MTC may advance an I-80 corridor study in the coming years that could enhance the competitiveness of these projects for additional funding, such as SB1 Congested corridors, as well as consolidate project coordination with Caltrans. If that were to advance, WCCTAC and CCTA should coordinate with MTC to ensure that the corridor study considers the recommendations from this Plan.
Once funding for further project advancement is secured, WCCTAC should coordinate with CCTA and Caltrans on an MOU for the Caltrans- related projects. That discussion will inform whether multiple of the Caltrans facility improvements would be consolidated in one project or separated into multiple. Projects in Caltrans right-of-way under $3 Million in capital cost (such as project FA2) can proceed through the streamlined Project Engineering Evaluation Report (PEER) process, which commonly achieves approval in roughly six months to 1 year.
Projects exceeding that amount are subject to greater oversight, such as a Project Study Report - Product Development Support (PSR/PDS), which can take up to three years. WCCTAC, CCTA, Caltrans, and the local jurisdictions should coordinate to determine the optimal packaging of improvements to facilitate efficient project implementation. Several of the proposed projects (such as the bus stops and potentially FA2) are small enough that may be achievable through an encroachment permit led by the local jurisdiction. It is recommended that WCCTAC further coordinate with the local jurisdictions, Caltrans, and CCTA once funding is secured to advance the projects through the Caltrans approval, environmental clearance, and design process. Further studies will be needed to advance these projects, including traffic analyses, environmental analyses, and Concept of Operations. The Caltrans process can be further defined through the MOU development process as it could range from an encroachment permit for standalone arterial projects to a Project Study Report/Project Report for more significant modifications. The type of process will dictate the specific technical analyses needed to advance the capital projects.
If the jurisdictions within which arterial improvements are identified embark on any circulation planning or traffic impact fee process, then WCCTAC should coordinate with those jurisdictions to ensure that the proposed recommendations are included. Those efforts may also be leveraged to facilitate the environmental clearance of the proposed projects.
The improvements near San Pablo Dam Road (both the mobility hub, project MH3, and the freeway access enhancements, project FA3) should be coordinated with CCTA and Caltrans’ interchange improvement project. WCCTAC should formally request inclusion of those project recommendations in the interchange project. The improvements in Hercules at the SR-4/I-80 interchange (project FA1) reflect minor modifications to a project included in the Hercules Traffic Impact Fee Program. WCCTAC should coordinate with the City of Hercules to refine the project description in the fee program and determine available funds to implement the project as soon as feasible, as that would not only benefit routes proposed as part of this Plan but also existing routes. The improvements at Ashby Avenue (project FA4) should be coordinated
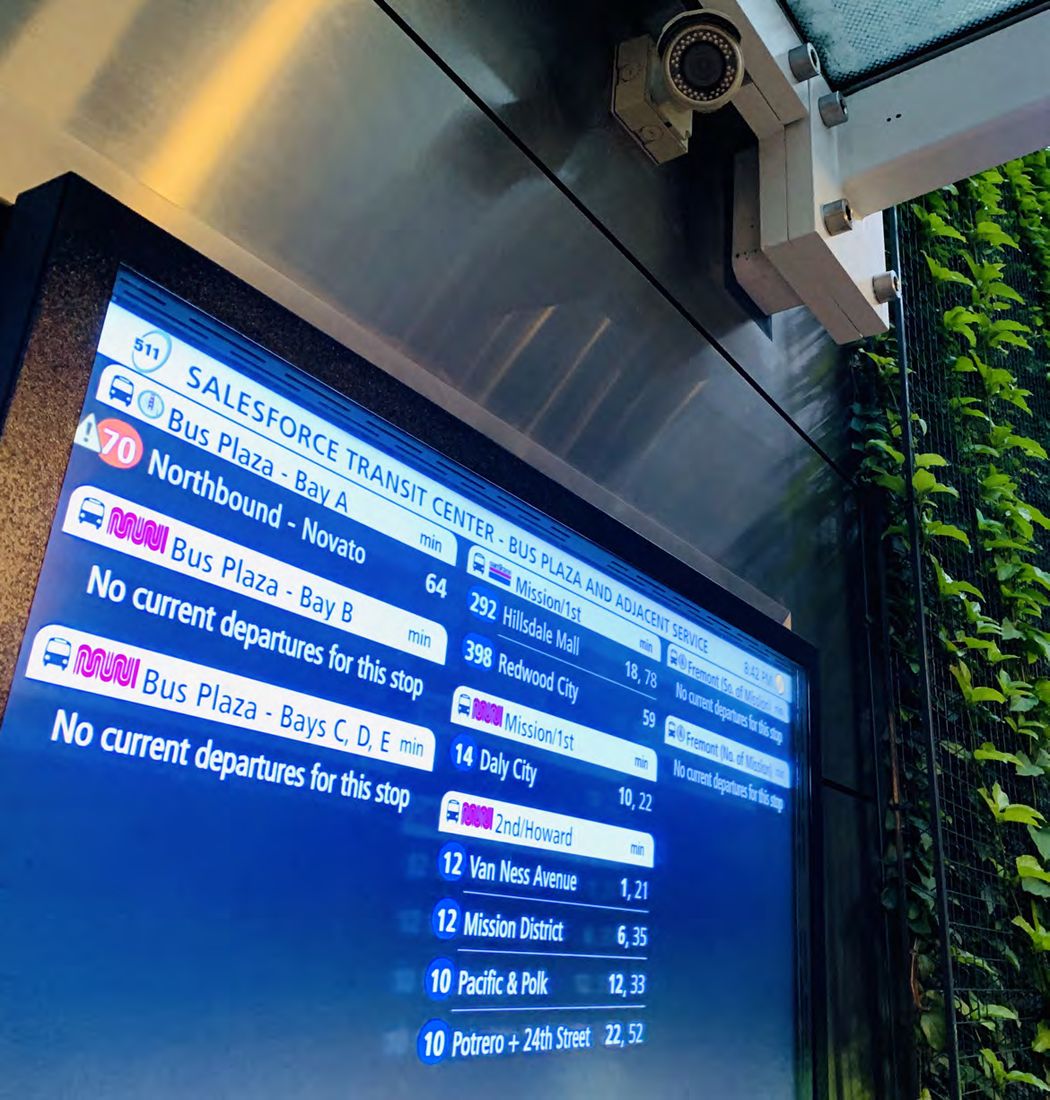
Original PDF, page 65
® ®
WEST CONTRA COSTA COUNTY
EXPRESS BUS IMPLEMENTATION PLAN Final Plan | February 2020 with Alameda County Transportation Commission, Caltrans, and the Cities of Berkeley and Emeryville, who are all partnering on an interchange improvement project that is currently in the Project Approval and Environmental Document Phase, which includes selection of a preferred alternative. A formal request for inclusion of transit priority treatments may be beneficial in advancing that recommendation.
10.5 Preparation for Route Implementation
In order to successfully implement this service once the capital needs have been addressed, several steps are needed. AC Transit and WestCAT should incorporate express service into baseline service plans. Specific route schedules will need to be developed, costed out and the request for RM3 funds for operations coordinated between the operators, WCCTAC, and MTC. Fares and transfer policies, while presented here as recommendations, will need to be finalized. A Title VI service and fare equity analysis will need to be separately completed by each the operators, to verify that the new service meets Civil Rights Act statutes. Bus stops will need to be implemented in some locations. It is likely that since this is new service, that each operator will need their Board approval of the service plan, schedule, fares and Title VI analysis. Marketing and branding materials should be developed and distributed to build awareness. WCCTAC, the transit agencies, and the local jurisdictions should continue to engage with large employers in the service area to ensure that employees are aware of the express routes’ implementation and coordinate travel demand management programs that would benefit ridership.
In the same set
The original file
Everything above is the content of the original document, published here as a web page so it can be read, searched, translated and used with a screen reader. The original PDF is kept as the authoritative record.