

West Contra Costa Transportation Commission
High-Capacity Transit Study — final report
What a step change in transit capacity through the West County corridor would take, what it would deliver, and for whom.
Study · Final · 2017 · 30 figures · about 78 min to read
What a step change in transit capacity through the West County corridor would take, what it would deliver, and for whom.
Current — In force. This is the version to rely on. The adopted final version.
West Contra Costa
High-Capacity Transit Study
Final Report
May 2017
| | About WCCTAC |
|---|---|
| WCCTAC is responsible for transportation planning for the West County sub- region and one of four regional transportation planning committees in Contra Costa County, representing the West Contra Costa sub-area. These four committees were created in 1988 to guide transportation projects and programs included in the Measure C half-cent, transportation sales tax approved by Contra Costa voters. Measure C was succeeded by Measure J in 2004. |
| | Technical Memoranda |
|---|---|
| The results of the initial review of previous studies and all of the analyses conducted for the study are documented in a series of Technical Memoranda (see a full listing at the end of this report). The Technical Memoranda can also be accessed on the study website (westcountytransitstudy.com) or the WCCTAC website (wcctac.org). |
WEST COUNTY HIGH-CAPACITY TRANSIT STUDY | MAY 2017 OUTREACH TRANSIT MARKET ALTERNATIVES MOVING FORWARD BACKGROUND EXECUTIVE SUMMARY ACRONYMS
1.0 Executive Summary
2.0 Background
2.1 Study Purpose
2.2 Study Process
3.0 Outreach
3.1 WCCTAC Board
3.2 Advisory Groups
3.3 Telephone Town Hall
3.4 Public Workshops and Survey #1
3.5 Council Presentations and Survey #2
4.0 West County Transit Market
4.1 How Do West County Residents Get Around?
4.2 What are the Trip Patterns in West County?
4.3 Can Trips in West County be Well Served by Transit?
5.0 Alternatives Development
5.1 Initial Alternatives
5.2 Refined Alternatives
6.0 Moving Forward
6.1 What Have We Learned from this Study?
6.2 What Will It Take to Advance the Projects?
6.3 What is the Funding Strategy?
WEST COUNTY HIGH-CAPACITY TRANSIT STUDY | MAY 2017 OUTREACH TRANSIT MARKET ALTERNATIVES MOVING FORWARD BACKGROUND EXECUTIVE SUMMARY ACRONYMS
Acronyms
AC Transit Alameda-Contra Costa Transit District ABAG Association of Bay Area Governments BART San Francisco Bay Area Rapid Transit District BNSF Burlington Northern Santa Fe Railway BRT Bus rapid transit Caltrans California Department of Transportation CCTA Contra Costa Transportation Authority CIG Capital Investment Grants DMU Diesel multiple unit FTA Federal Transit Administration HCT High-capacity transit I-580 Interstate 580 I-80 Interstate 80 IFD Increment Financing Districts MTC Metropolitan Transportation Commission O & M Operations and maintenance PDA Priority development area RDA Redevelopment agency RITC Regional Intermodal Transit Center ROW Right-of-way SR 4 State Route 4 TIGER Transportation Investment Generating Economic Return TIF Tax Increment Financing TSI Transit Suitability Index UZA Urbanized Area UPRR Union Pacific Railroad VHT Vehicle hours traveled VMT Vehicle miles traveled WCCTAC West Contra Costa Transportation Advisory Committee WestCAT Western Contra Costa Transit Authority Transit Service
Original PDF, page 5
| LTERNATIVE Alt 1: Express Bus on I-80 Alt 2: San Pablo / Macdonald BRT | YES | NO |
|---|---|---|
| Alt 3: 23rd Street BRT Alt 4: UPRR Commuter Rail (short + Mid-Range Options) | ||
| Alt 5: BNSF Commuter Rail | ||
| Alt 6: BART Extension from Richmond | ||
| Alt 7A: BART Extension from El Cerrito del Norte | ||
| Alt 7B: BART DMU Extension from El Cerrito del Norte |
WEST COUNTY HIGH-CAPACITY TRANSIT STUDY | MAY 2017 OUTREACH TRANSIT MARKET ALTERNATIVES MOVING FORWARD BACKGROUND EXECUTIVE SUMMARY ACRONYMS The West Contra Costa Transportation Advisory Committee (WCCTAC) initiated the High-Capacity Transit Study to evaluate multimodal high-capacity transit (HCT) options that would enhance transit connectivity and accessibility in West County and to plan for future growth. At the outset of the study, the WCCTAC Board adopted a set of goals and objectives to frame the development of alternatives. The goals and objectives focused on improving the frequency, reliability, and equity of transit services; protecting and enhancing the environment; ensuring the efficient use of public funds; and creating more sustainable communities.
The study builds upon findings from prior studies, but was the first study to consider a multi-modal approach to transit improvements in West County.
Early study efforts also included an assessment of travel markets and focused the range of alternatives on providing better service to two primary markets—travelers on the I-80 corridor and travelers on the major north-south spine (including San Pablo Avenue and Richmond Parkway) within West County.
From the outset, WCCTAC has been committed to a comprehensive outreach effort, inviting input from cities, transit agencies, and other key stakeholders as well as the general public. Outreach efforts included a telephone town hall, public workshops, surveys, and presentations to city councils. The WCCTAC Board has been actively engaged throughout the process providing critical feedback on its vision for transit in West County.
The study began with a broad array of alternatives and eight were selected for analysis. Following the initial assessment, the WCCTAC Board voted to carry five alternatives forward for further refinement and evaluation (see Figure 1-1). Of the five alternatives that were initially advanced, the BART to Richmond alternative was further refined and generated two routing alternatives.
These five alternatives reflect improvements to the existing bus and rail transit systems that provide service to West County and would enhance transit connectivity and capacity over time as new services, such as ferries, come on line. These form the basis for a transit network that would respond to the increasing demand for transit services and a system that could integrate with land use plans for the local communities.
Addressing West County’s transportation issues will not be accomplished with one idea, one mode, one plan, or one agency. This is an inter-regional and intra-county problem that needs a set of viable, fundable alternatives to create a robust high-capacity transit network.
As residents, workers, and visitors feel the traffic pinch today, and will likely continue to do more so as the area experiences growth; both short- and long-term options are needed to address the problem.
This Final Report synthesizes the results of the technical memorandums and the public outreach efforts. It is intended to serve as a resource for elected officials and staff in West County to assist them in determining which projects should move forward into project development and to develop funding strategies for their implementation. It provides information on ridership and costs, in addition to outlining a set of next steps for each of the alternatives. It also provides an implementation strategy that allows for incremental improvement of transit over time as demand grows, as well as providing some short-term relief for congestion.
Executive Summary
Why do we need this
study?
I-80 is one of the most congested corridors in the Bay Area, and the Richmond BART line often reaches full capacity during commute hours. Expanding transit capacity and service would provide more travel options for West County residents within the county and to other parts of the Bay Area.
Figure 1-1: Alternatives Advanced for Further Study based on Board Action Source: WSP | Parsons Brinckerhoff WHAT IS HIGH-CAPACITY TRANSIT?
High-capacity transit provides substantially higher levels of passenger capacity with typically fewer stops and higher speeds than local bus service.
Original PDF, page 6
WEST COUNTY HIGH-CAPACITY TRANSIT STUDY | MAY 2017 OUTREACH TRANSIT MARKET ALTERNATIVES MOVING FORWARD BACKGROUND EXECUTIVE SUMMARY ACRONYMS West Contra Costa County is a diverse, dynamic region within the San Francisco Bay Area that fronts the San Francisco and San Pablo Bays and the Carquinez Strait. Much of West County is characterized by its historical and continued concentration of waterfront industries, presently dominated by oil refining and shipping. Over the past century dense older urban communities, such as downtown Richmond and El Cerrito, and newer more suburban communities have developed in the area, attracted by the local employment opportunities and the relatively easy commuting to other parts of the Bay Area. In recent years, the older suburban development has been augmented with new residential and commercial development that takes advantage of vacant and underutilized sites and is fueled by the increasing demand for higher-density development. The area is projected to grow in the next decades, with population projected to increase by 29 percent (73,560 additional people) and jobs to increase by 36 percent (22,630 additional jobs) between 2010 and 2040.1 The Study Area includes I-80, I-580, and State Route 4 (SR 4) as well as major surface streets, including San Pablo Avenue and Richmond Parkway (see Figure 2-1). The area holds key transportation routes for the region and the state. I-80 runs the full length of West County, north to south, and is part of the interstate freeway system that connects the Bay Area to the Sacramento region, the Lake Tahoe recreational area, and Reno, Nevada in the north and to Highway 101 and the California Central Coast in the south. I-80 is the primary vehicular route running north-south through this sub-region;
therefore it has regional significance to Bay Area travelers. This section of I-80 is frequently one of the most congested freeway corridors in the region.2 As a result of this routine congestion, drivers often divert to other major north- south arterials to avoid delays on the freeway. The primary north-south arterial is San Pablo Avenue, which is the old U.S. Route 40. It is a major commercial arterial for the sub-region and links each jurisdiction in West County. I-580, which runs perpendicular to I-80, connects West County to Marin County via the Richmond- San Rafael Bridge and continues south along I-80 to Oakland. SR 4 provides a primary connection to Martinez, Concord and Antioch in East Contra Costa County.
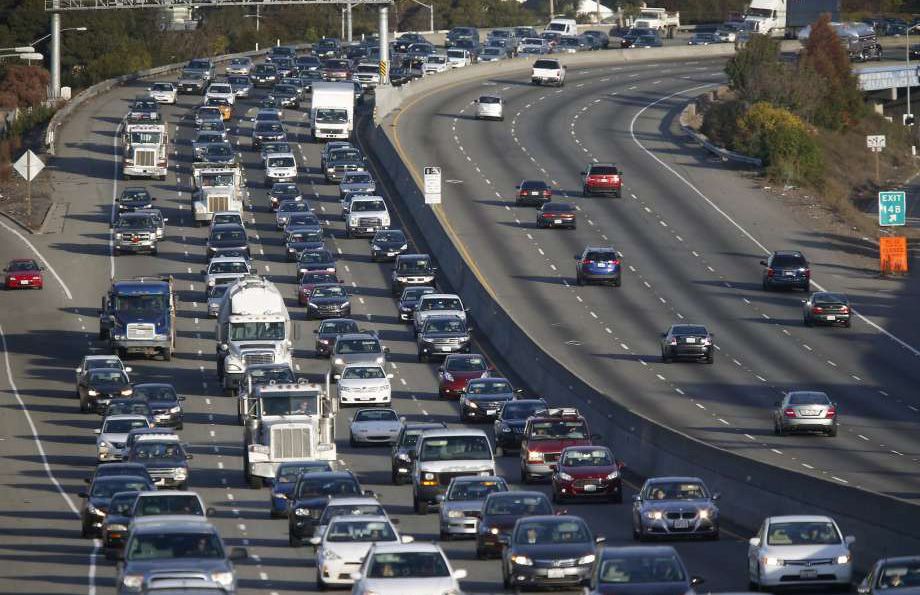
Traffic on I-80 is severely congested during peak commuter hours, as well as during off-peak hours and weekends when it is congested in both directions.
With population growth of 29 percent and job growth of 36 percent expected by 2040 in the study area, West County is also projected to have an accompanying rise in traffic (see Figure 2-2). Preliminary estimates indicate that vehicle trips on the I-80 corridor are expected to increase by approximately 23 percent by 2040 in the peak commute period.3 In West County overall, VMT in the peak commute period is expected to increase 27% by 20404 (see Figure 2-3). This will mean greater delays on the freeway and an increasing need to provide viable travel alternatives for people living and working in West County.
Background
SAN FRANCISCOVALLEJO CONTRA COSTA COUNTY ALAMEDA COUNTY RICHMOND SAN PABLO EL SOBRANTE EL CERRITO PINOLE HERCULES RODEO CROCKETT MARTINEZ SAN P A B LO A VE RICHMOND P K W Y S AN P A B O DA R COUNTY LINE CAPITOL CORRIDOR/ AMTRAK BART FERRY ROUTES STATIONS STUDY AREA MAP KEY MILE N Figure 2-1: Study Area Source: WSP | Parsons Brinckerhoff Jobs Population 250,900 324,500 +29% Growth 62,600 85,200 +36% Growth Figure 2-2: Projected Growth in Population and Jobs in West County Source: ABAG Projections 2013, EPS VMT 1,423,200 1,805,600 +27% Growth Figure 2-3: Projected VMT in West County Source: ABAG Projections 2013, EPS
Original PDF, page 7
WEST COUNTY HIGH-CAPACITY TRANSIT STUDY | MAY 2017 OUTREACH TRANSIT MARKET ALTERNATIVES MOVING FORWARD EXECUTIVE SUMMARY ACRONYMS Transit options for West County are somewhat disparate. The southern part of the West County study area is served by a diverse set of transit modes: rail service provided by Capitol Corridor and the San Francisco Bay Area Rapid Transit District (BART), and local, rapid and express bus service operated by the Alameda-Contra Costa Transit District (AC Transit) and the Western Contra Costa Transit Authority Transit Service (WestCAT), which provides express bus service to the El Cerrito Del Norte BART station. Ferry service between Richmond and San Francisco will begin in 2018. By contrast, transit service in the northern part of the West County study area is more limited, with local and express bus service provided by AC Transit and WestCAT. Future expansion of regional rail service (a new station) and ferry service to San Francisco are proposed at the Regional Intermodal Transit Center (RITC) in Hercules.
This above list of transit options implies a relatively large menu of choices for travelers, although the transit modes face their own particular set of challenges:
■ ■BART is a regional heavy rail system with stops in the southern part of West County in El Cerrito and Richmond. The BART system is currently beset by capacity issues, with trains and stations that are uncomfortably crowded, particularly during commute periods. BART is reviewing options to update its train control system, which is nearly a half-century old and is experiencing problems that have led to reduced service reliability. In addition to modernizing the train control system, BART is acquiring new railcars, upgrading the Hayward maintenance complex, reviewing options for a second Transbay Tube and station improvements to the Embarcadero and Montgomery Street Stations in downtown San Francisco to increase its core capacity and relieve system bottlenecks.5 ■ ■AC Transit and WestCAT provide relatively comprehensive regional and intra-county bus service, with the highest level of service in the densest parts of West County. Unfortunately, the buses are caught in congestion on both freeways and local streets.
Given limited transit priority treatments, buses experience reduced reliability and travel speeds. In addition, current stops and stations lack basic passenger amenities such as bus shelters, arrival time displays, etc.
■ ■Existing Capitol Corridor service is focused on providing commuter service to the Bay Area from Solano, Yolo, and Sacramento Counties in the north and provides only one stop in West County (Richmond), where connections are available to BART and local bus transit.
The limited market for this rail service, combined with limited stops and high fares, result in relatively low ridership compared to other transit services in West County.
In addition, adding transit service is challenging given the study area’s unique topography, which includes rolling hills, steep vertical grades, soil stability, the Hayward Fault Zone, and having to navigate through existing freeway infrastructure.
Addressing West County’s transportation issues will not be accomplished with one idea, one mode, one plan, or one agency. This is an inter-regional and intra-county problem that needs a set of viable, fundable alternatives to create a robust high-capacity transit network. The congestion experienced by residents and employees is not only a result of trips to and from West County, but also travelers passing through to other destinations in the Bay Area and the state, as I-80 serves both an interstate and intrastate travel market. As residents, workers, and visitors feel the traffic pinch today, and will likely continue to do so as the area experiences growth, both short- and long-term options are available.
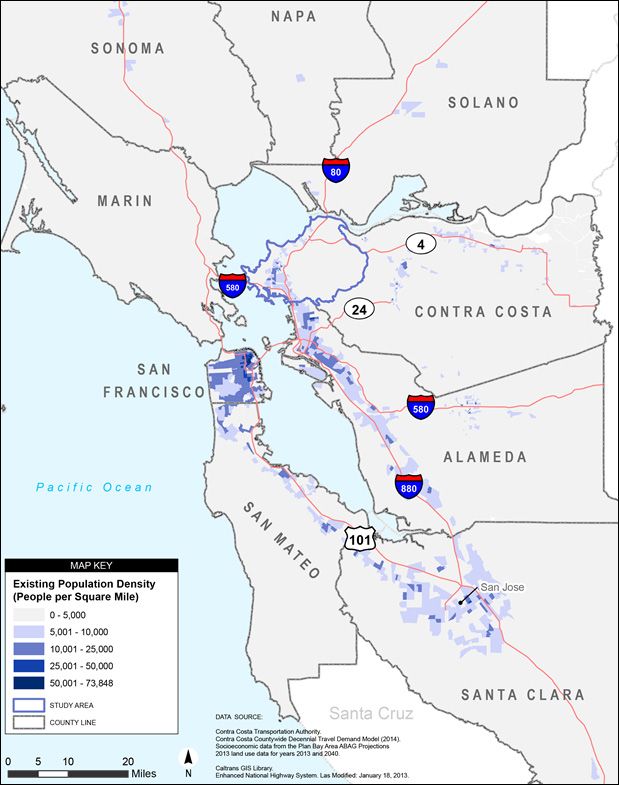
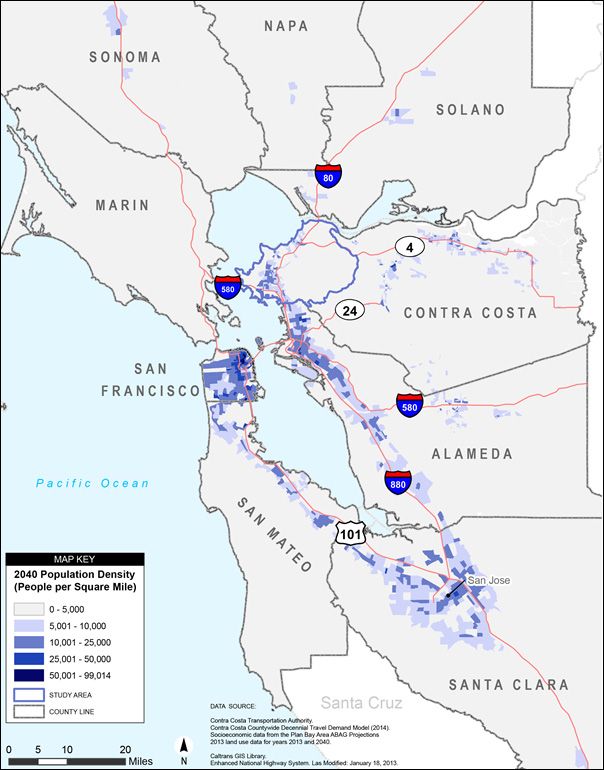
Improvements in the near-term will help to alleviate some of the immediate capacity issues, but a long-term strategy for West County that plans for the anticipated growth in West County and the rest of the Bay Area and integrates transit investments with future land use plans could yield the greatest results (see Figure 2-4 and Figure 2-5). As demand and land-use changes occur in West County, local jurisdictions have the opportunity to transition to more sustainable communities that provide greater travel options.
Source: “Bay Area’s Worst Commute is WB I-80”, San Francisco Chronicle BACKGROUND
Original PDF, page 8
WEST COUNTY HIGH-CAPACITY TRANSIT STUDY | MAY 2017 OUTREACH TRANSIT MARKET ALTERNATIVES MOVING FORWARD EXECUTIVE SUMMARY ACRONYMS Figure 2-4: Existing Population Density in the Bay Area’s Nine Counties Source: WSP | Parsons Brinckerhoff Source: WSP | Parsons Brinckerhoff Figure 2-5: Future (2040) Population Density in the Bay Area’s Nine Counties BACKGROUND
Original PDF, page 9
| | Study's Goals and Objectives |
|---|---|
| These goals and objectives serve as the framework for the study’s development and evaluation of long-term high-capacity transit improvements. GOAL 1: INCREASE TRANSIT RIDERSHIP BY PROVIDING EFFICIENT, FREQUENT, AND RELIABLE SERVICE Objective 1A Improve high-capacity transit service, travel times, and connections. Objective 1B Improve access to existing and proposed transit hubs by all modes of transportation and increase the total number of trips taken by transit. GOAL 2: IMPROVE CONNECTIONS BETWEEN TRANSIT SYSTEMS AND SERVICES Objective 2A Connect communities in the corridor to the regional transit network and other regional centers. Objective 2B Provide user-friendly connections between regional and local transit services. GOAL 3: EXPAND TRANSIT IN COMPETITIVE CORRIDORS TO NEW AND UNDERSERVED TRAVEL MARKETS Objective 3A Identify opportunities to match transit improvements with unmet and anticipated future needs in local, regional, and inter-regional markets. GOAL 4: PROTECT AND ENHANCE THE ENVIRONMENT AND MAINTAIN A HIGH QUALITY OF LIFE Objective 4A Avoid impacts to existing natural and cultural resources in the corridor. Objective 4B Improve air quality and decrease greenhouse gas emissions by reducing reliance on single-occupant vehicles. Objective 4C Reduce transportation energy demand (per vehicle mile of travel) by increasing the use of high-capacity transit. Objective 4D Take into account risks related to sea level rise and the effects of climate change in the location and design of transit facilities. Objective 4E Be consistent with local plans and policies. GOAL 5: SUPPORT SUSTAINABLE URBAN GROWTH Objective 5A Support economic and transit-oriented development in the corridor to advance the regional Sustainable Communities Strategies and Priority Development Area policies that support them. Objective 5B Support development of compact, mixed-use, and sustainable communities that can be served effectively by transit. GOAL 6: PROVIDE EQUITABLE ACCESS FOR RESIDENTS AND BUSINESSES Objective 6A Improve transit access to jobs, housing, education, and other regional resources for a broad cross-section of socio-economic groups, ethnicities, and household types, especially for transit-dependent populations. Objective 6B Preserve mobility of people and goods throughout the corridor. GOAL 7: MAKE EFFICIENT USE OF PUBLIC FINANCIAL RESOURCES Objective 7A Identify high-capacity transit investments that are cost-effective. Objective 7B Seek public input on proposed transit investments. |
WEST COUNTY HIGH-CAPACITY TRANSIT STUDY | MAY 2017 OUTREACH TRANSIT MARKET ALTERNATIVES MOVING FORWARD EXECUTIVE SUMMARY ACRONYMS
2.1 Study Purpose
WCCTAC initiated the West Contra Costa High-Capacity Transit Study to evaluate options for expanding transit capacity and creating a stronger transit network. The results of the study are intended to serve as a resource for WCCTAC, the cities, the county, and transit agencies to determine which projects should be advanced for further study, with consideration given to costs, funding opportunities, and consistency with local plans and policies.
This study identifies and evaluates the feasibility and effectiveness of HCT options in West County. It provides WCCTAC with the information necessary to determine and advance the most promising HCT alternatives to benefit a wide range of people and trip types in West County. The investment strategy outlined by this study aims to provide a framework for WCCTAC and local stakeholders to better position projects for transportation funding and to leverage outside funding sources.
BACKGROUND
Original PDF, page 10
WEST COUNTY HIGH-CAPACITY TRANSIT STUDY | MAY 2017 OUTREACH TRANSIT MARKET ALTERNATIVES MOVING FORWARD EXECUTIVE SUMMARY ACRONYMS
2.2 Study Process
This High-Capacity Transit Study builds upon findings from prior studies, including a review of existing and future land use and transportation conditions in West County and a market analysis to determine key travel markets in West County—in other words, where transit would be a viable transportation choice for travelers.6,7,8 References are provided within the document to relevant Technical Memoranda where more specific information can be found.
WCCTAC conducted an initial review of a variety of modes and alignments for high-capacity transit service. Ferry and light rail options, and diesel motorized units (DMUs) were considered in the early stage before narrowing to eight initial conceptual alternatives. These alternatives include express bus, Bus Rapid Transit (BRT), commuter rail, and BART options. These alternatives were structured to serve the key travel markets in West County, providing alternatives to driving on I-80 and transit options for getting around and within West County.9 The alternatives were evaluated against screening criteria developed from the study’s goals and objectives.10 These goals and objectives serve as the framework for the development and evaluation of long-term HCT improvements.
Preliminary capital cost estimates were prepared to provide a relative cost comparison of how much it would cost to build each of the eight initial alternatives.11 This information was presented to the Study Management Group for the High-Capacity Transit Study, the WCCTAC Technical Advisory Committee, and at community open houses in the spring of 2016. Information about the study was posted on the study’s website and on-line surveys solicited public input on the transit options.
The WCCTAC Board advanced five of the eight initial alternatives for further refinement and evaluation, based on findings from all previous analyses conducted, including the review of prior studies, evaluation against a set of screening criteria, and the market analysis. Of the five alternatives that were initially advanced, the BART to Richmond alternative was further refined and generated two routing alternatives, resulting in a total of five final alternatives reviewed. Once the five alternatives were identified, the study team refined capital cost estimates and concluded ridership model forecasting to estimate how many people would use these alternatives in 2020 and 2040.
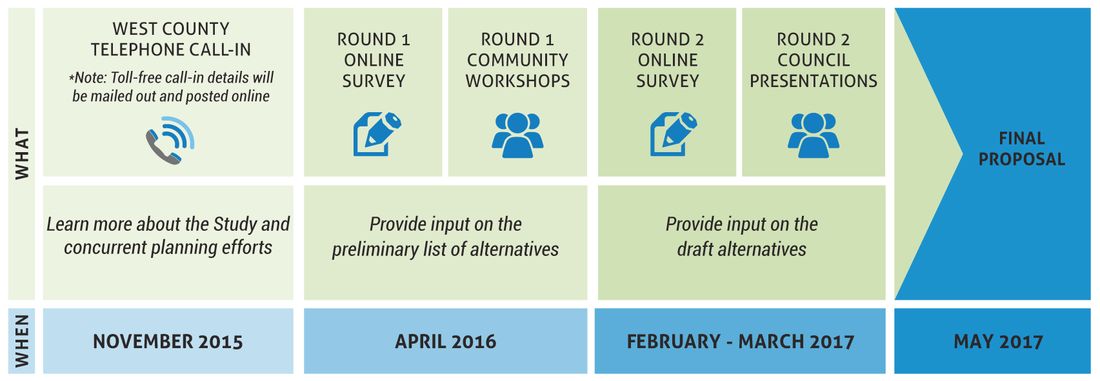
A funding strategy for each of the alternatives was developed, and an additional evaluation step was undertaken to provide a basis for comparing the benefits and costs of the proposed alternatives. Prior to development of this Final Report, presentations were made to the five city councils—El Cerrito, Richmond, San Pablo, Pinole, and Hercules—and to the El Sobrante Municipal Advisory Council to receive additional input. Figure 2-6 summarizes the High-Capacity Transit Study process.
ASSESSMENT
- Goals and Objectives
- Relevant Prior Studies
- Existing/Future Transportation and Land Use
- Market Analysis
FINAL ALTERNATIVES
- Funding Options
- Final Alternatives Evaluation
ALTERNATIVES DEVELOPMENT +
ANALYSIS
- Conceptual Alternatives
- Evaluation Criteria
- Preliminary Evaluation
- Alternatives Refinement
- Ridership Modeling
- Cost Estimates
FINAL PLAN
- Summary of Findings/
Recommendations
- Next steps beyond study
START
FINISH
FALL ‘15
SPRING ‘16
WINTER ‘16
SPRING ‘17
PUBLIC OUTREACH + PARTICIPATION
Figure 2-6: Study Process and Schedule Source: WSP | Parsons Brinckerhoff BACKGROUND
Original PDF, page 11
WEST COUNTY HIGH-CAPACITY TRANSIT STUDY | MAY 2017 TRANSIT MARKET ALTERNATIVES MOVING FORWARD BACKGROUND EXECUTIVE SUMMARY ACRONYMS
3.1 WCCTAC Board
The WCCTAC Board initiated the High- Capacity Transit Study and was actively engaged throughout the study process. The Board has provided critical feedback on its transit vision for West County and will play a critical role in determining which projects are advanced for further consideration.
3.2 Advisory Groups
From the outset of the study, WCCTAC has been committed to a comprehensive outreach effort that invited input from cities, transit agencies, and other key stakeholders, as well as the general public. The input received has been incorporated into the technical memorandums that were developed during the study process to document the study findings and in the presentations to the WCCTAC Board.
This Final Report synthesizes the results of the technical memorandums and the public outreach efforts (see Figure 3-1). The Study Management Group was established as the primary technical advisory group for the High-Capacity Transit Study. The WCCTAC Technical Advisory Committee provided valuable input on local plans, policies, and issues.
It also helped WCCTAC staff in reaching out to their local constituencies.
3.3 Telephone Town Hall
Members of the public were introduced to the High-Capacity Transit Study in a telephone town hall that was co- sponsored by WCCTAC and CCTA in November 2015. More than 2,000 people participated in the telephone conversation that discussed both the proposed Measure X half-cent transportation sales tax and the High- Capacity Transit Study. Both the WCCTAC Board Chair and Executive Director participated on the panel, fielding questions from the public. Participants had an opportunity to vote on a limited number of questions to register their transportation preferences.
Outreach
HIGH-CAPACITY TRANSIT STUDY ADVISORY GROUPS The project’s Study Management Group included representatives from operators that currently provide transit service in West County (AC Transit, BART, Capitol Corridor/Amtrak, and WestCAT), as well as the California Department of Transportation (Caltrans) and the Contra Costa Transportation Authority (CCTA).
WCCTAC’s Technical Advisory Committee includes representatives from AC Transit; BART; Contra Costa County; the cities of El Cerrito, Hercules, Richmond, San Pablo, and Pinole; and WestCAT.
Figure 3-1: Engagement Process Source: Circlepoint, 2016 TELEPHONE TOWN HALL NOVEMBER 12, 2015 KEY TAKEAWAYS 78% Identified traffic congestion as a top concern 72% Agreed transit should be a top West County priority KEY TRANSIT OBSTACLES 39% Lack of good transit options 25% Transit too slow 19% Transit too expensive 17% Transit operating hours do not work with schedule OUTREACH
Original PDF, page 12
WEST COUNTY HIGH-CAPACITY TRANSIT STUDY | MAY 2017 TRANSIT MARKET ALTERNATIVES MOVING FORWARD BACKGROUND EXECUTIVE SUMMARY ACRONYMS
3.4 Public Workshops
and Survey #1
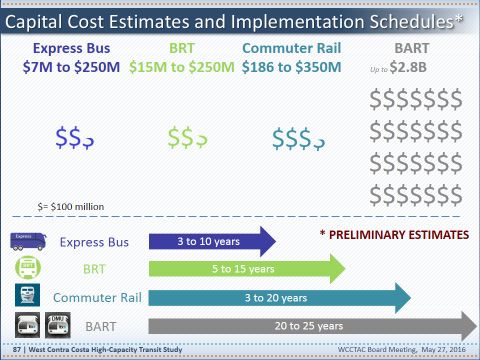
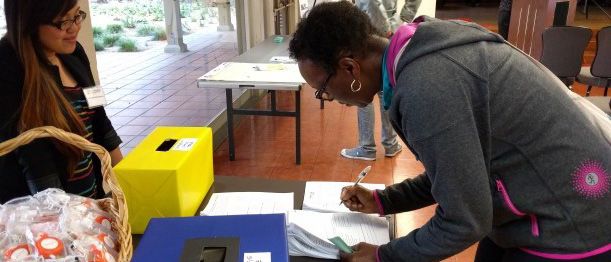
The study team conducted public workshops in April 2016. These were held at council chambers in Richmond, San Pablo, and Pinole. At these workshops, participants asked questions about the eight alternatives under consideration and registered their preferences for transit improvements based on costs and ease of implementation (see Figure 3-2). Support was registered for all improvements, with the Express Bus and BART options being the most popular.
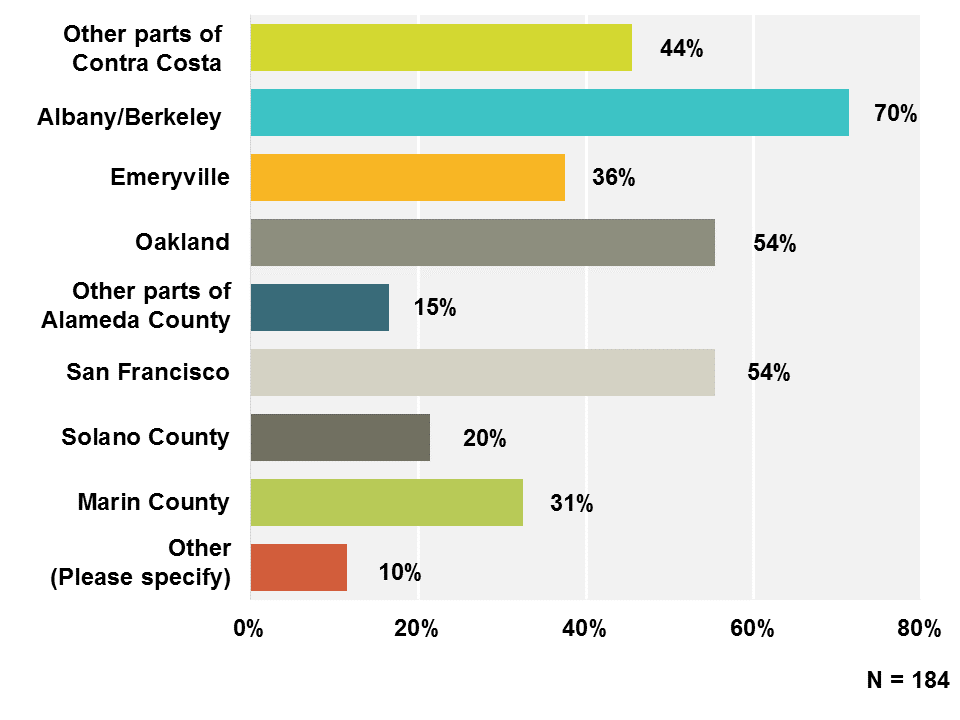
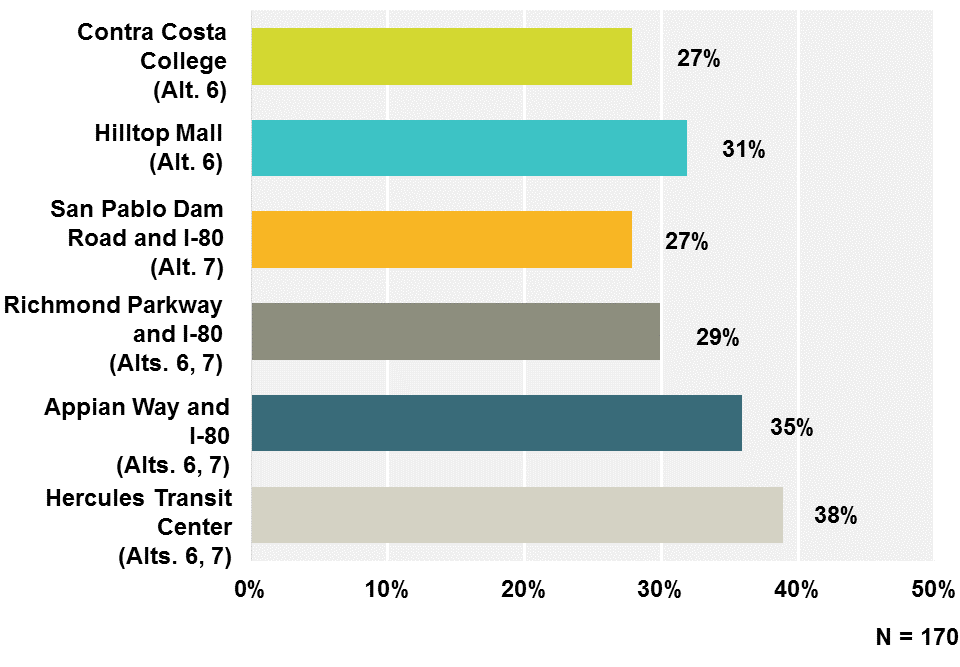
Survey #1 Results Members of the public were also asked to participate in an on-line survey in April 2015 to describe their travel patterns and express transit preferences. The surveys were not intended to provide a statistical cross section of West County residents. They were intended to provide information to the Board and an understanding of public opinions related to transit improvements. A total of 184 persons participated in the survey.
Respondents were self-selected. Figure 3-3 provides a sample of the responses to survey questions. Summary of Public Outreach and Survey #1 A summary of the public workshops and the first survey can be found by clicking HERE or at http://westcountytransitstudy.
com/wp-content/uploads/2016/05/ WCCTAC-April-2016-Public-Outreach- Summary-Report.pdf. Common Themes The following common themes emerged from the first round of public workshops and the public survey:
■ ■Northern Alameda County (Albany, Berkeley, Emeryville, and Oakland) and San Francisco were the most popular destinations for travel outside of West County.
■ ■A strong desire existed for improved public transit options. ■ ■Support was expressed for Express Bus and BRT improvements as short-term and cost effective ways of improving transit.
■ ■While BART tended to be favored among respondents, all transit improvements were registering support among citizens. ■ ■Concern was expressed over the high cost of a BART extension and the ability to fund such high cost improvements.
■ ■Commuter rail was acknowledged for its potential to alleviate congestion on I-80. Figure 3-2: Preliminary Cost Estimates + Implementation Schedules Presented at Public Workshops Source: Circlepoint, 2016 San Pablo Public Workshop, April 12, 2016, Source: Circlepoint OUTREACH
Original PDF, page 13
WEST COUNTY HIGH-CAPACITY TRANSIT STUDY | MAY 2017 TRANSIT MARKET ALTERNATIVES MOVING FORWARD BACKGROUND EXECUTIVE SUMMARY ACRONYMS Figure 3-3: Online Survey #1 Sample Results Source: Circlepoint, WSP | Parsons Brinckerhoff Note: These survey results represent a non-statistical sample of the West County population.
OUTREACH When traveling outside West County, what areas do you most frequently visit? (check all that apply) If BART were extended north to Hercules, where would you prefer stations be located? (check your two top choices)
Original PDF, page 14
WEST COUNTY HIGH-CAPACITY TRANSIT STUDY | MAY 2017 TRANSIT MARKET ALTERNATIVES MOVING FORWARD BACKGROUND EXECUTIVE SUMMARY ACRONYMS
3.5 Council
Presentations and
Survey #2
This round of public outreach was focused on bringing project information to existing public forums. WCCTAC made presentations at city and municipal advisory councils in West County in February and March of 2017. The presentations provided information on the refined alternatives, solicited input and feedback from the public on the refined alternatives, and encouraged participation in a second survey.
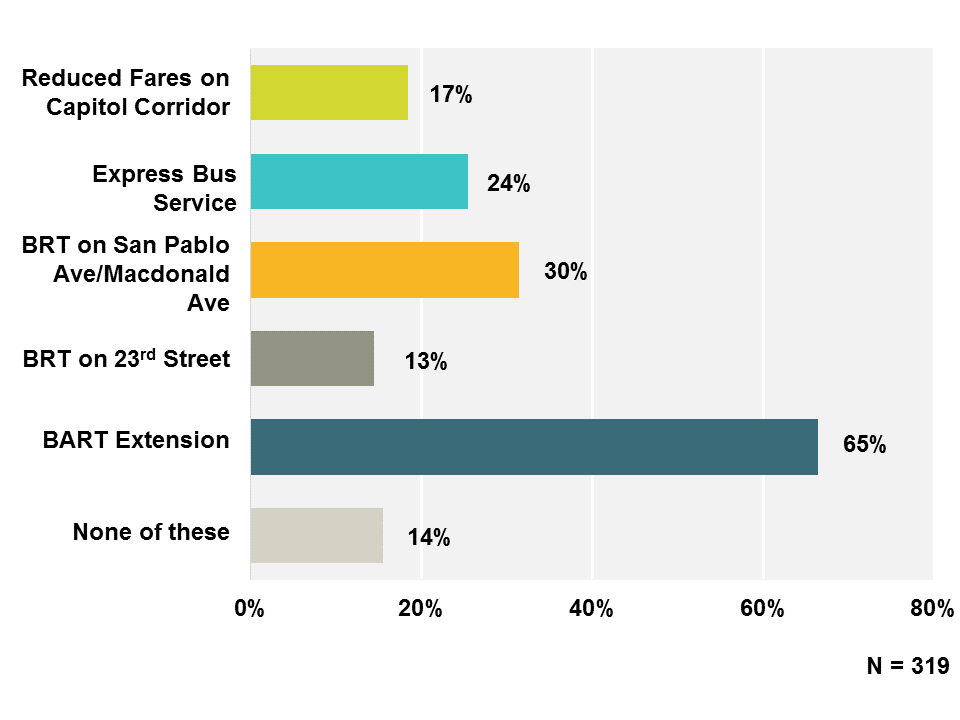
Survey #2 Results A second online survey was administered to obtain a deeper understanding of trip patterns, transportation challenges, and transit solution preferences from existing and potential future transit users in West County. The survey was available to the public in February and March 2017.
The survey was not undertaken as a statistical sampling of the West County population. It was intended to foster public interest in the project and provide the WCCTAC Board with a general sense of the public interest in transit improvements in their community.
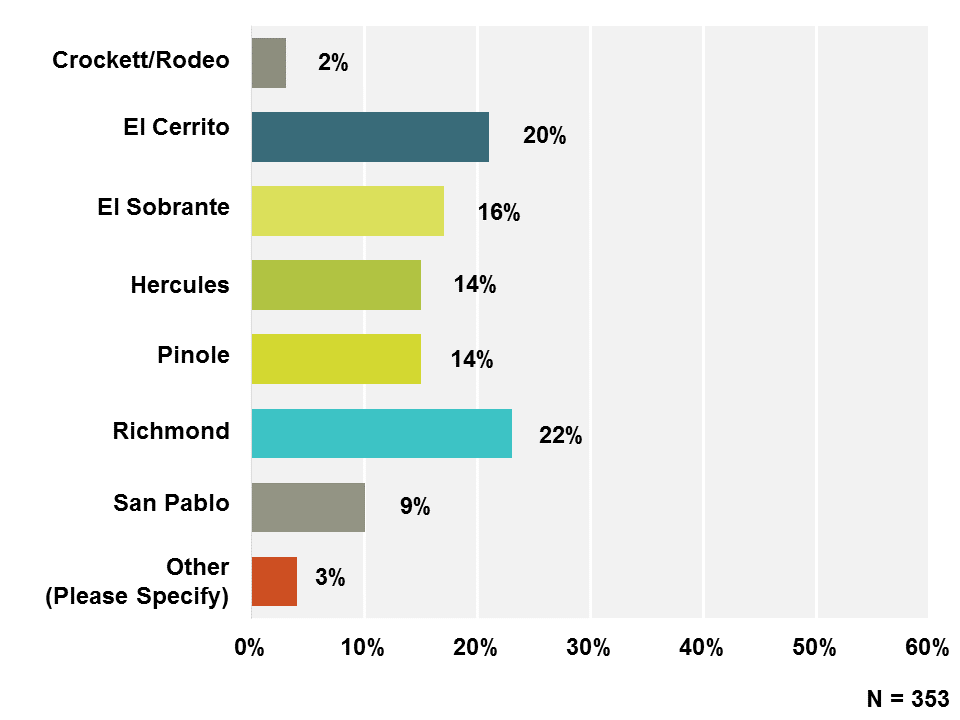
A total of 652 respondents participated in the survey; covering a broad area in Contra Costa County and outside the county. Of the respondents, 353 began their commutes in West County; 98 ended their trips in West County and the remainder were making trips outside of West County. Figure 3-4 provides a sample of the responses to survey questions. A more detailed analysis of the survey results can be found in Public Outreach Summary Report.
Summary of Public Outreach and Survey #2 A summary of the second round of public workshops and the second survey can be found HERE or at http:// westcountytransitstudy.com/wp-content/ uploads/2017/04/April-2017-Public- Outreach-Summary-Report-2_20170410.
pdf. Common Themes The following common themes emerged from the second round of public workshops and the public survey: ■ ■Universal support for short-term bus improvements that would introduce alternatives to driving on the congested I-80 freeway. Support for the specific options varied by location and there was some concern expressed that the bus improvements were good short- term improvements, but may not be adequate to solve problems in the long-term.
■ ■Support for the commuter rail fare subsidies and new station in Hercules were mixed; there were some concerns that commuter rail projects were costly for the small return on ridership.
■ ■General support for BART as long-term solution given its potential ridership and the good connectivity to the rest of the Bay Area, particularly to high demand areas like Oakland and San Francisco. However, there was also acknowledgement that while BART is greatly needed, it is among the costliest of options.
■ ■Concerns were expressed that I-80 congestion is only getting worse, resulting in ever-increasing negative impacts upon the quality-of-life.
■ ■There was universal concern about the ability to fund these needed improvements, particularly for the BART extension, which is the most costly. It was noted that some cities are “maxed out” on sales taxes making it challenging for local entities to raise significant funds needed for the improvements.
■ ■There was interest in better understanding the trade-offs in terms of costs and benefits, such as job creation, environmental mitigation, and quality- of-life.
2017 PUBLIC PRESENTATIONS Richmond City Council February 28 San Pablo City Council March 6 Pinole City Council March 7 El Sobrante Municipal Advisory Council March 8 Hercules City Council March 14 El Cerrito City Council March 21 OUTREACH Hercules City Council, March 13, 2017 Source: WCCTAC Hercules City Council, March 13, 2017 Source: WCCTAC
Original PDF, page 15
WEST COUNTY HIGH-CAPACITY TRANSIT STUDY | MAY 2017 OUTREACH TRANSIT MARKET ALTERNATIVES MOVING FORWARD BACKGROUND EXECUTIVE SUMMARY ACRONYMS Figure 3-4: Online Survey #2 Sample Results – Trips Starting in West County Source: Circlepoint, WSP | Parsons Brinckerhoff Note: These survey results represent a non-statistical sample of the West County population. These figures portray the sample of respondents with trips starting in West County.
Where does your trip to work or school usually START? Given all you know, which option(s) would best fit your transportation needs? (check all that apply)
Original PDF, page 16
WEST COUNTY HIGH-CAPACITY TRANSIT STUDY | MAY 2017 OUTREACH ALTERNATIVES MOVING FORWARD BACKGROUND EXECUTIVE SUMMARY ACRONYMS One of the early activities of the High- Capacity Transit Study was to assess the existing and potential transit market in West County. Because the greatest congestion on roads and transit systems occurs during peak commute hours, it was critical to identify the highest- demand travel markets, origins, and destinations for West County.12 The propensity of residents and employees to use transit was also important to assess the potential success of transit services.
4.1 How Do West County
Residents Get Around?
Six transit operators currently provide service in West County: AC Transit, WestCAT, Solano County Transit, Fairfield-Suisun Transit, Golden Gate Transit, and Vine Transit. AC Transit and WestCAT are the primary bus service providers, with the other operators primarily provide service to BART at the El Cerrito del Norte or Richmond Stations from outside the West County.
BART provides regional rail service and the Capitol Corridor and Amtrak provide intercity service at a stop in Richmond. While this appears to be a fairly rich transit mix, in 2013 most commuter trips in West County were “drive alone” (64 percent) or carpool trips (17 percent) (see Figure 4-1). Only about 12 percent of commuter trips were made on transit.
For those trips on transit, the majority (65 percent) were made on local and express buses serving West County or providing connections to San Francisco and Alameda County. The remaining 35 percent of trips were on BART (see Figure 4-2).
The Capitol Corridor and Amtrak also provide intercity transit service through West County, with less than one percent of transit trips using this service.
AC Transit 48.9% BART 34.5% SolTrans 2.9% Fairfield-Suisan Transit 2.2% Golden Gate Transit 1.6% VINE 0.3% WestCAT 9.6% Drove Alone 63.7% Carpool 16.8% Transit 12.2%
WestCAT
9.6%Work From
Home 3.7% Bicycle 1.5% Other 1.4% Walk 0.7%
West County Transit Market
Figure 4-1: Commuting Modes of West County Residents Figure 4-2: West County Transit Trips by Operator Source: U.S. Census Bureau American Community Survey Source: Transit Operators, 2015 Ridership Data TRANSIT MARKET
Original PDF, page 17
WEST COUNTY HIGH-CAPACITY TRANSIT STUDY | MAY 2017 OUTREACH ALTERNATIVES MOVING FORWARD BACKGROUND EXECUTIVE SUMMARY ACRONYMS
4.2 What are the
Trip Patterns in West
County?
Two approaches were used to identify the key travel corridors in the county: the Contra Costa Transportation Authority (CCTA) countywide travel demand model and an analysis of “big data.”13 The CCTA model projects travel demand in the future using a calibrated and validated estimate of existing travel as a base for projections. The source of travel behavior data is the Metropolitan Transportation Commission (MTC) household survey. Existing and future land uses are accounted for in the CCTA model by incorporating information from West County cities’ general plans that is aggregated into projections by the Association of Bay Area Governments (ABAG).
In addition, the High-Capacity Transit Study collected new travel origin and destination data (using Big Data) for the Bay Area region and two counties to the north: Yolo and Sacramento Counties.
Adjustments were made to the model origin and destination assumptions based on the new data, which provided a 25 to 30 percent sample of the traveling public. The model was validated against the adjusted numbers to perform the ridership forecasts for the alternatives.
Of the total daily person trips that start in West County in 2013, the majority (72 percent) stay within West County.14 This is a typical condition as most trips outside of travel to work occur close to home. In 2040, though the number of daily person trips are expected to increase by 25 percent, the majority of those trips (71 percent) are still expected to stay within West County. Table 4-1 provides a summary of daily trip destinations for trips that end outside of West County. The percentages show the most prevalent trips end for residents leaving West County every day. The destinations with the largest draws are Albany/Berkeley/Emeryville, San Francisco, and Alameda/Oakland.
Northern Alameda County and San Francisco accounted for 62 percent of all trips ends outside of West County in 2013 and are expected to account for about 64 percent of all trip ends outside West County in 2040. Travel patterns are not expected to change appreciably.
A slightly different pattern exists for total daily person trips coming to West County every day. Solano County contributes a higher percentage of trips coming into West County than it does as a destination for West County. In 2013, approximately 60 percent of trips came from the top three origins: Albany/Berkeley, Solano County, and Emeryville/Alameda/ Oakland (see Table 4-2).
These three areas will continue to account for about 60 percent of the daily person trips coming into West County, however, more of the trips will be coming from northern Alameda County. The in-commute patterns show a potential to serve a northern Alameda County reverse commute trip with transit, as well as to provide services for those living in West County. In 2013, about 42 percent of trips to West County originated from Albany, Berkeley, Emeryville, Alameda and Oakland and that is expected to increase to about 44 percent by 2040.
Solano County, however, would not benefit from this reverse commute as new transit services into Solano County are not proposed as part of this study.
WHAT IS “BIG DATA”? “Big data” is defined as extremely large data sets that may be computationally analyzed to reveal patterns, trends, and associations, particularly relating to human behavior and interactions.
In this context, big data represents a large data set of trip origins and destinations in West County and the surrounding region for use in travel demand forecasting. This data is comprised of origin-destination data obtained through regular communication between cellular devices and cell towers.
THE MAJORITY OF TOTAL TRIPS STAY IN WEST COUNTY 2013 TOTAL DAILY PERSON TRIPS 492,900 trips in West County (72%) 190,600 trips to Bay Area destinations (28%) 683,500 total daily person trips THERE IS A SMALLER IN-COMMUTE TO WEST COUNTY 118,860 daily person trips from Bay Area origins to West County in 2013 TRANSIT MARKET
Original PDF, page 18
| Trip Destination | % Daily Trips Ending Outside West County 2013 |
|---|---|
| Albany/Berkeley/Emeryville | 28.5% |
| San Francisco | 18.0% |
| Alameda/Oakland | 15.5% |
| Rest of Contra Costa County | 10.7% |
| Solano County | 9.9% |
| Marin County | 4.4% |
| Santa Clara County | 4.0% |
| Napa and Sonoma Counties | 3.7% |
| South and East Alameda Counties | 3.0% |
| San Mateo County | 2.4% |
| Total | 100.0% |
| Trip Origin | % Daily Trips Ending in West County 2013 |
|---|---|
| Albany/Berkeley/Emeryville | 28.3% |
| San Francisco | 17.1% |
| Alameda/Oakland | 14.1% |
| Rest of Contra Costa County | 12.4% |
| Solano County | 9.2% |
| Marin County | 6.3% |
| Santa Clara County | 5.5% |
| Napa and Sonoma Counties | 4.3% |
| South and East Alameda Counties | 1.8% |
| San Mateo County | 1.0% |
| Total | 100.0% |
WEST COUNTY HIGH-CAPACITY TRANSIT STUDY | MAY 2017 OUTREACH ALTERNATIVES MOVING FORWARD BACKGROUND EXECUTIVE SUMMARY ACRONYMS Table 4-1: Daily Person Trips Starting in West County and Ending Outside the Study Area Source: CCTA Travel Demand Model, January 2016 Table 4-2: Total Daily Person Trips Ending in West County Source: CCTA Travel Demand Model, January 2016 TRANSIT MARKET
Original PDF, page 19
| | Transit Needs Density |
|---|---|
| Many factors contribute to the success of any transit service, with density being one of the leading indicators for potential transit ridership. While there is no single number or formula to determine how much density is needed to support transit, higher densities accompanied by pedestrian-friendly environments have been shown to generate higher ridership.15,16 Density can be defined in different ways: residential density (e.g., residents or homes per acre); total development density (e.g., homes, businesses, schools, etc. per acre); and economic density (e.g., the number of jobs in an area)17 are a few ways to examine the activity in a place or region. In the Bay Area, a project must have (or plan to increase) residential densities near bus rapid transit (BRT), light rail, BART, commuter rail, or ferry stations to be competitive for project funding by the Metropolitan Transportation Commission (MTC). Minimum density thresholds within 1/2 mile of stations are 2,750 for BRT, 3,300 for LRT, 3,850 for BART, 2,200 for commuter rail, and 750 for ferry (thresholds for Express Bus projects are not provided by MTC). COMM. BRT LRT BART FERRY RAIL HOUSING THRESHOLD Avg. housing units within ½ mile of station 2,750 3,300 3,850 2,200 750 Source: MTC Resolution 3434, Attachment D-2, Revised July 27, 2005 MTC’s requirement illustrates an important principle for making transit successful: Transit is highly dependent on the density immediately around stations (within a ½ mile). In other words, critical to the success of any bus or train service is the density right where the transit is and not the aggregate density of the larger urban area.18 Generally, cities and communities in the northern part of West County (Hercules, Pinole, Crockett, and Rodeo) have relatively low residential and jobs densities that may be less conducive to HCT today. With the projected increase in densities over time resulting in higher anticipated ridership, the level of transit investments becomes more cost effective. Short-term, lower-cost improvements, such as transit signal priority, can be made in these areas until higher densities are achieved that would warrant larger financial investments. In the interim, initial project development activities for modes such as BART can be conducted (e.g., environmental studies, preliminary investigations of right-of-way needed), as these options require a longer implementation timeline. |
WEST COUNTY HIGH-CAPACITY TRANSIT STUDY | MAY 2017 OUTREACH ALTERNATIVES MOVING FORWARD BACKGROUND EXECUTIVE SUMMARY ACRONYMS
4.3 Can Trips in West
County be Well Served
by Transit?
The final piece of the market assessment was to consider which of the transit markets outlined above would be the best candidates for successful transit service, or which would have the greatest chance of attracting ridership.
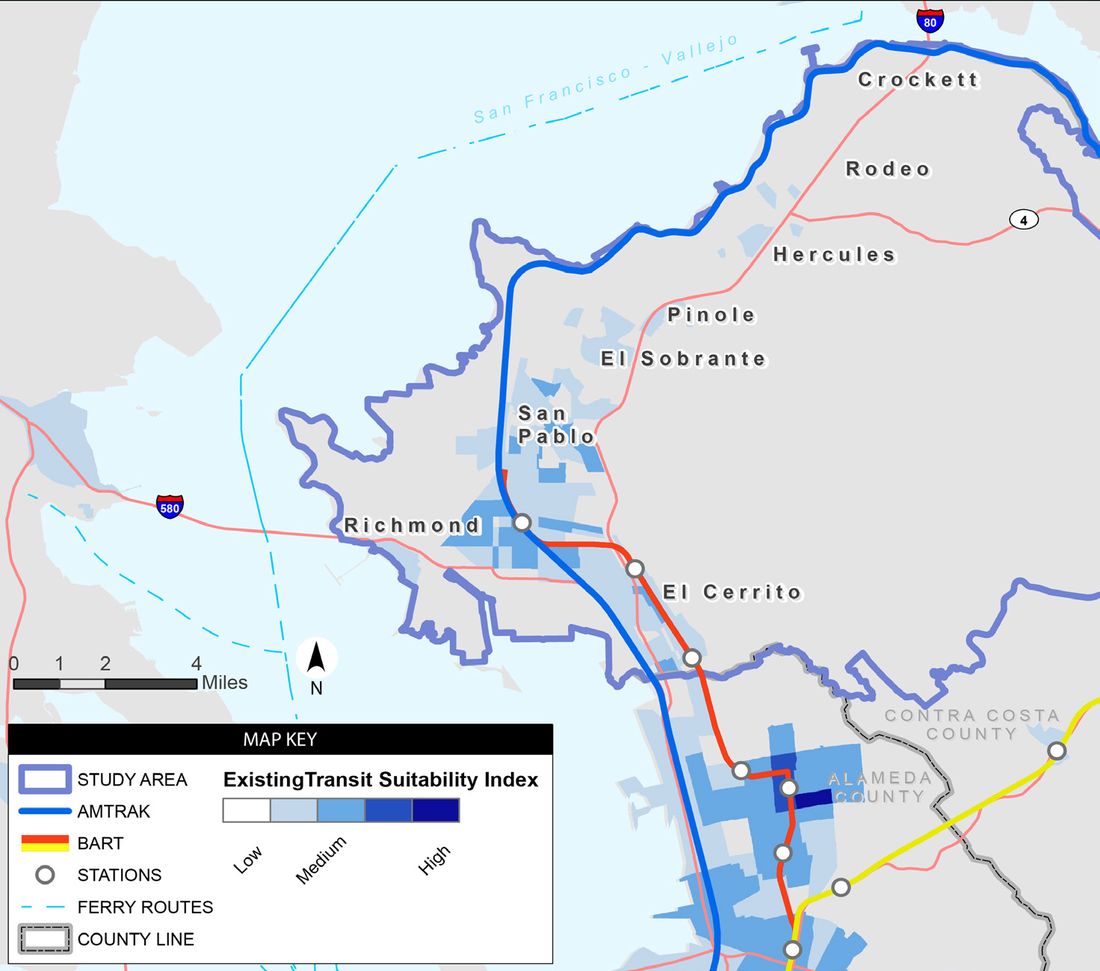
An assessment of the propensity for transit use was performed using a Transit Suitability Index (TSI). The most successful transit service links concentrated areas of trip origins with dense areas of trip destinations.
Other factors that affect transit ridership include household income and vehicle ownership. The TSI used a composite of these factors to assess transit sensitive areas in West County that have the greatest opportunity to generate new transit ridership.
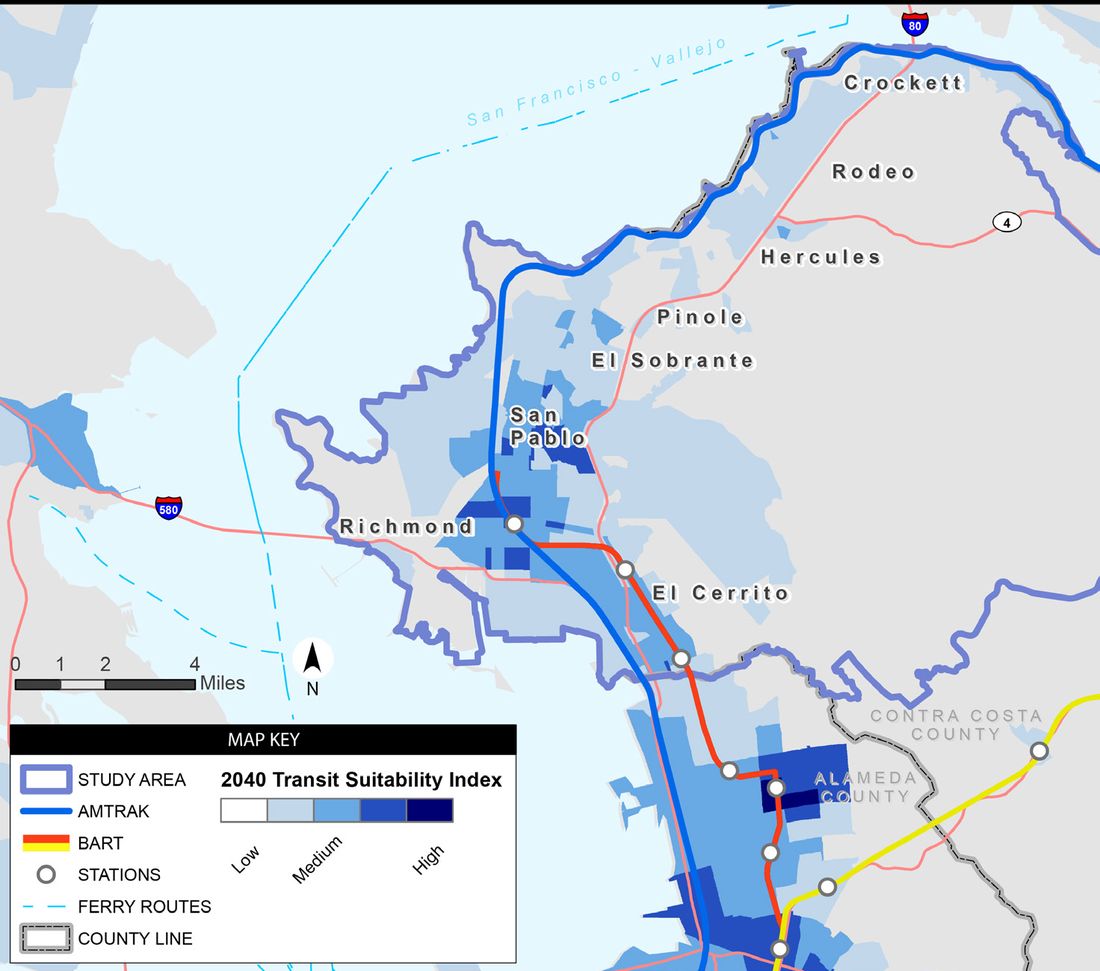
Figure 4-3 shows the results of the TSI application for West County. Under current conditions, the greatest potential for transit exists in the cities of El Cerrito, Richmond, and San Pablo in the southern part of West County. Over time, the potential for transit ridership will grow, as shown in Figure 4-4, as the areas with medium to high transit potential expand within the El Cerrito, Richmond, and San Pablo areas and the low-medium transit potential expands to Pinole and Hercules with projected growth. While not captured in the TSI, congestion on I-80 also serves as an incentive for people to opt for reliable and convenient transit alternatives in order to avoid delays on the freeway. The I-80 and the San Pablo Avenue corridors showed the greatest potential for transit investment over time, as did improved service in Richmond, El Cerrito, and San Pablo to capture the growing density of development.
TRANSIT MARKET
Original PDF, page 20
| | Transit Suitability Index |
|---|---|
| TSI is a sketch planning tool used to identify the most viable transit markets in a study area. Spatial tools in a Geographical Information System are applied to evaluate the cumulative relationship of variables that are strong indicators of transit ridership: population and employment density, household income, and vehicle ownership. |
WEST COUNTY HIGH-CAPACITY TRANSIT STUDY | MAY 2017 OUTREACH TRANSIT MARKET ALTERNATIVES MOVING FORWARD BACKGROUND EXECUTIVE SUMMARY ACRONYMS Source: WSP | Parsons Brinckerhoff Figure 4-3: Transit Suitability Index in West County, 2013 Source: WSP | Parsons Brinckerhoff Figure 4-4: Transit Suitability Index in West County, 2040
Original PDF, page 21
| # | Alternative | Description |
|---|---|---|
| 1 | Express Bus Service | Express Bus Service on I-80 from Hercules Transit Center (at Willow Avenue/SR 4) and on I-580 from Marin County to Alameda County via I-80 |
| 2 | San Pablo Avenue/ Macdonald Avenue BRT | San Pablo Avenue/Macdonald Avenue BRT from El Cerrito del Norte BART to Richmond Parkway Transit Center, serving Contra Costa College and Hilltop Mall on the San Pablo alignment; to Tewksbury Turnaround and serving the Richmond BART/Capitol Corridor station on Macdonald Avenue. Possible extensions of San Pablo BRT to Hercules Transit Center and to the Hercules Intermodal Transit Center (at Bayfront Boulevard) |
| 3 | 23rd Street BRT | 23rd Street BRT from Richmond Ferry Terminal to Richmond BART/Capitol Corridor station, then continuing to Contra Costa College, with possible extension along San Pablo Avenue to Hilltop Mall and Hercules |
| 4 | UPRR (Union Pacific Railroad) Corridor Commuter Rail | UPRR Corridor Commuter Rail from Richmond BART to downtown Martinez with an intermediate station at the Hercules Intermodal Transit Center (at Bayfront Boulevard) and with a potential extension to Oakland |
| 5 | UPRR-BNSF (BNSF Railway) Corridor Commuter Rail | UPRR-BNSF Corridor Commuter Rail from Richmond BART to Hercules Transit Center (at Willow Avenue/SR 4) with possible east extension to I-680 in Martinez and South Extension to Oakland |
| 6 | BART Extension from Richmond Station to Hercules | BART Extension from Richmond Station to Hercules from Richmond BART station along the UPRR right-of-way transitioning to 13th Avenue and Rumrill Boulevard before tunneling under Hilltop Mall then following the I-80 right-of-way to the Hercules Transit Center (at Willow Avenue/SR 4) |
| 7A | BART Extension from El Cerrito del Norte Station to Hercules – Conventional BART technology | BART Extension from El Cerrito del Norte Station to Hercules from El Cerrito del Norte BART station to Hercules Transit Center (at Willow Avenue/SR-4) along the I-80 right-of-way |
| 7B | BART Extension from El Cerrito del Norte Station to Hercules – DMU (Diesel Multiple Unit) technology | DMU Extension from El Cerrito del Norte Station to Hercules from El Cerrito del Norte BART station to Hercules Transit Center (at Willow Avenue/SR 4) along the I-80 right-of-way |
WEST COUNTY HIGH-CAPACITY TRANSIT STUDY | MAY 2017 OUTREACH TRANSIT MARKET ALTERNATIVES MOVING FORWARD BACKGROUND EXECUTIVE SUMMARY ACRONYMS This section describes the iterative process that was used to create a set of potential transit investments for West County. This study by WCCTAC is the first effort to simultaneously consider the development and integration of multimodal transit modes and how these modal options can complement each other to improve transit ridership and maximize linkages throughout the study area and the wider region.
5.1 Initial Alternatives
5.1.1 Development of Initial
Alternatives
The I-80 corridor has been the focus of many previous studies (refer to sidebar, “Previous Studies”). This is the first effort to simultaneously consider the development and integration of multimodal transit modes. These modal options can complement each other to improve transit ridership and maximize linkages throughout the study area and the wider region. The study team reviewed these prior studies and multiple sources of information to develop eight initial HCT alternatives (see Table 5-1).
These sources included the Study Management Group, the WCCTAC Technical Advisory Committee, and the WCCTAC Board. Other sources of information included the study’s transit market analysis (Section 4).
Alternatives Development
Table 5-1: Initial HCT Alternatives Source: WSP | Parsons Brinckerhoff, January 2016
Original PDF, page 22
WEST COUNTY HIGH-CAPACITY TRANSIT STUDY | MAY 2017 OUTREACH TRANSIT MARKET MOVING FORWARD BACKGROUND EXECUTIVE SUMMARY ACRONYMS The study did not focus on transit improvements that were already underway in West County, for example the proposed Richmond ferry service that will be initiated in 2018 at Ford Point. The Regional Intermodal Transit Center in Hercules was also considered a planned and programmed project, but was later incorporated into the study due to funding shortfalls. The most promising alternatives that had emerged from previous studies of the I-80 corridor were included in the mix – a BART extension via Rumrill Boulevard, consideration of alternative, cheaper technology, e.g., diesel motorized units (DMUs) in lieu of BART technology, the option for commuter rail service on the BNSF corridor, and improvements to Express Bus services on I-80.
Studies and demonstration projects in progress also informed the development of the initial eight alternatives. Alameda County Transportation Commission and AC Transit were exploring the potential for Bus Rapid Transit improvements on San Pablo Avenue from downtown Oakland north to Richmond Parkway Transit Center and on Macdonald Avenue. Golden Gate Transit was undertaking a pilot program for transbay bus service between San Rafael Transit Center and Albany, Berkeley, and Emeryville. The results of the travel market analysis for this study also introduced the concept of direct Express Bus service from West County to Berkeley, Emeryville, and Oakland.
Light rail was eliminated early on as a viable mode for the corridors under consideration. The San Pablo Avenue corridor did not have the density to support light rail transit, which would be much more expensive than BRT and have potentially more impacts on the functionality of the street, and the I-80 corridor, with the topographic challenges and the need to provide a high-capacity service for potential riders, seemed more appropriate for heavy rail options.
Taking into account all of this information, the study team developed an initial “long list” of transit alternatives for consideration. The initial list was not artificially constrained to avoid prematurely eliminating any alternatives that might have major travel benefits.
Requirements for alternatives that made the initial list were that they serve the documented travel markets, represent proven modes of transit travel, and offer high-capacity transit options consistent with the overarching purpose of the study. The eight alternatives that are on the “long list” are briefly described in Table 5-1 (refer to previous page). More detailed information on the eight alternatives is provided in Technical Memorandum #8, Preliminary Alternatives.19 PREVIOUS STUDIES Given the heavy congestion in the area, multiple efforts had been undertaken to assess the potential for HCT in the study area, including the following:
■ ■AC Transit Major Corridors Study, 2016 ■ ■AC Transit Service Expansion Plan, 2016 ■ ■BART West Contra Costa Extension Study, 1983 ■ ■BART West Contra Costa Extension Alignment Study, 1992 ■ ■BART Contra Costa-Solano Rail Feasibility Study, 2003 ■ ■BART Vision Plan, 2014 ■ ■Capitol Corridor Business Plan, 2014 ■ ■Capitol Corridor Vision Plan, 2014 ■ ■CCTA Ferry Feasibility Study, 2014 ■ ■CCTA Express Bus Study, 2001 ■ ■MTC I-80 Corridor Study, 1996 ■ ■MTC Regional Rail Plan, 2007 ■ ■WestCAT Short-Range Transit Plan, 2013 ■ ■WCCTAC Additional West County Train Station Site Evaluation, 1999 These documents were reviewed for this study along with the General Plans of the cities of El Cerrito, Hercules, Pinole, San Pablo, and Richmond. The information collected as part of the review was used to inform the study’s tasks.
ALTERNATIVES
Original PDF, page 23
Overview of Bus Rapid Transit (BRT) Features
A great advantage of BRT is its flexibility and suitability for incremental implementation. Changes can be made relatively quickly in the short- and medium-term and usually without interfering with current bus operations. The elements that comprise BRT projects form a continuum that range from Rapid Bus improvements to high-level BRT improvements. Both Rapid Bus and high-level BRT concepts include operational as well as facility improvements.
WEST COUNTY HIGH-CAPACITY TRANSIT STUDY | MAY 2017 OUTREACH TRANSIT MARKET MOVING FORWARD BACKGROUND EXECUTIVE SUMMARY ACRONYMS ALTERNATIVES In this study, Rapid Bus improvements are defined as:
TRANSIT SIGNAL PRIORITY which gives favorable treatment to buses along signalized arterials. For example, traffic signals can be programmed to reduce stopped delay for buses by offering extended green light time, shortened red light time, or possibly a separate bus-only signal phase.
QUEUE JUMPS at critical intersections, where the bus is provided a short, separate lane on approaching a signalized intersection and is given an early green to advance ahead of other traffic through the intersection.
OFF-BOARD FARE PAYMENT generally combined with proof-of-payment fare enforcement, which allows bus boarding and alighting through any door. PASSENGER STOPS with amenities, such as canopies, real-time bus arrival information, security lighting, and information kiosks.
AC Transit’s 72R Rapid Bus reduces travel time for riders by placing stops farther part, eliminating set time points at stops, increasing headways, and using transit signal priority to hold green lights longer for buses.
In this study, full BRT improvements include rapid bus improvements in addition to: DEDICATED BUS LANES either side-running or median-running, to be used by transit buses and emergency vehicles (i.e., fire and police) only.
LEVEL BOARDING where bus stops/stations are raised to at or just below the bus’s floor height, helps riders get on and off the bus more easily, especially passengers with parcels, strollers, or luggage. Level boarding also eliminates the need for wheelchair access ramps or lifts, as it bridges the horizontal gap between the bus and curb or platform.
EXTENDED BUS STOPS/STATIONS for side-running BRT buses (buses operate in the lane next to the curb or parking lane) to provide dedicated boarding and alighting areas for bus passengers separate from sidewalk traffic.
RAISED BUS STATIONS for median-running BRT configurations separated from mixed- flow traffic lanes and protected access to stations from the sidewalk (through pedestrian signals, for example).
OTHER ENHANCEMENTS including high-amenity stations with seating, lighting, landscaping, public art, and other features. High-amenity BRT stations can include the following elements, as shown in this photo of Las Vegas’ Max BRT system:
landscaping, level boarding, ticket vending machines, distinctive station, maps and other wayfinding tools, trash can, and others. Photo Sources: AC Transit (left) and Las Vegas MAX BRT (right)
Original PDF, page 24
WEST COUNTY HIGH-CAPACITY TRANSIT STUDY | MAY 2017 OUTREACH TRANSIT MARKET MOVING FORWARD BACKGROUND EXECUTIVE SUMMARY ACRONYMS
5.1.2 Evaluation of Initial
Alternatives
The initial screening of the eight alternatives was conducted for consistency with the study’s goals and objectives. In addition to the data-driven market analysis, much of this first-step evaluation was qualitative in nature;
drawing from knowledge of the study area, input from the advisory groups and the public, and prior studies. Both qualitative and quantitative measures were used to evaluate projects performance, similar to the approach used for federal New Starts funding under the Capital Investment Grant program. Since WCCTAC or the transit agencies may pursue federal funding in the future, performance was measured against Federal Transit Administration (FTA) criteria as well as project goals and objectives.20 To rate performance of each alternative a five-point scale was used; rating performance from low to high, with 1 being low-performing and 5 being high- performing. This is consistent with the project performance rating system used by FTA, which ranks low, medium-low, medium, medium-high, and high. The evaluation criteria and performance measures derived from the study’s goal and objectives are shown in Table 5-2.
The bus and BART alternatives had the highest performance levels of the eight; though each alternative scores well in some areas and poor in others. The bus alternatives are cost competitive and capture the greatest number of potential riders within a ½ mile of the stations or stops. The BRT options provide the greatest level of service to low income riders and to PDAs and provide good transit connections to other transit providers and destinations (see Figure 5-1). The Express Bus provides reliable transit service as an alternative to driving on the I-80 corridor. Express Bus service, like BRT, is consistent with local plans and has positive environmental benefits.
Both Express Bus and BRT alternatives can be implemented relatively quickly and are scalable, though the short BRT trip lengths do not offer the same potential for reduction of VMT that the longer trips on BART and Express Bus alternatives do. Express Bus has a high level of public support.
For longer-term investments, the BART alternatives scored higher than the commuter rail alternatives, despite their higher costs. The BART alternatives performed better or comparable to the commuter rail options in almost every category except for costs and risks associated with sea level rise.
The BART alternatives are by far the most expensive to implement given the challenging topography of the study area and level of existing development, but they perform well in terms of their travel time and reliability, high level of connectivity to regional destinations, and potential for reducing VMT. Despite its high cost, BART also receives a high level of public support.
While this initial evaluation process focused on how the fully implemented alternatives would perform against the study’s adopted goals and objectives, it became clear that alternatives also have potential for achieving positive results with incremental improvements.
This concept was carried forward as the alternatives were narrowed and refined. The evaluation methodology, a detailed description explaining how each alternative was evaluated against the adopted goals and objectives for the project, and the evaluation results are fully described in the study’s Technical Memorandum #10: Preliminary Evaluation and Screening.
At the conclusion of the initial screening process the WCCTAC Board voted to carry five alternatives forward for further refinement and evaluation. All three bus alternatives; short and mid-term improvements to commuter rail service;
and a BART extension from the Richmond Station were advanced. The BNSF corridor improvements and the BART extensions from El Cerrito del Norte were dropped from further consideration.
WHAT ARE SCALABLE IMPROVEMENTS? Scalable improvements are those that can be implemented incrementally with each new addition, adding independent utility. Some projects, such as BART investments, must be implemented in the whole to have benefits.
ALTERNATIVES
Original PDF, page 25
| Study Goals | Objectives | Evaluation Criteria |
|---|---|---|
| Increase transit ridership | Improve high-capacity transit service, travel times, connections | Travel time improvement |
| Travel time reliability | ||
| Improve access to transit hubs | Regional transit centers served | |
| Increase total number of transit trips | Transit market potential | |
| Improve transit connections | Connect communities to regional transit centers and other hubs | Regional transit centers served |
| Provide user-friendly regional and local transit connections | Quality of connections | |
| Expand transit service to new and under-served markets | Match transit improvements with unmet needs in all markets | Service to low-income areas |
| Service to markets currently lacking major transit connections | ||
| Protect and enhance the environment and maintain a high quality of life | Avoid impacts to natural and cultural resources | Potential environmental impacts |
| Improve air quality; reduce greenhouse gas emissions | Air quality and greenhouse gas impacts | |
| Reduce transportation energy demand | Transportation energy use | |
| Consider risks of sea level rise and climate change | Avoidance of low-lying areas | |
| Be compatible with local plans and policies | Policies in local jurisdictions’ general plans | |
| Support sustainable urban growth | Support economic and transit oriented development | West County PDAs served |
| Support compact, mixed-use sustainable communities | Availability and type of developable land served by transit | |
| Provide equitable access for residents and businesses | Improve transit access to jobs, housing, education and other resources, especially for transit dependents | Population, employment and households with access to (or accessible from) transit stations |
| Preserve mobility of people and goods throughout corridor | Congestion relief based on estimated reduction in VMT | |
| Make efficient use of public funds | Identify cost-effective investments | Order of magnitude capital costs relative ridership (cost/rider) |
| Order of magnitude O&M costs relative to ridership potential | ||
| Annualized capital and O&M costs per rider | ||
| Seek input on transit investments | Public and stakeholder support for proposed alternatives |
WEST COUNTY HIGH-CAPACITY TRANSIT STUDY | MAY 2017 OUTREACH TRANSIT MARKET MOVING FORWARD BACKGROUND EXECUTIVE SUMMARY ACRONYMS Table 5-2: Evaluation Criteria and Performance Measures for Evaluation of Initial Alternatives Source: WSP | Parsons Brinckerhoff, January 2016 ALTERNATIVES
WEST COUNTY HIGH-CAPACITY TRANSIT STUDY | MAY 2017 OUTREACH TRANSIT MARKET MOVING FORWARD BACKGROUND EXECUTIVE SUMMARY ACRONYMS WHAT IS A PRIORITY DEVELOPMENT AREA?
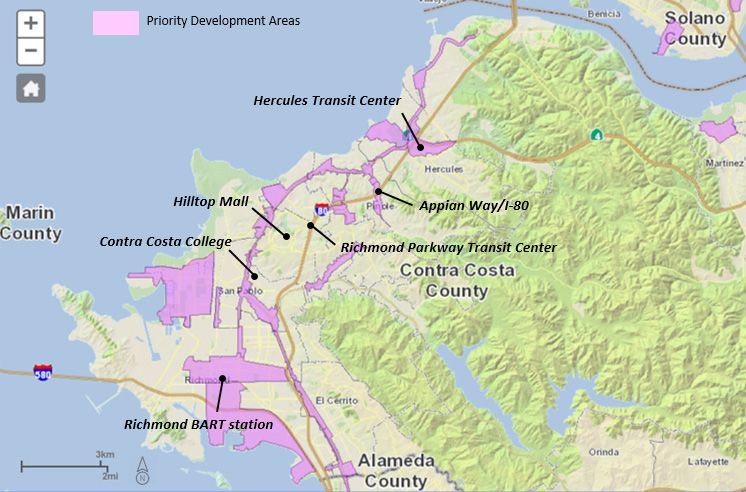
Priority Development Areas (PDAs) are places identified by Bay Area communities as areas for investment, new homes, and job growth. Along with Priority Conservation Areas, PDAs are the foundation of Plan Bay Area, which is the region’s long-range transportation, land use, and housing strategy through 2040.
To become a PDA, an area must be:
- within an existing community; 2) within walking distance of frequent transit service; 3) designated for more housing in a locally adopted plan or identified by a local government for future planning and potential growth; and 4) nominated through a resolution adopted by a City Council or County
Board of Supervisors. Plan Bay Area is the nine-county region’s first long-range plan to meet the requirements of California’s Senate Bill 375 (2008), which calls on the state’s 18 metropolitan areas to develop a Sustainable Communities Strategy. The strategy is developed to accommodate future population growth and reduce greenhouse gas emissions from cars and light trucks.
The Priority Development Areas within the study area are illustrated in Figure 5-1. Figure 5-1: Priority Development Areas Source: Plan Bay Area, Priority Development Area Showcase (2010), http://gis.abag.ca.gov/website/PDAShowcase/ ALTERNATIVES
Original PDF, page 27
| LTERNATIVE Alt 1: Express Bus on I-80 Alt 2: San Pablo / Macdonald BRT | YES | NO |
|---|---|---|
| Alt 3: 23rd Street BRT Alt 4: UPRR Commuter Rail (short + Mid-Range Options) | ||
| Alt 5: BNSF Commuter Rail | ||
| Alt 6: BART Extension from Richmond | ||
| Alt 7A: BART Extension from El Cerrito del Norte | ||
| Alt 7B: BART DMU Extension from El Cerrito del Norte |
WEST COUNTY HIGH-CAPACITY TRANSIT STUDY | MAY 2017 OUTREACH TRANSIT MARKET MOVING FORWARD BACKGROUND EXECUTIVE SUMMARY ACRONYMS
5.2 Refined Alternatives
5.2.1 Development of Refined
Alternatives and Costs
Upon completion of the initial evaluation, the WCCTAC Board voted to advance five of the eight HCT alternatives for additional study (see Figure 5-2). Further study of Express Bus on I-580, commuter rail improvements on the BNSF corridor, and a BART extension from the El Cerrito del Norte Station were dropped at this stage. The Golden Gate bus pilot program on I-580 that connected the San Rafael Transit Center with West County, Albany, Berkeley, and Emeryville was discontinued due to low ridership and there was not a strong constituency for this element of the Express Bus project in West County. The stand- alone, new commuter rail service in the BNSF corridor performed moderately to poorly in most categories and was not seen as a viable long-term option for congestion relief in West County. The BART extension north from the El Cerrito del Norte station was dropped due to the potential for isolating the Richmond BART station and the split service required to serve both the Richmond station and the extension to Hercules in the future.
The five alternatives were further developed and refined in 2016 with input from the Study Management Group and the WCCTAC Board and Technical Advisory Committee, as well as feedback from a round of community outreach in spring 2016.22 At this time, the BART extension from Richmond has been further refined into two alternatives: Alternative 6A BART Extension from Richmond via Rumrill Boulevard and Alternative 6B BART extension from Richmond via Richmond Parkway. The potential to achieve early returns on transit investment became a key consideration in the refinement of alternatives. To illustrate how projects could be incrementally implemented over time, the elements of each project were characterized as being short-term, medium-term, or long- term investments. Costs and ridership forecasts were similarly characterized.
This was not intended to constrain WCCTAC, local jurisdictions, or transit agencies in their implementation of these potential projects, but rather to provide some context for how incremental implementation might be approached.
The alternatives are briefly described here, but a more detailed description can be found in Technical Memorandum #11, Alternatives Refinement.23 Figure 5-2: Alternatives Advanced for Further Study based on Board Action Source: WSP | Parsons Brinckerhoff TIME FRAME FOR IMPROVEMENTS Short-Term improvements
<5 YEARS
Medium-term Improvements
5 - 15 YEARS
Long-Term Improvements
>15 YEARS
ALTERNATIVES
Original PDF, page 28
| Time Horizon | Capital Cost (2017 $) |
|---|---|
| Short-term | $11 m |
| Increase existing bus frequency on WestCAT Express and Transbay routes | |
| New service to Berkeley, Oakland, Emeryville | |
| Transit priority improvements, such as signal priority and queue jumps | |
| Medium-term | $90 m |
| Bus stop improvements – Berkley, Emeryville, Oakland | |
| Expanded parking at Richmond Parkway and Hercules Transit Centers | |
| Long-term | $141 m |
| Freeway ramp improvements at I-80/Macdonald, Richmond Parkway, and Hercules Transit Centers | |
| New Express Bus-BRT transit center at I-80/Macdonald Avenue | |
| Total | $242 m |
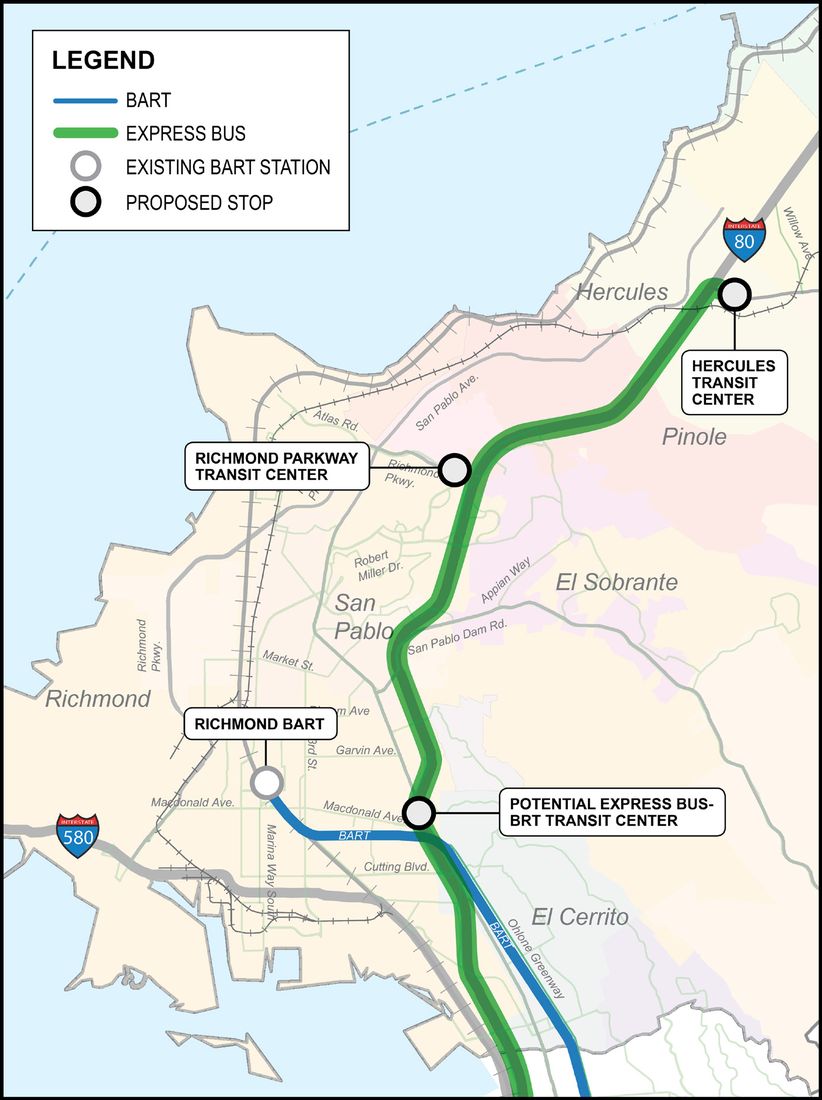
WEST COUNTY HIGH-CAPACITY TRANSIT STUDY | MAY 2017 OUTREACH TRANSIT MARKET MOVING FORWARD BACKGROUND EXECUTIVE SUMMARY ACRONYMS Alternative 1: Express Bus on I-80 The Express Bus alternative includes freeway-flyer express service on I-80 operating from the Hercules Transit Center (at the I-80/State Route 4 interchange) south to Berkeley, Emeryville, and Oakland. The proposed service has intermediate stops at the Richmond Parkway Transit Center and a potential I-80/Macdonald Avenue Express Bus/BRT transit center (see Figure 5-3). Introduction of this new service and service frequency increases to San Francisco could occur in the short- term, with peak period frequencies of 10 to 12 minutes, while the freeway ramp improvements would occur in the long- term.
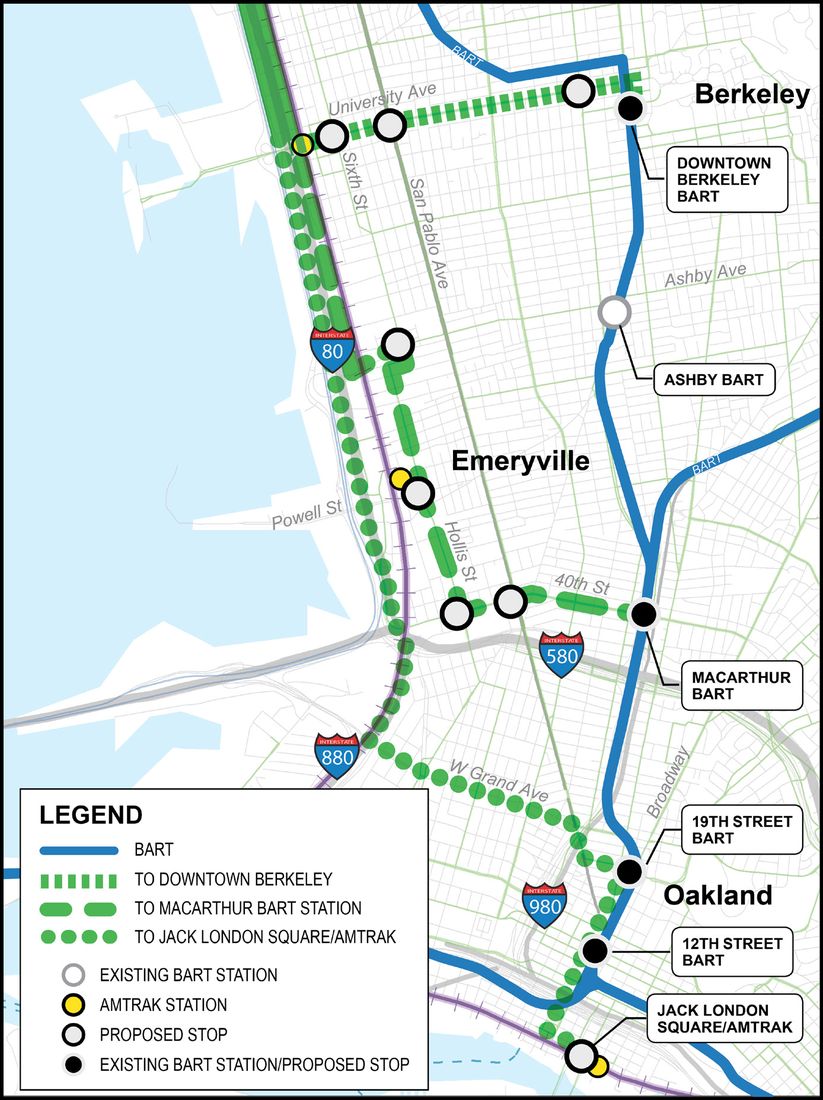
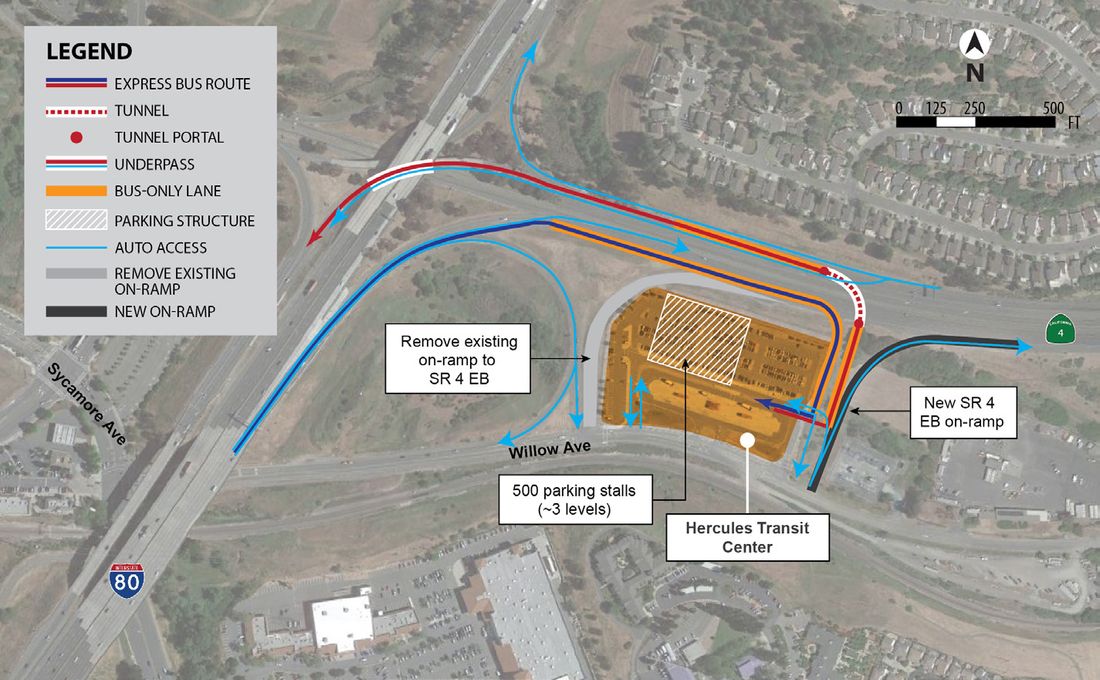
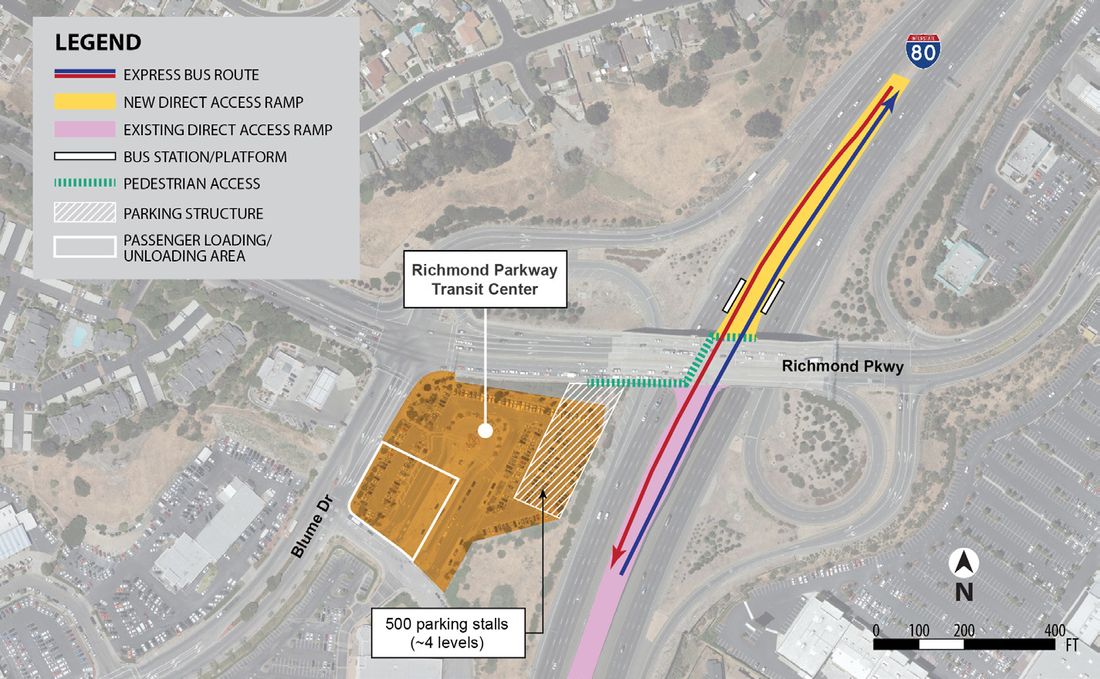
Bus routes in Berkeley, Emeryville, and Oakland are shown in Figure 5-4. Service would be provided along major transit corridors and link to major activity centers and BART stations. Expansion of park-and-ride lots and freeway ramp improvements could occur in the medium to long-term. Freeway ramp improvements to make it easier for buses to move in and out of the high occupancy vehicle (HOV) lanes in the center of the freeway, are proposed at the I-80/State Route 4 interchange, on the north side of the I-80/Richmond Parkway interchange, and potentially at the I-80/Macdonald Avenue interchange (see Figure 5-5 and Figure 5-6).
Source: WSP | Parsons Brinckerhoff with M Lee Corporation and KImley-Horn, 2017 Figure 5-3: Refined Alternative 1: Express Bus Service – Service in West County Source: Kimley-Horn and WSP | Parsons Brinckerhoff, 2016 ALTERNATIVES
Original PDF, page 29
WEST COUNTY HIGH-CAPACITY TRANSIT STUDY | MAY 2017 OUTREACH TRANSIT MARKET MOVING FORWARD BACKGROUND EXECUTIVE SUMMARY ACRONYMS Figure 5-4: Alternative 1: Express Bus Service – Service in West County Source: Kimley-Horn and WSP | Parsons Brinckerhoff, 2016 Source: Kimley-Horn, 2016 Source: Kimley-Horn, 2016 Figure 5-5: Option for Ramp Improvements at Hercules Transit Center Figure 5-6: Option for Ramp Improvements at Richmond Parkway Transit Center ALTERNATIVES
Original PDF, page 30
| Time Horizon | Capital Cost (2017 $) |
|---|---|
| Short-term | $3 m |
| Transit priority improvements such as signal priority and queue jumps | |
| Extended Rapid Bus improvements to Richmond Parkway | |
| Medium-term | $180 m |
| Extended Rapid Bus service to Hercules Transit Center | |
| Expanded parking at Richmond Parkway and Hercules Transit Centers | |
| San Pablo Avenue bus-only lanes – El Cerrito del Norte to 23rd Street | |
| Macdonald bus-only lanes – San Pablo Avenue to 23rd Street | |
| Long-term | $60 m |
| San Pablo Avenue bus-only lanes – 23rd Street to Richmond Parkway | |
| Express Bus-BRT transit center at Macdonald Avenue and I-80 | |
| Extended Rapid Bus service to RITC | |
| Total | $243 m |
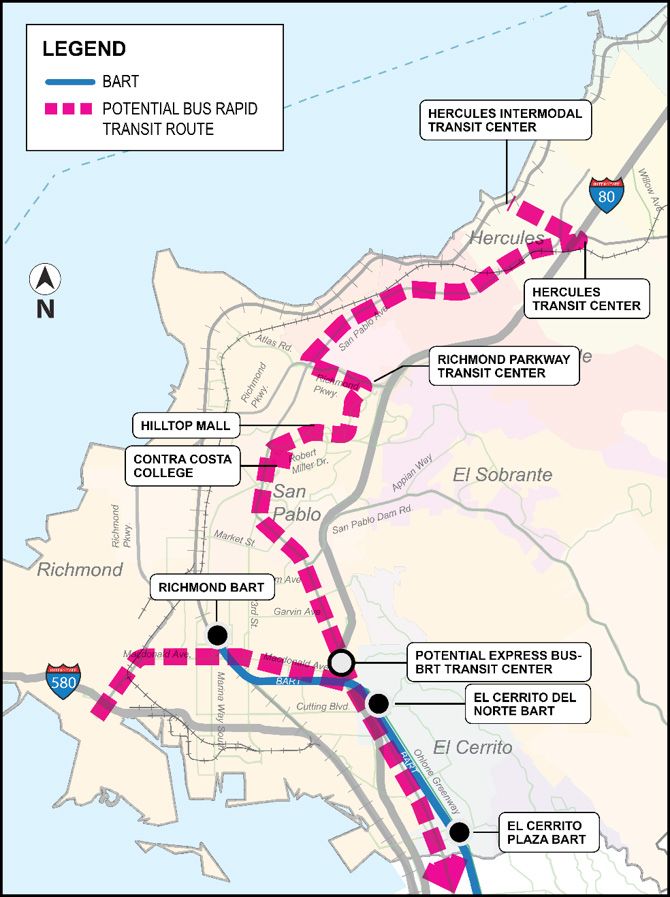
WEST COUNTY HIGH-CAPACITY TRANSIT STUDY | MAY 2017 OUTREACH TRANSIT MARKET MOVING FORWARD BACKGROUND EXECUTIVE SUMMARY ACRONYMS Alternative 2: San Pablo/Macdonald BRT The BRT improvements on San Pablo and Macdonald Avenues approximate the existing 72R Rapid Bus that run along these two streets. The proposed project would introduce BRT service from downtown Oakland to the Richmond Parkway Transit Center and extend Rapid Bus from the Richmond Parkway Transit Center north to the Hercules Transit Center (see Figure 5-7).
In the short-term, Rapid Bus Improvements could be extended to Richmond Parkway with service to Contra Costa College and Hilltop Mall and transit priority treatments introduced along the corridor. Extending Rapid Bus treatments north to the Hercules Transit Center and introducing bus-only lanes on San Pablo Avenue from El Cerrito del Norte north to 23rd Street and on Macdonald Avenue from San Pablo west to 23rd Street could occur in the medium-term. Long-term improvements could include extending bus-only lanes on San Pablo Avenue to Richmond Parkway and Rapid Bus service to the Hercules RITC. Park-and- ride lot expansion and development of an Express Bus/BRT Transit Center at I-80/ Macdonald Avenue could also occur in the medium to long-term.
BRT improvements are flexible, allowing local jurisdictions and transit agencies to implement a program that is the best fit for the proposed transit corridor and to phase them in over time as demand grows and funding becomes available.
Figure 5-7: Refined Alternative 2: San Pablo Avenue/Macdonald Avenue BRT Source: Kimley-Horn and WSP | Parsons Brinckerhoff, 2016 ALTERNATIVES Source: WSP | Parsons Brinckerhoff with M Lee Corporation and KImley-Horn, 2017
Original PDF, page 31
| Time Horizon | Capital Cost (2017 $) |
|---|---|
| Short-term | $17 m |
| Transit priority improvements, such as signal priority and queue jumps | |
| Improvements on 23rd Street from Macdonald to Richmond Field Station | |
| BRT station at Ford Point | |
| Medium-term | $99 m |
| Expanded parking at Richmond Parkway and Hercules Transit Centers | |
| Bus-only lanes on 23rd Street between Macdonald and Rheem Avenues | |
| Extended Rapid Bus service to Hercules Transit Center | |
| New vehicles (20 buses) | |
| BRT stations | |
| Long-term | $63 m |
| Mixed flow and bus-only lanes on 23rd/San Pablo Avenue from Rheem to Hilltop Mall | |
| Extended Rapid Bus service to RITC | |
| BRT stations | |
| Total | $179 m |
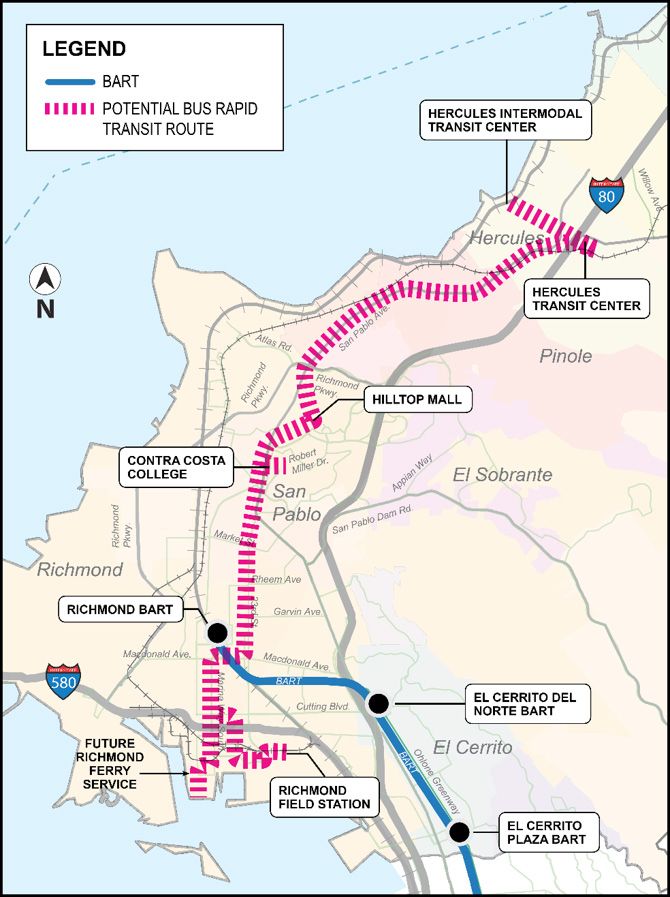
WEST COUNTY HIGH-CAPACITY TRANSIT STUDY | MAY 2017 OUTREACH TRANSIT MARKET MOVING FORWARD BACKGROUND EXECUTIVE SUMMARY ACRONYMS Alternative 3: 23rd Street BRT The 23rd Street BRT is a north-south running alignment that serves the planned Richmond Ford Point Ferry Terminal and the Richmond Field Station in the south, runs through downtown Richmond on 23rd Street, continuing through the City of San Pablo’s business district, where it transitions to San Pablo Avenue. Continuing north on San Pablo Avenue, the BRT would serve Contra Costa College, Hilltop Mall, and the Hercules Transit Center (see Figure 5-8).
In the short-term, transit priority treatments could be implemented as Rapid Bus service along the corridor and a BRT station provided at the Ford Point Ferry Terminal. Medium-term improvements might include bus-only lanes on 23rd Street from Macdonald Avenue to Rheem Avenue, BRT stations and new vehicles, and expansion of park- and-ride facilities at Richmond Parkway and Hercules Transit Centers.
In the long-term, bus-only lanes could be implemented on San Pablo Avenue if street width allows) and San Pablo Avenue north to Hilltop Mall. Rapid Bus service could also be extended to the RITC in Hercules.
Figure 5-8: Refined Alternative 3: 23rd Street BRT Source: Kimley-Horn and WSP | Parsons Brinckerhoff, 2016 ALTERNATIVES Source: Kimley-Horn and WSP | Parsons Brinckerhoff, 2016
Original PDF, page 32
| Time Horizon | Capital Cost (2017 $) |
|---|---|
| Short- and Medium-term | $68.6 m |
| Build-out of RITC |
WEST COUNTY HIGH-CAPACITY TRANSIT STUDY | MAY 2017 OUTREACH TRANSIT MARKET MOVING FORWARD BACKGROUND EXECUTIVE SUMMARY ACRONYMS Alternative 4: Commuter Rail Fare Subsidy and Regional Intermodal Transit Center The Commuter Rail Alternative has evolved into two separate options, that could be implemented in concert with each other or independently. The proposed fare subsidy would reduce fares for West County travelers between the West County Stations and Martinez in the north and Berkeley, Emeryville, and Oakland Jack London Square stations in the south. It could be implemented in the short-term with support from the Capitol Corridor and the sponsoring agency (see Figure 5-9 and Figure 5-10).
The first phase of the RITC was under construction and design for future phases had been completed when the HCT Study began; therefore, it was not explored as fully as the other alternatives. A total of $30 million in funding had been secured for the project, but an additional $68M is needed to complete construction of the future phases. The completion of the RITC in Hercules, which includes a new train stop, could be implemented in the short- to medium-term. Implementation requires an agreement with the Capitol Corridor and/or the San Joaquin Joint Powers Authority Boards that ensures no degradation of existing service, as well as securing the outstanding funding for the project.
Source: City of Hercules, 2017 Note: The costs prepared by the City of Hercules and may not reflect additional requirements for the Capitol Corridor to serve the station.
Time Horizon Short-term 75% Fare Subsidy for West County Travelers
- $5,708,000 for three-year pilot
- $11 cost per rider
- $39 cost per new rider
Source: WCCTAC staff, 2017 Figure 5-9: Refined Alternative 4: Commuter Rail Source: Amtrak/Capital Corridor Figure 5-10: Refined Alternative 4: Commuter Rail Source: Amtrak/Capital Corridor ALTERNATIVES
Original PDF, page 33
| | Comparable Capital Costs for BART Extensions |
|---|---|
| WARM SPRINGS EXTENSION 5.4 miles (one station) $165 million per mile SILICON VALLEY EXTENSION (VTA) Phase 1: Warm Springs to Berryessa 10 miles (two stations) $230 million per mile Phase 2: Berryessa to Santa Clara 6 miles (four stations) $783 million per mile HIGH-CAPACITY TRANSIT STUDY BART EXTENSION TO HERCULES 8 miles (three stations) $470 million per mile Sources: WSP | Parsons Brinckerhoff https://www.bart.gov/about/projects/wsx http://www.vta.org/bart/financial http://vtaorgcontent.s3-us-west-1.amazonaws.com/Site_ContentFS-011917-BART |
WEST COUNTY HIGH-CAPACITY TRANSIT STUDY | MAY 2017 OUTREACH TRANSIT MARKET MOVING FORWARD BACKGROUND EXECUTIVE SUMMARY ACRONYMS Alternative 6: BART Extension from Richmond Two alignments for extending service from the Richmond Station north to a new Hercules Station were considered.
Both of the alignments would follow the I-80 corridor, to the east of Richmond Parkway. While many alignments following the I-80 alignment were assessed, the alignment on the east side I-80 appeared to have the fewest conflicts. Both of the alignments considered multiple intermediate stop locations, though only one or two intermediate stations would be implemented for either line.
The Rumrill Boulevard alignment would follow the existing rail corridor on structure north from the BART maintenance yard to Brookside Drive, where it would turn east, to follow Rumrill Boulevard to Contra Costa College. At Contra Costa College it would transition to tunnel continuing under Hilltop Mall, and Richmond Parkway Transit Center, where it would transition to the I-80 alignment. It would remain in tunnel until the Appian Way interchange and would continue on structure to a station at the Hercules Transit Center. Intermediate station locations for this alignment were evaluated at Contra Costa College and Richmond Parkway Transit; with Hilltop Mall and Appian Way as other potential station sites.
The Richmond Parkway alignment would follow the existing rail corridor on structure north from the BART maintenance yard, but continuing north to Richmond Parkway. At Richmond Parkway the alignment would transition to a tunnel under Hilltop Mall and continue in tunnel to Appian Way. The alignment would follow the I-80 corridor, on structure, from Appian Way to the Hercules Transit Center.
Figure 5-11 and Figure 5-12 illustrate the refined alternatives, their key components, and costs. Cost estimates were developed from the refined alternatives and were structured to reflect the costs over time to show how improvements could be made in the short-term for low costs, with the full costs of the improvements not realized until full implementation occurs. Because the cost estimates have been developed at such an early stage of project development (about 5 percent design), the range in accuracy is high (from -50% to +100%, based on the AACE Estimate Classifications for cost estimates) and a high contingency factor is applied to compensate for this variability. As engineering of the alternatives advances and the design is more developed, the contingency would be expected to go down and the level of accuracy of the cost estimates would improve.
ALTERNATIVES
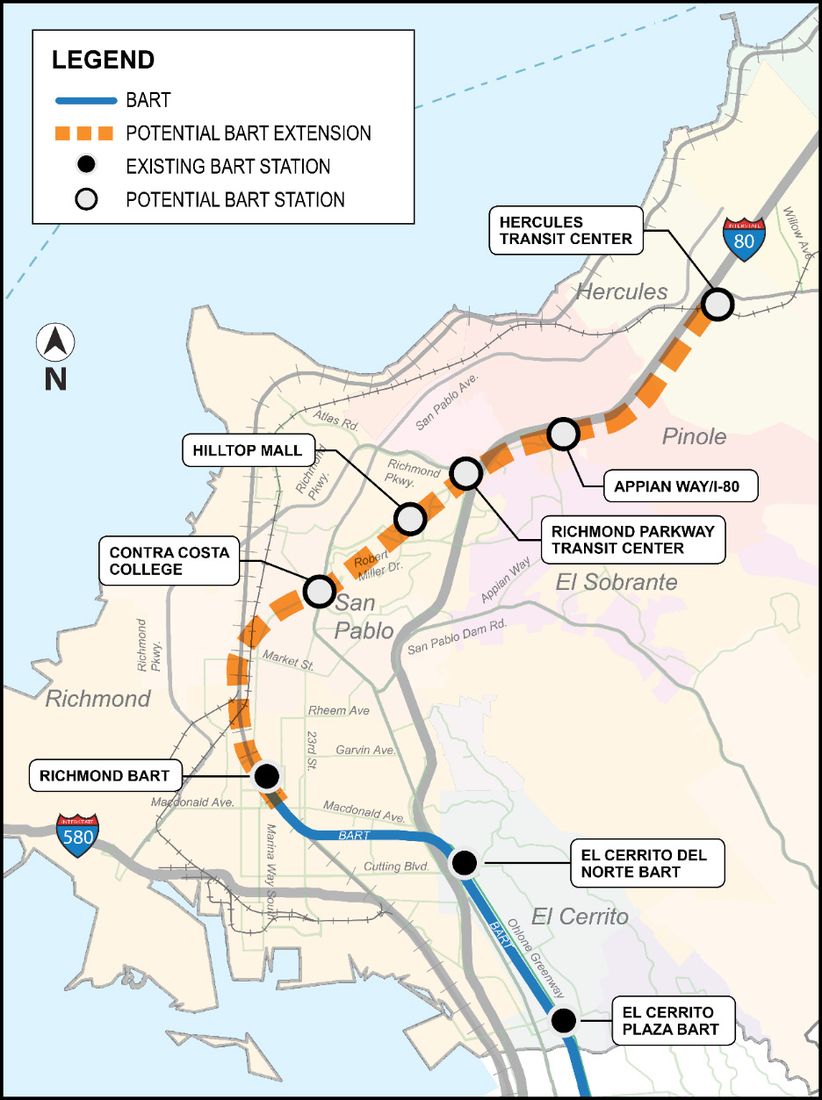
Original PDF, page 34
| Time Horizon | Capital Cost (2017 $) |
|---|---|
| Short-term | $56 m |
| Conceptual engineering | |
| Program-level environmental clearance | |
| Medium-term | $74 m |
| Preliminary engineering | |
| Project-level environmental clearance | |
| Long-term | $3,452 m |
| BART service to Hercules | |
| Vehicle acquisition (60 cars) | |
| Stations and terminal yard | |
| Total | $3,582 m |
WEST COUNTY HIGH-CAPACITY TRANSIT STUDY | MAY 2017 OUTREACH TRANSIT MARKET MOVING FORWARD BACKGROUND EXECUTIVE SUMMARY ACRONYMS Source: WSP | Parsons Brinckerhoff with M Lee Corporation, 2017 Figure 5-11: Refined Alternative 6A: BART Extension from Richmond Station to Hercules via Rumrill Boulevard Source: WSP | Parsons Brinckerhoff, 2016 Note: Only one or two BART stops would be built ALTERNATIVES
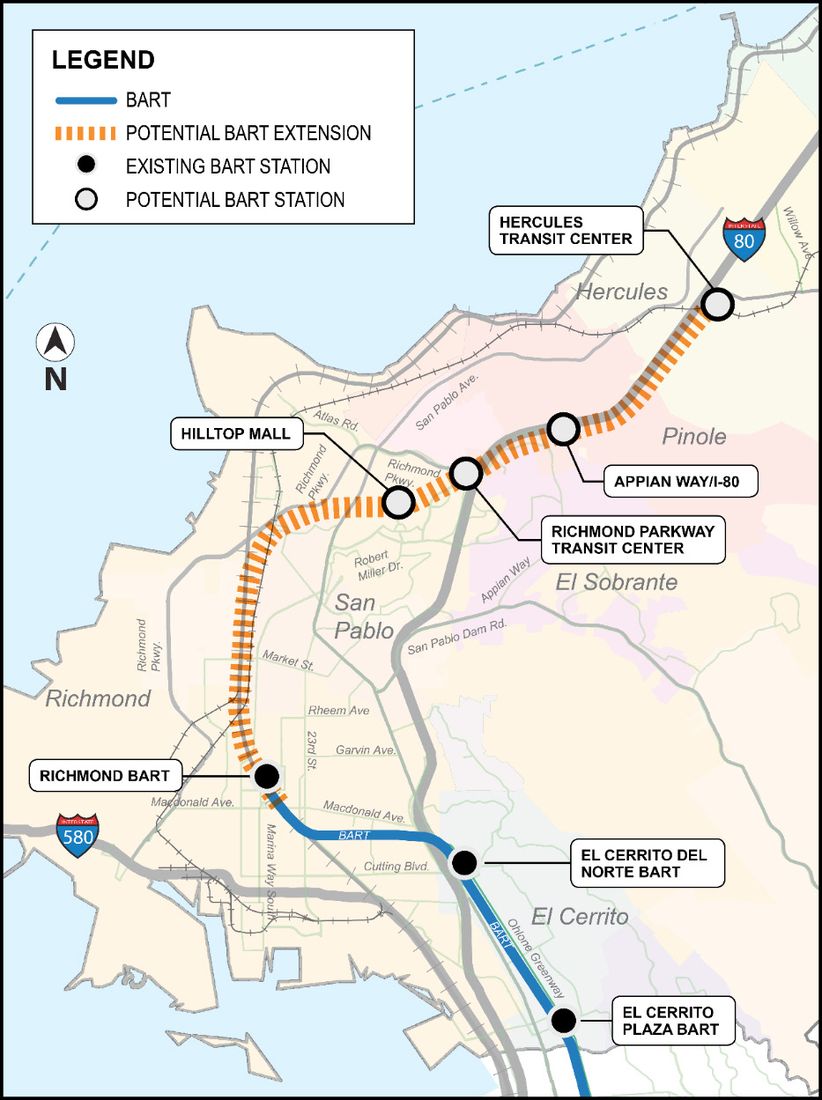
Original PDF, page 35
| Time Horizon | Capital Cost (2017 $) |
|---|---|
| Short-term | $69 m |
| Conceptual engineering | |
| Program-level environmental clearance | |
| Medium-term | $92 m |
| Preliminary engineering | |
| Project-level environmental clearance | |
| Long-term | $3,995 m |
| BART service to Hercules | |
| Vehicle acquisition (60 cars) | |
| Stations and terminal yard | |
| Total | $4,161 m |
WEST COUNTY HIGH-CAPACITY TRANSIT STUDY | MAY 2017 OUTREACH TRANSIT MARKET MOVING FORWARD BACKGROUND EXECUTIVE SUMMARY ACRONYMS Source: WSP | Parsons Brinckerhoff with M Lee Corporation, 2017 Figure 5-12: Refined Alternative 6B: BART Extension from Richmond Station to Hercules via Richmond Parkway ALTERNATIVES Source: WSP | Parsons Brinckerhoff, 2016 Note: Only one or two BART stops would be built
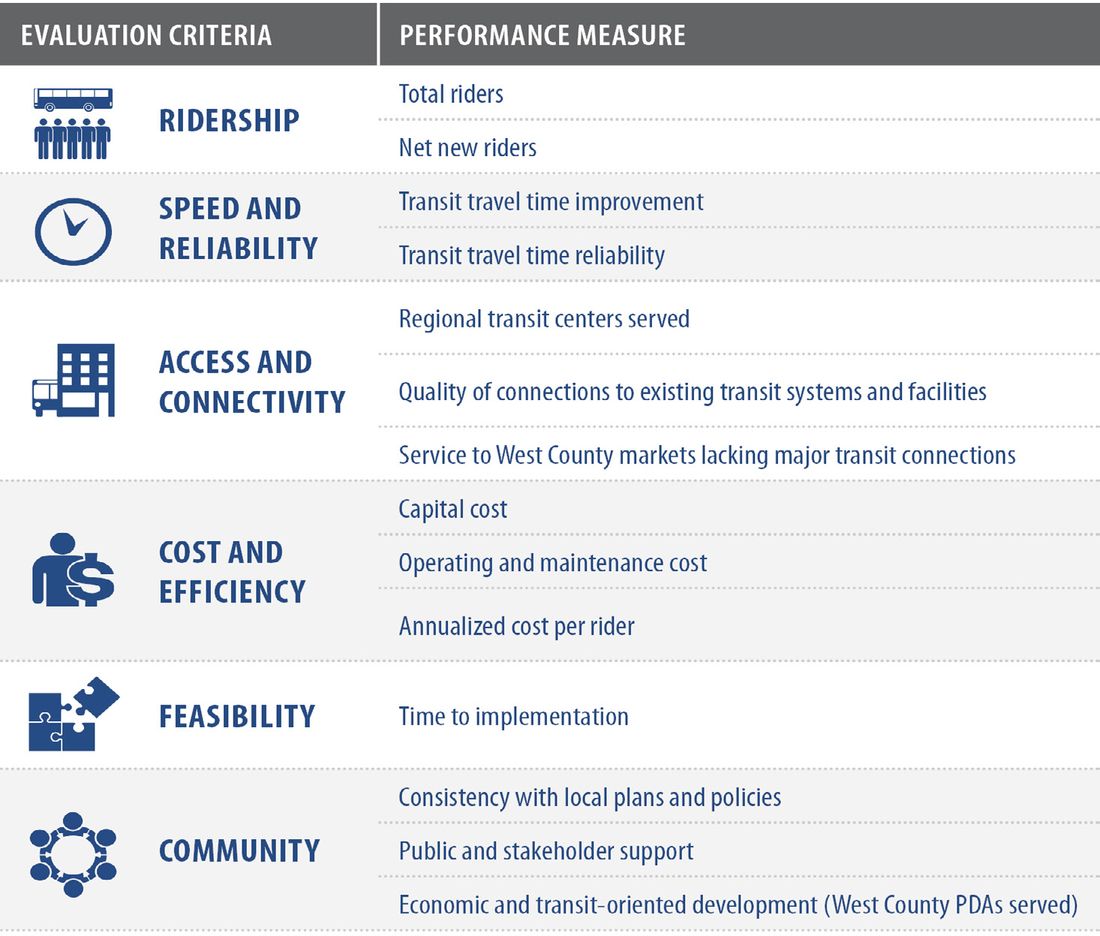
Original PDF, page 36
WEST COUNTY HIGH-CAPACITY TRANSIT STUDY | MAY 2017 OUTREACH TRANSIT MARKET MOVING FORWARD BACKGROUND EXECUTIVE SUMMARY ACRONYMS
5.2.2 Evaluation of Refined
Alternatives
The additional analysis of the refined alternatives provided more data for the study team for use in the evaluation, including ridership projections and capital cost estimates. Consequently, the evaluation of the refined alternatives consisted of more quantitative criteria and measures, including total and net new ridership as well as capital and operating cost and efficiency. Qualitative measures of performance continue to be important as well. These capture the potential improvements in speed and reliability of transit service, consistency with local plans and policies, offer potential for economic and transit- oriented development, and the feasibility of implementation and public support.
The range of evaluation criteria and performance measures used in the second round of evaluation are shown in Figure 5-13. In the second round of evaluation, the BRT alternatives once again emerged as the highest performing options followed by Express Bus. The Commuter Rail and the BART alternatives were rated highly in many categories, but performed poorly in others. For example the BART alternatives rated high in the ridership categories, but poorly in the costs and cost efficiency categories, while the Commuter Rail rated high in the cost categories, but low in the ridership and cost efficiency categories. Figure 5-14 summarizes the rating for all alternatives.
BRT on San Pablo and Macdonald Avenues ranks high in service to currently under-served transit markets, service to regional transit centers and priority development areas (PDAs), annualized cost per rider, and public stakeholder support. The BRT on 23rd Street alternative performed well against criteria related to quality and number of transit connections, annualized cost per total rider, and proximity to PDAs. The BRT alternatives were comparable in terms of projected ridership.
The Express Bus Alternative had a moderate amount of high and moderate performance ratings. It faired high in the categories of operating and maintenance costs, time to implement, and public stakeholder support. It scored moderate in most other categories except net new riders and quality of transit connections, where performance was rated low.
The Commuter Rail alternative performed well in the criteria involving travel speed and reliability, as commuter rail’s dedicated rights-of-way reduce transit travel time and delays. It also performed well in quality of connections, as Capital Corridor/Amtrak stations are relatively well-served by other transit providers and time to implementation (the fare subsidy does not involve further project development). The Commuter Rail capital and operating costs, are relatively low compared to the other projects that would require high levels of infrastructure improvements to achieve optimal performance. It, however, ranks low in ridership and cost efficiency.
The two BART alternatives received high ratings for total and net ridership increases; transit time improvement and reliability as heavy rail’s dedicated rights- of-way are conducive to faster travel.
BART also provides high quality and number of transit connections. But both BART alternatives poor performance on cost and cost efficiency as well as time to implementation pulled down their overall ratings.
Local jurisdictions in particular are concerned about how the proposed improvements fit with the previously identified PDAs. Figure 5-13: Evaluation Criteria and Performance Measures for Evaluation of Refined Alternatives Source: Kittelson & Associates, 2017 ALTERNATIVES
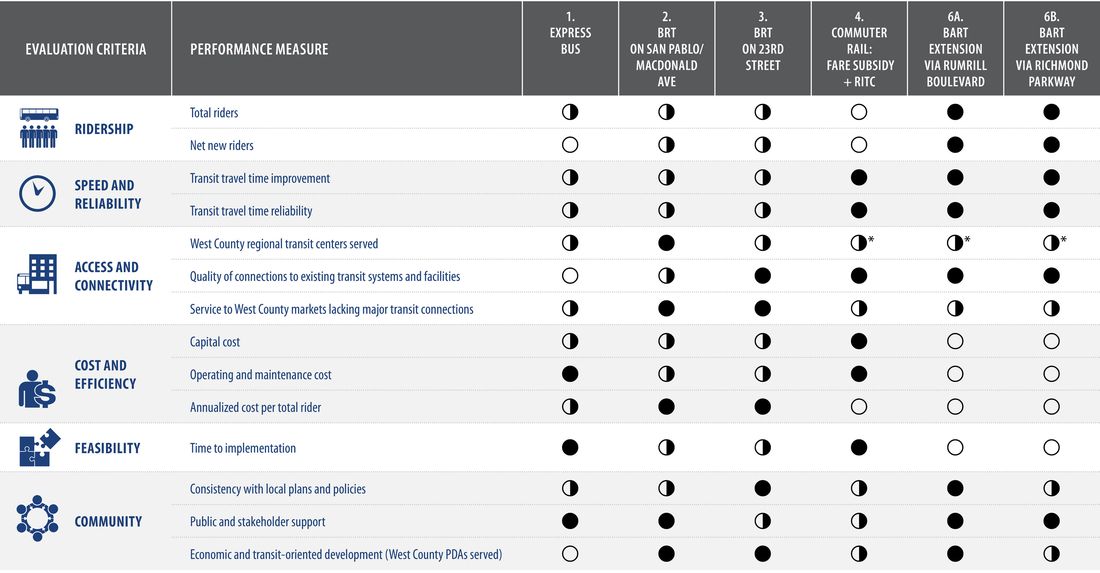
Original PDF, page 37
WEST COUNTY HIGH-CAPACITY TRANSIT STUDY | MAY 2017 OUTREACH TRANSIT MARKET MOVING FORWARD BACKGROUND EXECUTIVE SUMMARY ACRONYMS Figure 5-14: Evaluation Criteria and Performance Measures for Evaluation of Refined Alternatives Source: WSP | Parsons Brinckerhoff, January 2016
- Measures only West County regional transit centers. Both rail systems provide a high level of connectivity to regional employment centers.
Low Performing High Performing ALTERNATIVES
WEST COUNTY HIGH-CAPACITY TRANSIT STUDY | MAY 2017 OUTREACH TRANSIT MARKET MOVING FORWARD BACKGROUND EXECUTIVE SUMMARY ACRONYMS
5.2.3 Ridership Forecasts
Ridership forecasts are one of the primary metrics for evaluating the viability of a transit investment and for allocating funding. The ridership numbers help decision-makers determine the project benefits and assess the potential to secure funding for the project. The ridership forecasts developed for the High-Capacity Transit Study are preliminary forecasts that will assist WCCTAC Board members, local jurisdictions, and transit agencies to understand the alternatives advanced for further study.
After series of discussions with the Study Management Group, the WCCTAC Technical Advisory Committee, and the WCCTAC Board, it was agreed that a total of five traffic model runs would be undertaken. With the broad range of alternatives identified in this study and a limited number of model runs, the projects were assembled into packages to assess short-term and medium- and long-term investments. While this approach did not allow an absolutely independent assessment of each alternative, it shows how incremental build-up of a transit network can improve overall transit accessibility and ridership over time. Ridership forecasts were conducted for the packages of improvements in the future years of 2020 and 2040:
2020 Packages ■ ■Package A: Express Bus + San Pablo/ Macdonald Avenues BRT ■ ■Package B: Express Bus + 23rd Street BRT 2040 Packages ■ ■Package C: RITC + Express Bus + San Pablo/Macdonald Avenues BRT+ 23rd Street BRT + BART Rumrill Boulevard alignment ■ ■Package D: RITC + Express Bus + San Pablo/Macdonald Avenues BRT + 23rd Street BRT + BART Richmond Parkway alignment ■ ■Package E: RITC + Express Bus + San Pablo/Macdonald Avenues BRT + 23rd Street BRT The ridership estimates for 2020 show the relative improvements achieved with each of the BRT investments in the short-term. The 2040 investments show how transit ridership would be impacted with and without a BART investment. In each of the future years, the ridership forecasts were made with and without the project. Existing ridership is also shown to provide a context for how much transit ridership is likely to increase because of population and employment growth in the region regardless of whether any improvements are implemented.
While the forecasts offer a sound relative comparison of the ridership that might be expected with each set of improvements, they should not be taken as the final estimate of ridership potential. With the number of alternatives that were being evaluated, it was not possible to get the detailed analyses that would be needed to complete environmental evaluation and secure funding for a project. In future phases of these projects, ridership forecasts would more clearly be able to evaluate the impact on ridership of alternative design treatments, alignment variations, and station locations.
Table 5-4 and Table 5-5 provide summaries of transit ridership in 2020 and 2040 with and without the proposed transit improvements. There are a few broad conclusions that can be drawn from a comparison of the ridership projections.
■ ■Demand for transit services is projected to increase in both the near-term and in the long-term (2040) as growth in population and employment in West County and the region continues.
This increasing demand for services is already resulting in increasing crowding on bus and rail services. It is particularly acute on the BART system. The forecasted growth in transit ridership of nearly 19,000 from 38,880 current riders to 2040 cannot be accommodated without substantial investment in transit.
■ ■The BART system improvements, which include upgraded train controls, new vehicles, and improvements to the Hayward maintenance facility, must be pursued in conjunction with new system extensions. Without major system upgrades, including an assessment of alternatives that increase transbay and downtown San Francisco station capacity, the BART system extensions would operate with severe restrictions.
■ ■In the short-term, investments in bus service improvements, such as introducing new direct Express Bus service to Berkeley, Emeryville, and Oakland, expanding service to San Francisco, and introducing new transit priority treatments on San Pablo/ Macdonald Avenues and 23rd Street, would help to alleviate crowding on current bus transit services as well as attract new riders. These new bus services would provide an alternative to driving on I-80 and would facilitate transit mobility in West County.
■ ■In 2040, the full BRT and Express Bus improvements would provide new capacity to meet growing transit demand and attract additional new riders. These bus service improvements would be a critical part of meeting future transit demand. The extension of the BART line from Richmond to the Hercules Transit Center would provide additional new capacity and better balance the demand at the existing BART stations in West County.
It would provide a more northerly access to the BART system, thereby causing diversion and reducing the demand for travel on the I-80 corridor and specifically in the vicinity of the El Cerrito del Norte BART station. This would reduce the demand at the El Cerrito del Norte Station, improve local circulation, and free up area for the City of El Cerrito to pursue plans for transit oriented development.
■ ■The ridership projections show that while the introduction of BRT service would reduce the ridership on local ALTERNATIVES
Original PDF, page 39
| Service | 2014/2015 Observed | 2020 No Build | Net Change 2020 No Build to 2014/15 | 2020 Package A | Net Change 2020 Package A to No Build | 2020 Package B | Net Change Package B to No Build |
|---|---|---|---|---|---|---|---|
| BART | 17,640 | 21,100 | 3,460 | 21,980 | 880 | 20,880 | (220) |
| AC Transbay | 2,160 | 2,440 | 280 | 3,160 | 720 | 3,590 | 1,150 |
| AC BRT | - | - | - | 8,660 | 8,660 | 4,700 | 4,700 |
| AC Local | 14,080 | 15,940 | 1,860 | 9,190 | (6,750) | 13,230 | (2,710) |
| WestCAT | 5,000 | 5,680 | 680 | 6,420 | 740 | 6,420 | 740 |
| Express Buses | - | - | - | 1,120 | 1,120 | 1,230 | 1,230 |
| Total | 38,880 | 45,160 | 6,280 | 50,530 | 5,370 | 50,050 | 4,890 |
| Service | 2014 / 2015 Observed | 2040 No Build | Net Change 2040 No Build to 2014/15 | 2040 Package C | Net Change 2040 Package C to No Build | 2040 Package D | Net Change 2040 Package D to No Build | 2040 Package E | Net Change 2040 Package E to No Build |
|---|---|---|---|---|---|---|---|---|---|
| BART | 17,640 | 26,160 | 8,520 | 32,530 | 6,370 | 32,170 | 6,010 | 27,220 | 1,060 |
| AC Transbay | 2,160 | 3,010 | 850 | 3,380 | 370 | 3,770 | 760 | 3,780 | 770 |
| AC BRT | - | - | -- | 19,170 | 19,070 | 17,440 | 17,440 | 17,270 | 17,270 |
| AC Local | 14,080 | 21,080 | 7,000 | 10,070 | (11,010) | 10,390 | (10,690) | 9,730 | (11,350) |
| WestCAT | 5,000 | 7,410 | 2,410 | 6,650 | (760) | 8,480 | 1,070 | 7,330 | (80) |
| Express Buses | - | - | -- | 1,580 | 1,580 | 1,560 | 1,560 | 2,060 | 2,060 |
| Commuter Rail - RITC | -- | -- | -- | 430 | 430 | 430 | 430 | 440 | 440 |
| Total | 38,880 | 57,660 | 18,780 | 73,710 | 16,050 | 74,240 | 16,580 | 67,830 | 10,170 |
WEST COUNTY HIGH-CAPACITY TRANSIT STUDY | MAY 2017 OUTREACH TRANSIT MARKET MOVING FORWARD BACKGROUND EXECUTIVE SUMMARY ACRONYMS Table 5-4: 2020 West Contra Costa County Weekday Daily Transit Ridership (Boardings) Source: BART, 2015 observed data, www.bart.gov/about/reports/ridership Source: AC Transit observed data, 2014 Annual Route Performance Report Source: WestCAT observed data, Email Communication from Charles Anderson, GM, WestCAT, May 2015, & WestCAT website www.westcat.org/schedules/fixedroute.html#express Note: These ridership forecasts have not gone through Amtrak Intercity Ridership Modeling Table 5-5: 2040 West Contra Costa County Weekday Daily Transit Ridership (Boardings) Source: BART, 2015 observed data, www.bart.gov/about/reports/ridership Source: AC Transit observed data, 2014 Annual Route Performance Report Source: WestCAT observed data, Email Communication from Charles Anderson, GM, WestCAT, May 2015, & WestCAT website www.westcat.org/schedules/fixedroute.html#express Note: Capital Corridor and Amtrak boardings at the RITC were derived from the Hercules Intermodal Transit Center Study, prepared by DKS and HDR, February 10, 2010. These ridership forecasts have not gone through Amtrak Intercity Ridership Modeling ALTERNATIVES
Original PDF, page 40
WEST COUNTY HIGH-CAPACITY TRANSIT STUDY | MAY 2017 OUTREACH TRANSIT MARKET MOVING FORWARD BACKGROUND EXECUTIVE SUMMARY ACRONYMS bus lines, the Express Bus, BRT, and BART improvements would all generate robust ridership in the future. The complement of transit services work together to provide a more viable transit network for the future of West County.
One of the benefits of transit investment in West County is the potential to reduce the overall vehicle miles traveled. A reduction in vehicle miles traveled can translate to a reduction in total hours spent traveling and a reduction in greenhouse gas emissions. With the planned transit investments, the overall roadway performance is expected to improve in West County, as summarized in Figure 5-15 and Figure 5-16.
WHAT IS VMT AND VHT? VMT is a measure of the miles traveled by vehicles within a specific area for a set time period. VHT is a measure of the total vehicle hours spent traveling in a specific area for a set time period.
The data presented here is for West County during the AM peak four hour period. 500,000 1,000,000 1,500,000 2,000,000
Build Package
C/D
No Build
Build Package
A/B
No Build
Existing
Figure 5-15: VMT AM Peak 4-Hour Period Source: Kittelson and Associates, March 2017 10,000 20,000 30,000 40,000 50,000 60,000 70,000
Build Package
C/D
No Build
Build Package
A/B
No Build
Existing
Source: Kittelson and Associates, March 2017 Figure 5-16: VHT AM Peak 4-Hour Period ALTERNATIVES
Original PDF, page 41
WEST COUNTY HIGH-CAPACITY TRANSIT STUDY | MAY 2017 OUTREACH TRANSIT MARKET ALTERNATIVES MOVING FORWARD BACKGROUND EXECUTIVE SUMMARY ACRONYMS
6.1 What Have We
Learned from this
Study?
Throughout the course of this study, certain conclusions have emerged that can guide the next steps of transit improvements for West County. A summary of these conclusions across all modes is captured below:
■ ■Demand for transit is growing in West County and the demand cannot be met with the existing transit network. Severe congestion on I-80 will only get worse if major transit investments are not made.
■ ■There is not one single transit improvement that can, on its own, meet the demand for transit in the future. A transit system, comprised of bus and rail networks that effectively works together, can have an impact on the congestion experienced in West County.
■ ■The transit investments proposed in West County must work in concert with transit system improvements throughout the region to be effective.
For example, a BART extension in West County cannot work unless improvements are made to the BART system. ■ ■The majority of daily trips stay within West County and the single largest travel markets to and from West County are to northern Alameda County – Berkeley, Emeryville, and Oakland. Both of these transit markets need viable investments to capture new transit riders.
■ ■El Cerrito, Richmond, and San Pablo have densities that can support a high level of transit service. As growth occurs, the densification of these areas and new development in Pinole and Hercules will make transit a more viable option in the future, if land use policies support the transit investment.
■ ■Implementation of major transit investments have the potential to reduce VMT and greenhouse gas emissions and offer a different future for West County. Overall traffic congestion is reduced in West County by providing alternatives to driving.
While I-80, may still be congested due to latent demand, the congestion on surface streets would improve as fewer trips are diverted from the freeway system.
How do each of the transit projects evaluated in the High-Capacity Study fit within the future plans for West County and what role will they play in realizing a different future for the county?
The travel market assessment identified a large travel market to and from Berkeley, Emeryville, and Oakland that can be tapped into with the expansion of direct bus service to these locations. Bus service is a viable and low cost option for supplementing BART service, which is oversubscribed. Because bus service is more flexible than rail transit, it can be modified as demand grows and new services can be implemented easily and at lower cost than rail.
Given the congestion on I-80, it is critical now, more than ever, for freeway operations to support Express Bus. For Express Bus to be effective there has to be a high functioning bus lane on the freeway.
The Bay Area does not yet have experience on how BRT will perform, but experience in other cities has shown BRT to be effective in increasing transit ridership by improving transit travel times and reliability. The transit market assessment showed the importance of providing transit options for the trips that are made within West County every day. The ridership projections indicate that BRT can work within West County and WCCTAC’s participation in the upcoming San Pablo Avenue Multimodal Corridor Study will advance the project development of the San Pablo BRT alternative. The success of the Rapid Bus service on San Pablo Avenue provides an early indication of the potential improvements that can be realized with BRT investments, but the real advantages for transit priority will come only with priority being given to moving people rather than cars along the BRT corridors.
With the anticipated opening of Richmond ferry service in 2018, 23rd Street will become an even more important transit corridor than it has been. The 23rd Street BRT will provide feeder service to the heart of Richmond and San Pablo and make traveling without a car more convenient and quicker.
Earlier studies of commuter rail suggested the potential for DMUs as a low cost alternative to conventional rail for the UPRR or the BNSF corridors.
The HCT study concluded that the use of the existing railroad right-of-way (ROW) is problematic because there is either no (UPRR) or limited (BNSF) additional passenger capacity and it is very expensive to increase it. Creation
Moving Forward
Express Bus
Bus Rapid Transit
Commuter Rail
Original PDF, page 42
WEST COUNTY HIGH-CAPACITY TRANSIT STUDY | MAY 2017 OUTREACH TRANSIT MARKET ALTERNATIVES BACKGROUND EXECUTIVE SUMMARY ACRONYMS of a new passenger rail ROW would be prohibitively expensive and would likely incur costs similar to BART due to the topography of the study area. Changes to passenger capacity also involve lengthy negotiations with the rail owners to secure new passenger service rights.
While expanding capacity on one of the existing railroads may be a worthwhile pursuit, West County is only one piece of the puzzle that would be required to realize the goal. WCCTAC can serve as a partner and advocate for such improvements. As a result of these obstacles, the HCT study focused on improving access to the existing commuter rail system by the introduction of a new Hercules station (RITC), an improvement that has already been advanced by the City of Hercules, and evaluating fare subsidies for short distance trips for West County residents.
The High-Capacity Transit Study determined that BART is feasible in West County, but very expensive to implement. BART does have some support from local jurisdictions and the public, but there is also concern about the high cost of providing BART service.
A BART extension from the El Cerrito del Norte station was not popular with local officials; though more direct, it did not save money; raised operational concerns associated with split service with BART;
provided only minor time savings; and bypassed the major activity centers in Richmond and San Pablo. A decision was made to focus on an extension from the Richmond Station.
Given the complexities and challenges of the potential routes and the cost, questions about the viability of the extension have been raised. If a BART extension is to be further pursued, there are fundamental issues that need to be addressed:
- how does West County create a focused, enthusiastic, and persistent voice for a BART extension
- how will West County create a viable funding strategy for a BART extension (a single station extension of BART to
San Pablo might be worth exploring in the future given the lower cost and potential for greater political support; this incremental movement of BART is a common approach in the region) and
- how will this new extension fit with
BART’s program for core system improvements. BART’s struggles to fund and implement improvements to their core system, which is currently operating at crush loads during the peak travel periods, make the extension of BART even more challenging. New stations can be added, but if the trains are at capacity, it will not be a valuable service for West County.
The BART extension, as with all of these proposed projects, need local champions to succeed.
6.2 What Will it Take to
Advance the Projects?
This Final Report of the West County High-Capacity Transit Study is intended to serve as a resource for elected officials and staff as they advance the planning for each of the identified alternatives.
Advancing any of these alternatives will likely require the following steps: ■ ■Working together in West County in support of each others’ transit projects.
With each of the local jurisdictions having specific transit needs, it is sometimes difficult to see beyond the local view. If transit is to be successful in West County, then local leaders will need to work together, think regionally and advocate together for projects that can form the future transit network for West County. It takes a long-term commitment and hard work to realize projects such as a BART extension.
■ ■Engaging executive level leadership at the regional and local levels to raise the profile of the HCT projects and advocate for transit. It takes more than dedicated staff and public support to implement a project. Without strong leadership from elected officials, projects do not get built. Success of these projects will hinge on having vocal champions that support their implementation. Getting a major transit investment, like BRT service on 23rd Street, in the ground takes many years of concerted efforts from many players. It is important to make sure that each project has a dedicated project sponsor, like the City of Hercules who has championed the RITC, to lead the effort towards implementation.
■ ■Implementing land use plans and policies that support transit will make West County projects more competitive for federal, state, and regional funds.
Not only do the funding criteria hinge on transit ridership, but many of the funding sources also require a direct link to density around transit stations or along transit lines. The more closely aligned the local land use plans are with Priority Development Areas, such as along San Pablo Avenue or at the Hercules Transit Center, and transit oriented development opportunities such as at Contra Costa College or the El Cerrito del Norte BART station, the more competitive the HCT projects will be for limited transit funds.
■ ■Emphasizing the statewide and regional significance of I-80 will highlight the importance of funding transit alternatives for this freeway corridor. I-80 carries interstate, statewide, regional, and local trips. The trips that can be most easily diverted to transit and are within the control of West County are the local and regional trips. Given the importance of I-80 within the region, it should receive high priority for transit funding. A BART extension, though high cost, may be necessary to have a major impact on reducing VMT in West County.
■ ■Engaging CCTA, MTC, and Caltrans in the development of a regional funding strategy for the project and advocating for the projects at the state and federal level with key legislators.
The level of transit investment that is needed to address congestion in West County is not a problem that can be solved solely by West County elected officials. It will require regional,
BART Extension
MOVING FORWARD
Original PDF, page 43
WEST COUNTY HIGH-CAPACITY TRANSIT STUDY | MAY 2017 OUTREACH TRANSIT MARKET ALTERNATIVES BACKGROUND EXECUTIVE SUMMARY ACRONYMS statewide, and federal assistance. If the regional representatives can speak with one voice in support of projects, such as the BART extension, or the Express Bus improvements, then the chances for securing funding at the state and federal level are enhanced.
■ ■Creating a more detailed funding strategy for each alternative will be needed to secure the funding necessary to implement the proposed projects over the long-term. General funding strategies have been identified for each of the projects, but they will need to be followed by more concrete funding plans as project design and cost estimates are refined. Opportunities for cost savings, particularly for BART, phasing of projects like the BRT projects, and leveraging of state and federal funds should be pursued.
In addition, specific steps can be undertaken for each project to initiate the process of implementation. Short-term strategies can see immediate benefits, while the benefits of long-term strategies will take longer to realize.
■ ■Enhance existing Express Bus service from West County to San Francisco and introduce new service to Alameda County ■ ■Purchase six new buses to increase service frequency to San Francisco ■ ■Identify locations for implementation of transit-priority improvements— signalization and queue jumps where buses travel on surface streets to pick-up passengers, for example approaching the Richmond Parkway Transit Center ■ ■Work with AC Transit and WestCAT to confirm an operator for the new service to Alameda County and develop a service plan (e.g., routing, schedule, stop locations) ■ ■Seek funding for a pilot program to initiate the new service to Alameda County ■ ■Work with MTC and Caltrans at the regional level to improve the utility of the existing HOV lanes on I-80 ■ ■Advocate for more limited access to the HOV lanes so they are more functional for buses ■ ■Work with the City of Hercules and Caltrans on their plans for upgrading the I-80/SR 4 interchange to integrate direct transit priority lanes to and from the freeway HOV lanes. This will make it easier for buses to get to and from the Hercules Transit Center.
■ ■Advance the concept of new ramps on the north side of Richmond Parkway to facilitate bus access between freeway and the existing park-and-ride facility ■ ■Undertake preliminary studies to expand existing park-and-ride lots at the Hercules and Richmond Parkway transit center as demand warrants ■ ■Consider the introduction of new Express Bus service to provide connections from West County to East and Central Contra Costa County via San Pablo Dam Road ■ ■Advance San Pablo Avenue Multimodal Corridor Study ■ ■Participate in Alameda County Transportation Commission study (WCCTAC and CCTA have already contributed funding to the study and are participating in the Technical Advisory Committee) ■ ■Work with El Cerrito, Richmond, and San Pablo and AC Transit to develop a concept and preliminary design for the corridor ■ ■Extend 72Rapid Bus service to the Richmond Parkway Transit Center ■ ■Purchase additional vehicles as required ■ ■Expand real-time information capabilities ■ ■Work with the City of Richmond and AC Transit to determine if the Macdonald BRT should be pursued as a separate project ■ ■Incorporate BRT concepts into El Cerrito, Richmond, San Pablo, Pinole, and Hercules plans and into the WestCAT Short-Range Transit Plan ■ ■Work with the cities of Richmond and San Pablo and AC Transit to initiate the first phase of a 23rd Street BRT project that provides connections between the Richmond and San Pablo business districts and the Richmond Ferry terminal that is due to open in 2018.
Identify a lead agency. ■ ■Develop program and phasing of operational and physical facilities for the 23rd Street BRT ■ ■Outline a pilot program for initial operation of 23rd Street Rapid Bus service ■ ■Develop service plan (e.g., routing, schedule, stop locations) that provides connections to the planned ferry service ■ ■Seek funding for a pilot program ■ ■Identify interface facilities required at ferry terminal, including bus bays, signage, etc. for passenger pick-up/ drop-off ■ ■Incorporate BRT concepts into WestCAT and AC Transit Short-Range Transit Plans and Richmond and San Pablo general plans ■ ■WCCTAC to work with the Capitol Corridor and local elected officials to conduct a more detailed economic and ridership analysis to assess the costs MOVING FORWARD
Express Bus
San Pablo/Macdonald
Avenues BRT
23rd Street BRT
Commuter Rail
Original PDF, page 44
WEST COUNTY HIGH-CAPACITY TRANSIT STUDY | MAY 2017 OUTREACH TRANSIT MARKET ALTERNATIVES BACKGROUND EXECUTIVE SUMMARY ACRONYMS and benefits of a Capitol Corridor fare subsidy for West County travelers ■ ■Identify and secure funding for pilot project if it proves viable ■ ■Work with the City of Hercules in support of the continued buildout of the RITC ■ ■City of Hercules to negotiate an agreement with Capitol Corridor and San Joaquin Joint Powers Authority regarding the new regional station in Hercules ■ ■Present initial study findings to the BART staff and Board of Directors ■ ■Identify funding to initiate conceptual engineering and program-level environmental impact report/ environmental impact statement ■ ■Conduct further planning and design studies of the two BART alignments and the four potential station location for this corridor to sufficiently define project for environmental review ■ ■Conduct preliminary investigations of right-of-way of the two alignments ■ ■Initiate funding discussions with CCTA, MTC, and the Federal Transit Administration to advance a phased funding strategy for future implementation of a BART project.
6.3 What is the Funding
Strategy?
If West County is to make some of these transit projects a reality, a sound funding strategy is needed. The list of improvements identified in the High-Capacity Transit Study would require substantial investment in upcoming years. The ability to fund the improvements is one of the greatest challenges for implementation of the proposed alternatives. The study identified the fund sources with the greatest potential for generating transportation revenue for West County and included a comprehensive look at funding opportunities for each of the alternatives.
In general, the share of federal funding contributions to transportation projects is decreasing while the competition for available funds is increasing. A great deal of uncertainty also exists regarding the new administration, which is seeking opportunities to reduce federal spending.
This may change the availability of federal funds in the short term, but as the timeframe for funding these alternatives extends beyond the term(s) of the current administration there may still be longer term federal funding opportunities.
State funds are also oversubscribed in many programs, although California’s cap-and-trade program offers a potential new source of transportation funding. The program is a market-based regulation that is designed to reduce greenhouse gases (GHGs) from multiple sources by setting a statewide limit on sources responsible for GHG emissions and establishing a price signal needed to drive long-term investment in cleaner fuels and more efficient use of energy.
The revenue flow has been volatile to date and competition for the funds will also be more intense under the new political climate. These conditions require higher levels of financial contribution by regional and local agencies to enable project delivery.
An assessment of a comprehensive list of federal, state, regional, and local funding sources was undertaken to determine which sources would be the most viable to fund high-capacity transit improvements. The results are documented in Technical Memorandum #14, Funding Strategy.24 Evaluation criteria included revenue potential, ability to keep pace with inflation, equity, nexus with beneficiaries, legal authority, administrative costs, and political support.
Table 6-1 through Table 6-4 summarize the funding strategies by alternative for three funding scenarios, which assume high, moderate, and no federal participation.
In the short-term, local and regional funding are the most viable options to fund project development and low- cost capital improvements, such as bus acquisition or transit priority treatments.
Local agencies and jurisdictions can move ahead with implementation without having to meet the more stringent criteria that apply for competitive regional, state, and federal funding sources. Local sales tax measures and regional discretionary funds often serve as the primary funding for project initiation.
MOVING FORWARD
BART Extension
Original PDF, page 45
| Base Year Dollars (millions) | Total Estimated Capital Cost | Federal Funding | State Funding | Regional / Local Funding | |||
|---|---|---|---|---|---|---|---|
| TIGER Grants | 5339 Grants | Cap and Trade | Combination | ||||
| Low End | High End | Low End | High End | ||||
| Scenario 1: High Federal (35% share) | |||||||
| Alternative 1 | $245 |
| Scenario 2: Moderate Federal (20% share) | ||
|---|---|---|
| Alternative 1 | $245 | |
| Short-term $11 $11 (100%) Medium-term $91 $5 (5%) $46 (50%) $46 (50%) $87 (95%) Long-term $143 $15 (10%) $15.0 (10%) $113 (80%) $113 (80%) | ||
| Scenario 3: No Federal (0% share) | ||
| Alternative 1 | $245 |
WEST COUNTY HIGH-CAPACITY TRANSIT STUDY | MAY 2017 OUTREACH TRANSIT MARKET ALTERNATIVES BACKGROUND EXECUTIVE SUMMARY ACRONYMS Alternative 1 – Express Bus Regional and local funding would be tapped to initiate early activities on Express Bus (see Table 6-1). Short-term improvements such as bus priority improvements and additional and more frequent service would be funded from readily available regional and local sources, such as developer contributions from West County STMP. Medium-term improvements could be funded from a combination of the state cap-and-trade program and regional/local sources.
The cap-and-trade program may provide between 5 and 50 percent of the funding, depending on the project’s competitiveness, the program revenues, and the program reauthorization. The remainder will need to be supported with regional/local funding sources.
Recommended federal funding sources for the Express Bus long-term improvements are Transportation Investment Generating Economic Return (TIGER) funding and Section 5339 Bus and Bus Facilities grants since the project is most aligned with the eligibility criteria for these programs. Under a high federal participation scenario, these grants could potentially provide up to approximately $25 million in funding, with the remaining shares provided by regional/local sources. These federal funding levels are much less than the 80 percent statutory maximum share of federal funding, but are consistent with the scale of grants for these programs awarded by the federal government in recent years.
Short-term $11 $11 (100%) Medium-term $91 $5 (5%) $46 (50%) $46 (50%) $87 (95%) Long-term $143 $25 (17%) $25 (17%) $93 (65%) $93 (65%) Short-term $11 $11 (100%) Medium-term $91 $5 (5%) $46 (50%) $46 (50%) $87 (95%) Long-term $143 $143 (100%) $143 (100%) Table 6-1: Funding Approach Alternative 1 – Express Bus ($ millions) Source: WSP | Parsons Brinckerhoff MOVING FORWARD
Original PDF, page 46
| Base Year Dollars (millions) | Total Estimated Capital Cost | Federal Funding | State Funding | Regional / Local Funding | ||
|---|---|---|---|---|---|---|
| Small Starts Grants | Cap and Trade | Combination | ||||
| Low End | High End | Low End | High End | |||
| Scenario 1: High Federal (50% share) | ||||||
| Alternative 2 | $243 | |||||
| Short-term $3 $3 (100%) $3 (100%) Medium-term $180 $90 (50%) $90 (50%) $90 (50%) Long-term $60 $3 (5%) $30 (50%) $30 (50%) $57 (95%) | ||||||
| Scenario 2: Moderate Federal (30% share) | ||||||
| Alternative 2 | $243 | |||||
| Short-term $3 $3 (100%) $3 (100%) Medium-term $180 $54 (30%) $126 (70%) $126 (70%) Long-term $60 $3 (5%) $30 (50%) $30 (50%) $57 (95%) | ||||||
| Scenario 3: No Federal (0% share) | ||||||
| Alternative 2 | $245 |
WEST COUNTY HIGH-CAPACITY TRANSIT STUDY | MAY 2017 OUTREACH TRANSIT MARKET ALTERNATIVES BACKGROUND EXECUTIVE SUMMARY ACRONYMS Alternatives 2 and 3 - BRT BRT short-term improvements will need to be funded with regional and local sources including developer contributions or West County STMP development impact fees. Medium-term improvements could receive up to 50 percent of the funding from Small Starts with the remainder from regional and local sources to fund improvements such as continued implementation of bus- only lanes and parking at the Richmond Parkway and Hercules Transit Centers.
Long-term improvements could be funded from a combination of the cap- and-trade program and regional and local sources. The cap-and-trade program may provide between 5 percent and 50 percent of the funding. The remainder will need to be supported with regional and local funding sources. Table 6-2 and Table 6-3 present the potential funding sources for the BRT alternatives with three funding scenarios, high, moderate, and no federal participation. Moderate federal participation is probably a more realistic scenario for these alternatives.
Short-term $11 $3 (100%) $3 (100%) Medium-term $91 $180 (100%) $180 (100%) Long-term $143 $3 (5%) $30 (50%) $30 (50%) $57 (95%) Table 6-2: Funding Approach Alternative 2 – San Pablo/Macdonald BRT ($ millions) Source: WSP | Parsons Brinckerhoff MOVING FORWARD
Original PDF, page 47
| Base Year Dollars (millions) | Total Estimated Capital Cost | Federal Funding | State Funding | Regional / Local Funding | ||
|---|---|---|---|---|---|---|
| Small Starts Grants | Cap and Trade | Combination | ||||
| Low End | High End | Low End | High End | |||
| Scenario 1: High Federal (50% share) | ||||||
| Alternative 3 | $179 | |||||
| Short-term $17 $17 (100%) $17 (100%) Medium-term $99 $50 (50%) $50 (50%) $50 (50%) Long-term $63 $3 (5%) $32 (50%) $32 (50%) $60 (95%) | ||||||
| Scenario 2: Moderate Federal (30% share) | ||||||
| Alternative 3 | $179 | |||||
| Short-term $17 $17 (100%) $17 (100%) Medium-term $99 $30 (30%) $69 (70%) $69 (70%) Long-term $63 $3 (5%) $32 (50%) $32 (50%) $60 (95%) | ||||||
| Scenario 3: No Federal (0% share) | ||||||
| Alternative 3 | $179 |
WEST COUNTY HIGH-CAPACITY TRANSIT STUDY | MAY 2017 OUTREACH TRANSIT MARKET ALTERNATIVES BACKGROUND EXECUTIVE SUMMARY ACRONYMS Alternatives 2 and 3 - BRT (Continued) Table 6-3: Funding Approach Alternative 3 – 23rd Street BRT ($ millions) Short-term $17 $17 (100%) $17 (100%) Medium-term $99 $99 (100%) $99 (100%) Long-term $63 $3 (5%) $32 (50%) $32 (50%) $60 (95%) Source: WSP | Parsons Brinckerhoff MOVING FORWARD
Original PDF, page 48
| Base Year Dollars (millions) | Total Estimated Capital Cost | Federal Funding | Committed State/Regional/ Local Funding* | Unidentified Regional/ Local Funding* |
|---|---|---|---|---|
| TIGER Grants | Various Sources | Combination | ||
| Scenario 1: High Federal (25% share) | ||||
| Alternative 4 | $69 | |||
| Short/Medium-term $69 $17 (25%) $41 (60.3%) $10 (14.7%) | ||||
| Scenario 2: Moderate Federal (15% share) | ||||
| Alternative 4 | $69 | |||
| Short/Medium-term $69 $10 (15%) $41 (60.3%) $17 (24.7%) | ||||
| Scenario 3: No Federal (0% share) | ||||
| Alternative 4 | $69 |
WEST COUNTY HIGH-CAPACITY TRANSIT STUDY | MAY 2017 OUTREACH TRANSIT MARKET ALTERNATIVES BACKGROUND EXECUTIVE SUMMARY ACRONYMS Alternative 4 - Commuter Rail – RITC Table 6-4 presents the potential funding sources, with high, moderate or no federal participation, to support the Regional Intermodal Transit Center component of this alternative. Much of this project has already secured funding;
the remaining unfunded amount is $68.6 million. TIGER grant funding could provide approximately 15 to 25 percent of the funding with the remaining 75 to 85 percent funded by a mix of state/ regional/local sources. The City of Hercules applied for a TIGER grant for the RITC in the 2016 round of grants, but was not selected. With a rating in the top three percent of grant applications, there is potential for success with modifications to the applications. The City may seek a debrief from USDOT to determine how to refine its application to be more competitive in future TIGER grant cycles.
Short/Medium-term $69 $41 (60.3%) $27 (39.7%) Table 6-4: Funding Approach Alternative 4 – RITC ($ millions) Source: WSP | Parsons Brinckerhoff Note: Approximately $41.4 million in funding has already been committed to the project by the State of California, regional partners and the City of Hercules, leaving a funding gap of $27.2 million.
MOVING FORWARD
Original PDF, page 49
| Base Year Dollars (millions) | Total Estimated Capital Cost | Federal Funding | State Funding | Regional / Local Funding | ||
|---|---|---|---|---|---|---|
| New Starts Grants | Cap and Trade | Combination | ||||
| Low End | High End | Low End | High End | |||
| Scenario 1: High Federal (50% share) | ||||||
| Alternative 6A | $3,582 | |||||
| Short-term $56 $56 (100%) $56 (100%) Medium-term $74 $3 (5%) 28 (50%) $46 (50%) $71 (95%) Long-term $3,452 $1,726 (50%) $1,726 (50%) $1,726 (50%) | ||||||
| Scenario 2: Moderate Federal (30% share) | ||||||
| Alternative 6A | $3,582 | |||||
| Short-term $56 $56 (100%) $56 (100%) Medium-term $74 $3 (5%) 28 (50%) $46 (50%) $71 (95%) Long-term $3,452 $1,036 (30%) $2,416 (70%) $2,416 (70%) | ||||||
| Scenario 3: No Federal (0% share) | ||||||
| Alternative 6A | $3,582 |
WEST COUNTY HIGH-CAPACITY TRANSIT STUDY | MAY 2017 OUTREACH TRANSIT MARKET ALTERNATIVES BACKGROUND EXECUTIVE SUMMARY ACRONYMS Alternatives 6A and 6B – BART Extension Table 6-5 and Table 6-6 summarize the combination of funding sources required for the capital costs of Alternatives 6A and 6B. Three funding scenarios are presented assuming high, moderate, and no federal participation.
Short-term improvements for these alternatives will need to be funded from funding sources readily available at the regional and local level including the STMP. These improvements include preliminary engineering design and environmental review to select alignment and potential station locations, and early right-of-way acquisition (with environmental clearance).
Medium-term improvements, beginning of design and construction, could be funded from a combination of the cap- and-trade program and regional and local sources. The cap-and-trade program may provide between 5 percent and 50 percent of the funding. The remainder will need to be supported with regional and local funding sources.
New Starts grants could support a portion of the long-term costs of the BART alternatives. In practice, however, grant amounts have been much less than the statutory maximums, especially for very costly projects. Historically, New Starts applicants have received grants equal to approximately 50 percent of the capital cost of projects, but lately, due to constrained nature of federal funds, the federal participation rate in projects with a cost greater than $1 billion has ranged between 30 and 45 percent. To the extent that the amount of federal grant funds awarded is lower, the remaining share of capital costs and all O&M costs would require greater state and local funding. If a BART project were to succeed in securing a federal New Starts grant equal to 30 percent of the project cost, the remaining 70 percent or as much as $2 billion would need to be covered by state, regional, and local funding sources. This will require the project to be supported as a regional priority to get the large amount of state, regional and local funds needed.
In the medium- and long-term, once the project is more clearly defined and a schedule for project development and implementation has been identified, federal and state funds become more viable funding options if the project proves to be competitive in terms of ridership, cost-effectiveness, and regional or statewide significance. The ability to show an impact on relieving travel demand on the I-80 corridor, which is of regional and statewide significance, would be a critical factor in advancing the projects identified in the study for funding.
Short-term $56 $56 (100%) $56 (100%) Medium-term $74 $3 (5%) 28 (50%) $46 (50%) $71 (95%) Long-term $3,452 $3,452 (100%) $3,452 (100%) Table 6-5: Funding Approach Alternative 6A – BART Extension via Rumrill Boulevard ($ millions) Source: WSP | Parsons Brinckerhoff MOVING FORWARD
Original PDF, page 50
| Base Year Dollars (millions) | Total Estimated Capital Cost | Federal Funding | State Funding | Regional / Local Funding | ||
|---|---|---|---|---|---|---|
| New Starts Grants | Cap and Trade | Combination | ||||
| Low End | High End | Low End | High End | |||
| Scenario 1: High Federal (50% share) | ||||||
| Alternative 6B | $4,156 | |||||
| Short-term $69 $69 (100%) $69 (100%) Medium-term $92 $5 (5%) $46 (50%) $46 (50%) $87 (95%) Long-term $3,995 $1,998 (50%) $1,998 (50%) $1,998 (50%) | ||||||
| Scenario 2: Moderate Federal (30% share) | ||||||
| Alternative 6B | $4,156 | |||||
| Short-term $69 $69 (100%) $69 (100%) Medium-term $92 $5 (5%) $46 (50%) $46 (50%) $87 (95%) Long-term $3,995 $1,199 (30%) $2,797 (70%) $2,797 (70%) | ||||||
| Scenario 3: No Federal (0% share) | ||||||
| Alternative 6B | $4,156 |
WEST COUNTY HIGH-CAPACITY TRANSIT STUDY | MAY 2017 OUTREACH TRANSIT MARKET ALTERNATIVES BACKGROUND EXECUTIVE SUMMARY ACRONYMS Alternatives 6A and 6B – BART Extension (Continued) Short-term $69 $69 (100%) $69 (100%) Medium-term $92 $5 (5%) $46 (50%) $46 (50%) $87 (95%) Long-term $3,995 $3,995 (100%) $3,995 (100%) Table 6-6: Funding Approach Alternative 6B – BART Extension via Richmond Parkway ($ millions) Source: WSP | Parsons Brinckerhoff MOVING FORWARD
Original PDF, page 51
WEST COUNTY HIGH-CAPACITY TRANSIT STUDY | MAY 2017 OUTREACH TRANSIT MARKET ALTERNATIVES MOVING FORWARD BACKGROUND EXECUTIVE SUMMARY ACRONYMS
- West Contra Costa High-Capacity
Transit Study, Technical Memorandum #6, Existing and Future Land Use Conditions, September 2015, WSP | Parsons Brinckerhoff and Economic & Planning Systems.
- MTC, Vital Signs, December
2015, http://mtc.ca.gov/whats- happening/news/fresh-data-bay- areas-vital-signs-include-new- top-10-list-freeway-congestion
- West Contra Costa High-Capacity
Transit Study, Technical Memorandum #7, Travel Markets, January 2016, WSP | Parsons Brinckerhoff, Kimley Horn, and Kittelson & Associates.
- West Contra Costa High-Capacity
Transit Study, Technical Memorandum #12, Ridership Modeling, January 2017, WSP | Parsons Brinckerhoff and Kittelson & Associates.
- BART Metro Vision, 2014.
- West Contra Costa High-
Capacity Transit Study, Final Technical Memorandum #4, Summary and Evaluation of Previous Studies, September 2015, Parsons Brinckerhoff.
- West Contra Costa High-Capacity
Transit Study Final Technical Memorandum #5, Existing and Planned Transportation Network, January 2016, Parsons Brinckerhoff.
- West Contra Costa High-Capacity
Transit Study, Final Technical Memorandum #6, Existing and Future Land Use Conditions, September 2015, Parsons Brinckerhoff with Economic & Planning Systems (EPS).
- West Contra Costa High-Capacity
Transit Study, Technical Memorandum #7, Travel Markets, January 2016, WSP | Parsons Brinckerhoff, Kimley Horn, and Kittelson & Associates.
- West Contra Costa High-Capacity
Transit Study, Technical Memorandum #8, Preliminary Alternatives, January 2016, WSP | Parsons Brinckerhoff, Kimley Horn, and RL Banks. West Contra Costa High- Capacity Transit Study, Technical Memorandum #10, Preliminary Evaluation and Screening, May 2016, WSP | Parsons Brinckerhoff, Kimley Horn, and MLee Corporation.
- West Contra Costa High-Capacity
Study Task Number 13.1 Preliminary Screening Cost Estimates, December 8, 2015, M Lee Corporation and WSP | Parsons Brinckerhoff.
- West Contra Costa High-
Capacity Transit Study, Technical Memorandum #5, Existing and Planned Transportation Network, January 2016, WCCTAC.
- Travel demand data provided by AirSage from cell phone data collected in the Bay Area and communities to the north in fall 2015.
- Total unadjusted daily person trips from Contra Costa County travel demand model. Provided by Kittelson and Associates, January 2016.
- Urban Densities and Transit: A
Multi-dimensional Perspective, 2011, Cervero & Guerra. http://www.its. berkeley.edu/publications/UCB/2011/ VWP/UCB-ITS-VWP-2011-6.pdf
- Publications such as TCRP Report
167, Making Effective Fixed-Guideway Transit Investments: Indicators of Success (http://www.trb.org/ Publications/Blurbs/170972.aspx) present various density thresholds used by different jurisdictions around the country that underline the lack of a specific number or range that could be used as an absolute threshold to determine optimal density that would support transit.
- The Perils of Average Density,
September 2010, Walker, http:// humantransit.org/2010/09/the- perils-of-average-density.html
- The Perils of Average Density,
September 2010, Walker, http:// humantransit.org/2010/09/the- perils-of-average-density.html
- West Contra Costs High-Capacity
Study, Final Draft Technical Memorandum #8, Preliminary Alternatives, January 2016, WSP | Parsons Brinckerhoff with Kimley-Horn and RL Banks.
- West Contra Costs High-Capacity
Study, Final Draft Technical Memorandum #9, Evaluation Criteria, December 2015, WSP | Parsons Brinckerhoff with Kimley-Horn.
- West Contra Costa High-Capacity
Study, Final Draft Technical Memorandum #10, Preliminary Evaluation and Screening, May 19, 2016, WSP | Parsons Brinckerhoff with Kimley-Horn and M Lee Corporation.
- A summary of public input can be found in the study’s Public Outreach
Summary Report, April 2016.
- West Contra Costa High-
Capacity Transit Study, Technical Memorandum #11, Alternatives Refinement, November 2016, WSP | Parsons Brinckerhoff with Kimley-Horn and WCCTAC.
- West Contra Costa High-
Capacity Transit Study, Final Technical Memorandum #14, Funding Strategy, March 2017, WSP | Parsons Brinckerhoff.
- West Contra Costa High-Capacity
Transit Study, Technical Memorandum #14, Funding Strategy, March 2017, WSP | Parsons Brinckerhoff.
References
Original PDF, page 52
WEST COUNTY HIGH-CAPACITY TRANSIT STUDY | MAY 2017 OUTREACH TRANSIT MARKET ALTERNATIVES MOVING FORWARD BACKGROUND EXECUTIVE SUMMARY ACRONYMS
- West Contra Costa County High-
Capacity Transit Corridor Study Scope of Work, June 1, 2015, WSP | Parsons Brinckerhoff.
- West Contra Costa High-Capacity
Study Final Technical Memorandum #2, Goals and Objectives, September 2015, WSP | Parsons Brinckerhoff and Kimley-Horn
- West Contra Costa High-
Capacity Transit Study Final Technical Memorandum #3, Strategic Communications and Outreach Plan, September 2015, WSP | Parsons Brinckerhoff with Circlepoint and Vallier Design
- West Contra Costa High-
Capacity Transit Study Final Technical Memorandum #4, Summary and Evaluation of Prior Studies, September 2015, WSP | Parsons Brinckerhoff
- West Contra Costa High-Capacity
Transit Study Final Technical Memorandum #5, Existing and Planned Transportation Network, January 2016, WSP | Parsons Brinckerhoff with RL Banks and Kimley-Horn
- West Contra Costa High-Capacity
Transit Study Final Technical Memorandum #6, Existing and Future Land Use Conditions, September 2015, WSP | Parsons Brinckerhoff with Economic & Planning Systems (EPS)
- West Contra Costa High-Capacity
Transit Study Final Technical Memorandum #7, Travel Markets, January 2016, WSP | Parsons Brinckerhoff with Kimley-Horn and Kittelson Associates
- West Contra Costa High-Capacity
Transit Study Final Technical Memorandum #8, Preliminary Alternatives, January 2016, WSP | Parsons Brinckerhoff with Kimley-Horn and RL Banks
- West Contra Costa High-Capacity
Transit Study Final Technical Memorandum #9, Summary and Evaluation of Prior Studies, January 2016, WSP | Parsons Brinckerhoff 10. West Contra Costa High- Capacity Transit Study Final Technical Memorandum #10, Preliminary Evaluation and Screening, May 19, 2016, WSP | Parsons Brinckerhoff with Kimley- Horn and M Lee Corporation
- West Contra Costa High-Capacity
Transit Study Final Technical Memorandum #11, Alternatives Refinement, November 2016, WSP | Parsons Brinckerhoff with Kimley-Horn and WCCTAC
- West Contra Costa High-
Capacity Transit Study Final Technical Memorandum #12, Ridership Estimates, February 2017, WSP | Parsons Brinckerhoff with Kittelson Associates
- West Contra Costa High-Capacity
Transit Study Task Number 13.1, Preliminary Screening Cost Estimate, December 18, 2015, WSP | Parsons Brinckerhoff with M Lee Corporation
- West Contra Costa High-Capacity
Transit Study Task Number 13.2, Refined Preliminary Screening Cost Estimate, March 24, 2017, WSP | Parsons Brinckerhoff with M Lee Corporation
- West Contra Costa High-
Capacity Transit Study Final Technical Memorandum #14, Funding Strategy, March 2017, WSP | Parsons Brinckerhoff
- West Contra Costa High-Capacity
Transit Study Final Technical Memorandum #15, Final Evaluation, Technical Memorandum #15, March 2017, WSP | Parsons Brinckerhoff with Kimley-Horn
- West Contra Costa High-Capacity
Transit Study April 2016 Public Outreach Summary Report and Appendix, April 2016, WSP | Parsons Brinckerhoff with Circlepoint
- West Contra Costa High-Capacity
Transit Study April 2017 Council Presentations and Survey #2 Outreach Report and Appendix, April 2017, WSP | Parsons Brinckerhoff with Circlepoint
Technical Memoranda Prepared for the High-Capacity Transit Study
Original PDF, page 53
WEST COUNTY HIGH-CAPACITY TRANSIT STUDY | MAY 2017 OUTREACH TRANSIT MARKET ALTERNATIVES MOVING FORWARD BACKGROUND EXECUTIVE SUMMARY ACRONYMS WCCTAC Board of Directors City of El Cerrito Janet Abelson, Chair City of San Pablo Cecilia Valdez, Vice Chair City of Richmond Tom Butt City of Richmond Eduardo Martinez City of Pinole Roy Swearingen City of Hercules Chris Kelly AC Transit Chris Peeples AC Transit Joe Wallace BART Lateefa Simon WestCAT Maureen Powers Contra Costa County John Gioia Former Board Members City of Hercules Sherry McCoy City of Richmond Vinay Pimple BART Zakhary Mallett WCCTAC Executive Director John Nemeth WCCTAC Project Manager Leah Greenblat WCCTAC Administrative Assistant Valerie Jerkins
Acknowledgments
Original PDF, page 54
WEST COUNTY HIGH-CAPACITY TRANSIT STUDY | MAY 2017 OUTREACH TRANSIT MARKET ALTERNATIVES MOVING FORWARD BACKGROUND EXECUTIVE SUMMARY ACRONYMS AC Transit Jim Cunradi Nathan Landau BART Nikki Foletta Ryan Greene-Roesel Shannon Hake Jennella Sambour-Wallace Andrew Tang Caltrans Wingate Lew Capitol Corridor/Amtrak Shirley Qian CCTA Peter Engel Matt Kelly Linsey Willis City of El Cerrito Yvetteh Ortiz City of Hercules David Biggs Mike Roberts Holly Smyth City of Pinole Tamara Miller Winston Rhodes City of Richmond Yader Bermudez Richard Lee Lori Reese-Brown City of San Pablo Barbara Hawkins Michele Rodriguez Contra Costa County John Cunningham Robert Sarmiento WestCAT Charlie Anderson Julia Schnell Rob Thompson CONSULTANT STUDY TEAM WSP | Parsons Brinckerhoff Rebecca Kohlstrand, Project Manager Arianna Allahyar Dan Beard Michele Bellows Lyne-Marie Bouvet Andrea Glerum Jessie Jones Yadira La Luz Doris Lee Nathan Macek Dean Maniti Paul McCauley Pat McNamee Pat Merrill Salvador Montes Sharmila Mukherjee Kit Powis Gregory Schwartzkopf Michael Stanwick Tam Tran Miriam Zaki Circlepoint Tracy Cook Amie Holbrook Amy Huang Sabrina Morales Ivy Morrison Nguyen Pham Economic & Planning Systems Edward Sullivan Kimley-Horn Jeff Allen Adam Dankberg Alex Lange Zach Miller Kittelson & Associates Mike Aronson Damian Stefanakis Lillian Tsang M Lee Corporation Franklin Lee Martin Lee Davina Tsai R.L. Banks & Associates Tom Messer Vallier Design Associates Nick Burke Yutti Jirachachavalwong Marcia Vallier
Acknowledgments (cont’d)
Original PDF, page 56
West Contra Costa High-Capacity Transit Study l Final Report l May 2017
http://www.wcctac.org
In the same set
The original file
Everything above is the content of the original document, published here as a web page so it can be read, searched, translated and used with a screen reader. The original PDF is kept as the authoritative record.