

West Contra Costa Transportation Commission
Express Bus Study — appendices
The supporting analysis behind the final plan: demand, running times, costs and the route-by-route detail.
Appendix · Final draft · 2020 · 73 figures · about 278 min to read
The supporting analysis behind the final plan: demand, running times, costs and the route-by-route detail.
Current — In force. This is the version to rely on. The last published draft; nothing later has been issued.
® ®
WEST CONTRA COSTA COUNTY
EXPRESS BUS IMPLEMENTATION PLAN Final Plan | February 2020
A. Analytical Methodologies
B. Background Studies and Travel Data Technical Memorandum
C. Outreach Summaries and Materials
D. Proposed Stop and Intersection Improvements
E. Conceptual Layouts and Cost Estimates
F. Bicycle/Pedestrian Gaps Analysis
G. Operations and Maintenance Memorandum
H. Financial Plan
® ®
WEST CONTRA COSTA COUNTY
EXPRESS BUS IMPLEMENTATION PLAN A.
ANALYTICAL
METHODOLOGIES
Final Plan | February 2020
® ®
WEST CONTRA COSTA COUNTY
EXPRESS BUS IMPLEMENTATION PLAN Final Plan | February 2020
A. ANALYTICAL METHODOLOGIES
Transit Market Size Methodology
Market size is defined as the number of people who travel between the origin and destination areas for their work commute. This represents the current universe of potential users of the transit service. This total was developed using a product of the U.S. Census, the Longitudinal Employer Household Dynamics program (LEHD) using 2017 data. This database reports places of residence of employment for employed persons age 16 and older. Because resolution of the survey is available at the census block level, it permits users of the data to estimate how many people live in one geographic area and work in another. People were considered to be likely users of transit if they lived within the “walkshed” (a distance that one might reasonably walk) of an on-street bus stop, or within the “driveshed” of a transit center or mobility hub. For the purposes of this report, the bus stop walkshed was assumed to be 0.25 miles and the transit center/mobility hub driveshed was 2.5 miles. Both figures were based on existing research regarding transit use in the Bay Area. While it is possible to bike to transit, allowing for a larger number of people to access a stop, few people are likely to choose to lock up a bicycle at an on-street stop for the duration of the work day. Anyone choosing to bike to a transit center or mobility hub, where secure bicycle parking is proposed, would have been captured in the driveshed analysis.
It should be noted that market size, as described above, is not intended to be an estimate of the number of people who would ride the proposed express service after implementation and should not be used as a substitute for such a ridership projection. The decision for any individual to ride transit is complicated and may depend on a complex interaction of a variety of factors, such as income, age, auto ownership, perceptions of transit, price sensitivity, cost and availability of parking, and travel time.
The methodology for calculating market size does not account for many of the factors listed above. Therefore, while market size is correlated to ridership, the magnitude of that correlation may vary based on a variety of factors. While market size might not change over time, other factors which are known to influence mode choice may, such as increasing auto congestion, priority granted to transit vehicles, transit fares, additional pedestrian/bicycle infrastructure, and the price of tolls/parking. If the quality of auto-based commutes remains the same or declines while the quality of transit commutes improves, some people are likely to switch modes.
Because of the uncertainty regarding conditions that will determine future ridership and the lack of travel demand modeling that would effectively forecast ridership, transit market size was used in the prioritization methodology for this project.
Transit Market Size Analysis Assumptions and Limitations
Market size estimates are based on several assumptions. Those assumptions are detailed below: LEHD data used to develop the market size was collected in 2017. This represents a snapshot of the number of people who currently live and work along the proposed route alignment, and not a prediction of the number at any future date. Many factors might cause these totals to be higher or lower in the future. Denser residential uses in West County and growing employment in Alameda County would lead to higher market sizes. On the other hand, additional employment being located in West County or infill housing in Alameda County might cause a reduction in market size as current long-distance commuters change jobs or move houses to live closer to their place of work. Lastly, all origin routes assume the development of the proposed mobility hubs, allowing potential riders who live outside of walking distance to an on-street stop to still use the service. If the mobility hubs proposed for each route are not brought into operation, the market size for each route would be smaller.
LEHD data has inherent limitations when used for these purposes. Some of the limitations below likely result in an overstatement of market size, others in an understatement, and other have a mixed effect.
The following factors are likely to result in the market size being overstated.
- LEHD data does not distinguish between employees who commute during the peak hour and those who commute at off-peak times, including many employed in service sector work. The proposed peak hour, peak direction-only service would likely not serve the latter group of commuters.
- Some people must bring tools or specialized equipment to their place of work or require their vehicle to travel between jobsites during the workday. Beyond being able to carry on a bag, briefcase, or backpack, express bus service would not be suitable for the movement of heavy of bulky items.
The following factors result in the market size being understated:
- As described above, market size is defined by people who live and work within a short walk of origin and destination stops (the “walkshed”).
While this boundary is based in research and aims to capture the bulk of people who walk to and from transit, it fails to capture those who are willing and able to work longer distances or may make use of other mobility-enhancing devices to extend their range, either to the origin bus stop or from the destination. All four of the proposed express bus destinations (Oakland, Emeryville, Berkeley, and San Francisco) are home to a significant (and increasing) amount of bicycle infrastructure, and several of the destination stops are located near Bay Wheels bikeshare stations. All express buses purchased for proposed service are recommended to have bike racks allowing a limited number of riders to bring a bicycle with them. Additionally, improving battery technology has led to an uptake in small electric devices such as powered skateboards, scooters, and the like, many of which could may easily be carried aboard an express bus and stowed overhead.
- Students who commute for school are not counted by the LEHD, which surveys employees about their place of residence and place of work.
Accounting for students, particularly considering destinations served are near University of California and Laney College, would increase market size.
- A significant amount of peak-hour travel is undertaken by people not commuting to a job, but traveling for other reasons such as doctor’s visits, seeing family, visiting museums, etc. (according to Caltrain’s 2016 rider survey, thirteen percent of surveyed peak-hour riders were traveling for non-work reasons). While the proposed express bus service may not be the ideal option for these trips given its limited return hours, it could serve a purpose for transit-dependent individuals. All origins are reachable via existing transit with all-day service, so an individual would be able to ride the proposed express bus, likely shortening their trip, and later return on a combination of BART and local bus service.
- Market size is based on 2017 population and employment. The Bay Area is experiencing significant growth in employment and future plans have continued growth in population. Bay Area growth will both increase the market size over time, as well as lead to increasing congestion that will further enhance the desire for transit.
The following factors result in a mixed effect on the route market size:
- LEHD data reports the census block on which the workplace address is located. While this is frequently the location at which an employee is required to report for work, it may not be (such as in the case of a construction worker, security guard, or delivery driver). While this factor may overcount market size in some cases, it is equally likely to undercount it (if people whose workplace address is elsewhere but actually reports to work within the analyzed walkshed).
Original PDF, page 4
® ®
WEST CONTRA COSTA COUNTY
EXPRESS BUS IMPLEMENTATION PLAN Final Plan | February 2020
Travel Time Estimate Methodology
A set of travel time estimates was developed to allow comparison between the proposed route and existing options for commuters. For each route, a set of origin-destination (O-D) pairs was chosen, aiming to capture transit centers and mobility hubs in West County, and job centers in Alameda County and San Francisco. For each origin-destination pair travel time estimates were developed for commuters traveling by automobile, existing transit, and the proposed express bus service. The methodology for calculating each is described here.
Existing Auto
Travel times estimates were derived using the directions app Waze. For each O-D pair, an estimate was recorded for the most direct route departing at 7:30 A.M. on a Wednesday with no substantial traffic disruptions. Estimates were only made in the southbound direction of the A.M. commute. Note that these estimates do not account for the time it would take a driver to park their vehicle, which can be substantial and can vary significantly day-to-day. These estimates therefore represent a best-case scenario for driving time.
Existing Transit
Travel time estimates were derived using Google Maps. For each O-D pair, estimates were recorded for transit trips leaving after 7:00 A.M. and before 8:00 A.M. To account for the variability of transit travel times (which may differ because of longer or shorter connection times when transferring between transit vehicles, e.g. from WestCAT JPX bus route to BART at El Cerrito del Norte Station), an average was taken of all recommended routes. For each transfer required, 10 minutes were added to the total travel time to account the possibility of missed transfers and for higher total fare cost of the trip. Estimates were only made in the southbound direction for the A.M. commute.
Proposed Transit
Travel time estimates were developed for the proposed express bus service. This was done by separating each route into constituent segments (e.g. San Pablo Avenue from Tara Hills Drive to Richmond Parkway Transit Center) and then obtaining an estimate of travel time for each using the Waze app. All estimates assume a departure time of 7:30 A.M. on a Wednesday. These segment travel times were augmented by estimated dwell time for local stops and transit centers/mobility hubs. Each local stop along an alignment was assumed to incur a 30-second travel time penalty, and each transit center/mobility hub that requires a deviation incurred a two-minute travel time penalty. All freeway segments assume the use carpool lanes (an option in Waze) where available. After an estimate was derived for each segment in the proposed express bus network, those segments were summed based on each route’s alignment. None of the travel-time-improving capital improvements proposed in Chapter 6 were assumed in these calculations – if the recommended improvements were implemented, travel times would likely be lower than estimated here.
Travel Time Estimate Assumptions
Travel time estimates do not incorporate any assumptions about future congestion levels on the I-80 corridor. Though it is highly likely that the Bay Area will continue to grow in population, it is not known when each of the express routes would be brought into service and when various transportation projects will be implemented, and is thus hard to link to County-developed travel demand models. Changes in land use, bridge tolls, or the implementation of paid express lanes would all affect travel time. Rather than attempt to incorporate some or all of these contingencies, the travel time estimates were based in current conditions.
Route Prioritization
Route were prioritized by being assigned a “Competitiveness Score,” a function of (1) the route’s potential market size, (2) the travel time improvement between existing transit and proposed express bus service, and (3) whether a route ended in San Francisco.
Routes were ranked by the following equation. CS = MS (1 + TTI/2) * SF Competitiveness Score (CS) The Competitiveness Score is a function of market size, travel time, and destination. Research on the elasticity of transit ridership suggests that, on average, for everyone 1% decrease in travel time, ridership can be expected to increase by 0.5%. Market size acts as a baseline and is multiplied by 1 plus half the transit travel time improvement. Routes connecting West County to San Francisco are scaled up by an additional factor.
2017 Market Size (MS) To estimate potential market size, the U
S Census’s 2017 Longitudinal Employer-Household Dynamics (LEHD) data was used to determine the number of people who live within walking or driving distance from origin stops (in West County) and work within walking distance of destination stops (in Berkeley, Emeryville, Oakland, and San Francisco).
Existing Transit Travel Time To determine the difference between existing transit travel times and those with the proposed service, a series of locations along each route was selected for both origin alignments and destination alignments. Google Maps was used to determine the travel times between each origin- destination pair using existing transit.
Proposed Express Bus Travel Time Express bus travel time was determined by using Waze to estimate the travel time for the various segments of each route, assuming typical levels of traffic at 7:30 a.m. Travel times were adjusted to account for dwell time.
Average Travel Time Improvement (TTI) A percent improvement was calculated for each origin-destination pair. The travel time improvement for each pair on the route was averaged to obtain a single average travel time improvement percentage for each route.
San Francisco Factor (SF) When choosing whether to commute via transit or by car, the marginal cost of a trip plays a large role, both in time costs (congestion, time spent looking for parking) and financial costs (tolls, parking fees). When driving feels free or cheap, people will be more likely to travel by car, all else being equal. To account for the presence of the San Francisco-Oakland Bay Bridge toll as well as the added difficulty and cost of parking in San Francisco relative to the East Bay, an additional factor of 1.33 was included for routes traveling between West County and San Francisco. This factor was derived based on existing modal choices for trips between West County and San Francisco and between West County and Alameda County.
Original PDF, page 5
® ®
WEST CONTRA COSTA COUNTY
EXPRESS BUS IMPLEMENTATION PLAN Final Plan | February 2020
Equity Analysis
To determine whether the proposed express bus service would be serving a representative population of West Contra Costa County, an analysis was conducted to compare those living within the walkshed area of proposed routes with the entire study area.
Population Characteristics
The service population was compared to the wider West County population on the following bases:
- Low- or Moderate-Income individuals, as defined by U.S. Department of Housing and Urban Development Community Development Blog
Grant (CDBG) Program (ACS 5-Year 2011-2015 Summary Data). As defined by this program, low-income individuals are those that live in households making less than 50% of the area median income (AMI). Moderate-income individuals are those that live in households making between 50% and 80% AMI.
- Minority Individuals, defined here as Hispanic or Latino individuals or non-Hispanic or Latino individuals who identified as a race other than “White alone” (ACS 5-Year 2013-2017)
- Carless Households, defined as households with no vehicle available (ACS 5-Year 2013-2017)
Analysis Area
A GIS analysis was conducted to estimate the number of people or households in each group that reside within 0.5 miles of the origin side of each route (i.e. the part of the alignment in West County). The walkshed of 0.5 miles represents a reasonable distance for walk or bike access to the transit service. Additional users are likely to access the service via bike, car, or other mode, but are not considered for the purpose of this analysis. Routes were grouped by those proposed for the near-term (Routes 2, 4, 6, and 7) and all routes (1-8). The proposed near-term routes would serve the following existing transit centers and corridors:
- Hercules Transit Center
- Richmond Parkway Transit Center
- San Pablo Avenue/Richmond Parkway between Pinole Shores Drive and I-80
- San Pablo Avenue/23rd Street/Macdonald Avenue between Rumrill Boulevard and I-80
Due to the significant overlap between the origin sides of the near-term and medium/long-term routes, the only additional corridor in West County served by one of the eight proposed routes, but not served by a near-term route, would be the following:
- Rumrill Boulevard/13th Street/Harbour Way between San Pablo Avenue and Wright Avenue
Original PDF, page 6
® ®
WEST CONTRA COSTA COUNTY
EXPRESS BUS IMPLEMENTATION PLAN B.
BACKGROUND
STUDIES AND TRAVEL
DATA TECHNICAL
MEMORANDUM
Final Plan | February 2020
Background Studies and Travel Data | October 2018
MEMORANDUM ‐ DRAFT
To: From: Re: Date: Leah Greenblat, Project Manager WCCTAC Adam Dankberg, P.E. Kimley‐Horn and Associates, Inc. Background Studies and Travel Data Technical Memorandum, WCCTAC Express Bus Implementation Plan October 8, 2018
1 INTRODUCTION
As part of the first phase of the West Contra Costa Transportation Advisory Committee (WCCTAC) Express Bus Implementation Plan, Kimley‐Horn has conducted a review of existing conditions as they relate to express bus service opportunities. This includes the following:
Review of previous studies and planning work which may inform opportunities to expand express bus service in West Contra Costa County
Documentation of existing and planned transit services in the study area
Demographic characteristics of the study population
Analysis of existing travel patterns in the study area This memorandum serves to document this analysis, and will be used to support the development of draft route and stop locations as part of Task 3.2 of this project.
1.1 Study Area
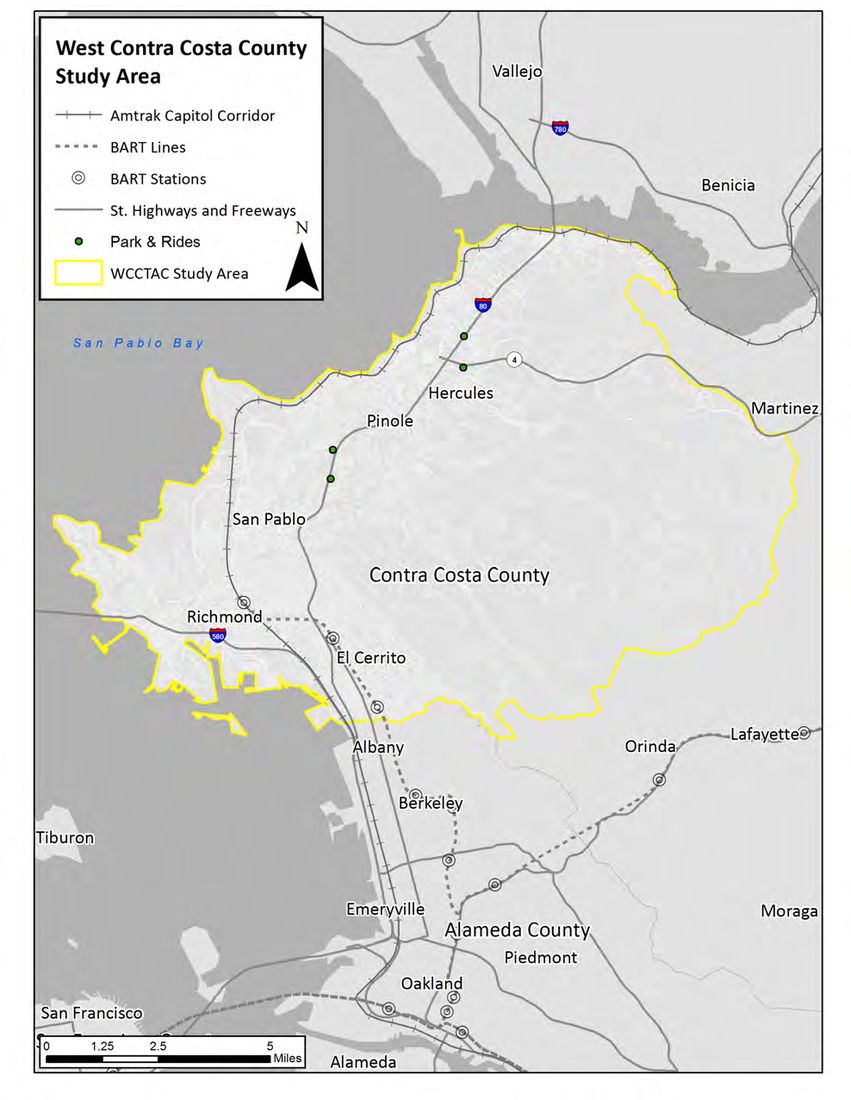
The study area for this Plan is western Contra Costa County (West County); this area is shown in Figure 1.
Original PDF, page 8
Background Studies and Travel Data | ® ®
WEST CONTRA COSTA COUNTY
EXPRESS BUS IMPLEMENTATION PLAN October 2018
Figure 1: Study Area
San Pablo Ave
Background Studies and Travel Data | October 2018
2 PREVIOUS STUDIES AND PLANNING WORK
Kimley‐Horn reviewed planning studies and other work completed in the study area to develop an understanding of the context in which this study is being conducted. Relevant findings and recommendations from these works are summarized in the following section.
2.1 West Contra Costa County High Capacity Transit Study
In 2015‐2017, WCCTAC performed a High Capacity Transit (HCT) Study to evaluate multi‐modal options to enhance transit connectivity and accessibility and to plan for future growth. The HCT study served to set the framework for this Express Bus Study. The goals of the HCT study included improving the frequency, reliability, and equity of transit services. The study focused on initially five travel corridors within West County: the I‐80 and I‐580 freeway corridors, the major north‐south spines of San Pablo Avenue and 23rd Street, and the Union Pacific Railroad alignment extending north from the Richmond BART station. Various high capacity modal alternatives for these corridors, including associated capital improvement and service scenarios, were considered. (Expanded ferry service from the Hercules area across the bay to San Francisco was another proposed travel corridor initially identified but not an alternative included for detailed evaluation in the HCT Study. It is the subject of other regional transit improvement studies.)
After a series of outreach efforts and refinement and evaluation of a broad range of alternatives, five alternatives were chosen for further refinement and evaluation and ultimately included in the final report.
The five alternatives included:
- Express Bus on I‐80;
- San Pablo Avenue/Macdonald Avenue BRT;
- 23rd Street BRT;
- UPRR Commuter Rail (short + mid‐range options); and
- BART Extension from Richmond.
The final report provided direction on next steps for each of the alternatives as well as provided information on estimated ridership and costs for each alternative.
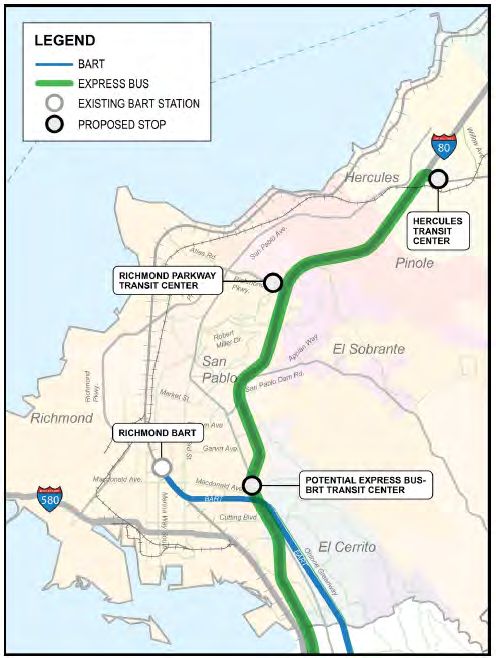
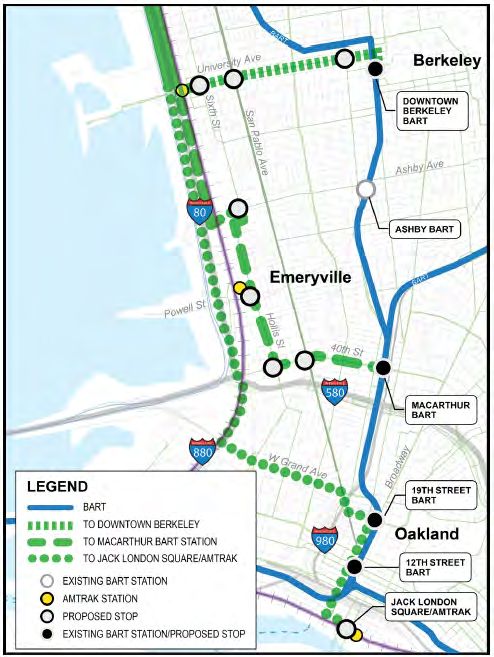
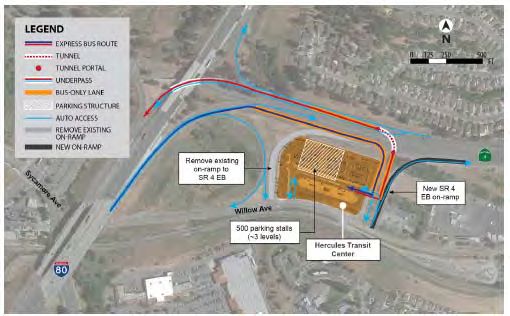
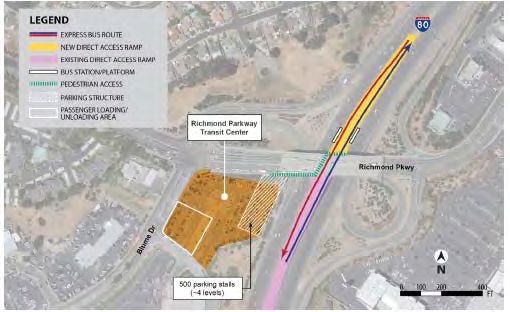
Alternative 1: Express Bus on I‐80 provided recommendations for an express, freeway‐based service on I‐80 that would operate from the Hercules Transit Center to Berkeley, Emeryville, and Oakland. The alternative would also increase service frequency to San Francisco (e.g., on the WestCAT Lynx and/or AC Transit Transbay Line L). In West County, the proposed service would have additional stops at the Richmond Parkway Transit Center and a potential I‐80/Macdonald Avenue Transit Center (see Figure 2). The study recommended longer term park and ride circulation and freeway access improvements, including restricted ramps that would make it easier for buses to move in and out of the high occupancy vehicle (HOV) lanes. Proposed bus routes in Berkeley, Emeryville, and Oakland are shown in Figure 2. Proposed park‐and‐ride and freeway ramp improvements are shown in Figure 3 and Figure 4.
For this alternative, the study projected ridership would increase to over 1,000 weekday daily boardings by 2020, and over 1,500 boardings by 2040. The associated projected costs were broken down by how soon elements of the alternative could be incrementally implemented: short‐term (less than 5 years); medium‐term (5 to 15 years); and long‐term projections (over 15 years). The details of the elements and costs are shown in Figure 5.
Original PDF, page 10
Background Studies and Travel Data | October 2018 A phased implementation approach was suggested for serving travel to and from Berkeley, Emeryville, and Oakland. Expanding direct bus service to these areas was determined to be a viable, low‐cost option that can be implemented easily. Given congestion along I‐80, a high functioning bus lane on the freeway would allow for effective express bus service at a relatively low cost per rider. In addition to enhancing existing express bus service to San Francisco, introducing new fast and direct service to East Bay cities in Alameda County would have immediate benefits for many West County commuters to these areas.
Alternative 1 was recommended for implementation in the near term and provides the foundation for this study. Figure 2: WCCTAC HCT Study Express Bus Recommended Service Source: West Contra Costa High Capacity Transit Study (2017)
Original PDF, page 11
Background Studies and Travel Data | October 2018 Figure 3: Proposed Ramp Improvements at Hercules Transit Center (West Contra Costa High Capacity Transit Study, 2017) Figure 4: Proposed Ramp Improvements at Richmond Parkway Transit Center (West Contra Costa High Capacity Transit Study, 2017)
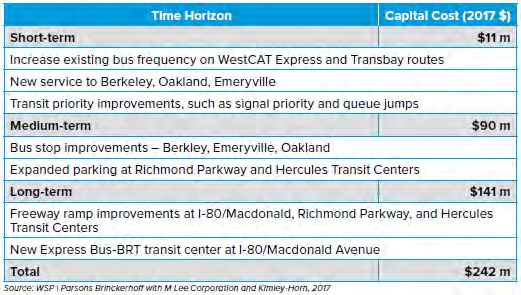
Background Studies and Travel Data | October 2018 Figure 5: HCT Express Bus Corridor Implementation Costs
2.2 I‐80 SMART Corridor Project
The I‐80 Integrated Corridor Mobility (ICM) Project implemented an Active Traffic Management (ATM) system along a 20.5 mile stretch of I‐80 between the Carquinez Bridge and the Bay Bridge. The main elements of the system included upgrades and integration of Intelligent Transportation System (ITS) elements on I‐80, parallel arterial routes, and connecting local roadways to improve travel time reliability and reduce accidents and associated congestion. Those elements included: incident management via overhead signs; traffic information boards showing regional congestion and travel times; ramp metering to smooth traffic merging; and local street signs to guide freeway detours around incidents.
Transit priority elements were also incorporated that benefit express bus service using I‐80, including preferential access treatments and transit priority. At highway entrances, preferential treatment would allow buses to bypass ramp meter signals as other HOV vehicles. The project implemented transit signal priority (TSP) systems along arterials connecting I‐80 to San Pablo Avenue that could be potentially be utilized by a new express bus service.
Some of the improvements have not been installed, or are not activated yet therefore specific locations would have to be identified if needed for any new Express Bus service recommendations.
2.3 CCTA Express Bus Study (2016)
The Contra Costa Transportation Authority (CCTA) initiated a study in 2016 that built off the 2001 Contra Costa Express Bus Study, which analyzed several corridors to document the need and establish a vision for express bus service. The 2016 study was a collaborative effort between all the county’s express bus operators, including AC Transit, WestCAT, Contra Costa County Transit Authority (County Connection), and Tri‐Delta Transit. The study focused on three main corridors: I‐80, I‐680, and Highway 4.
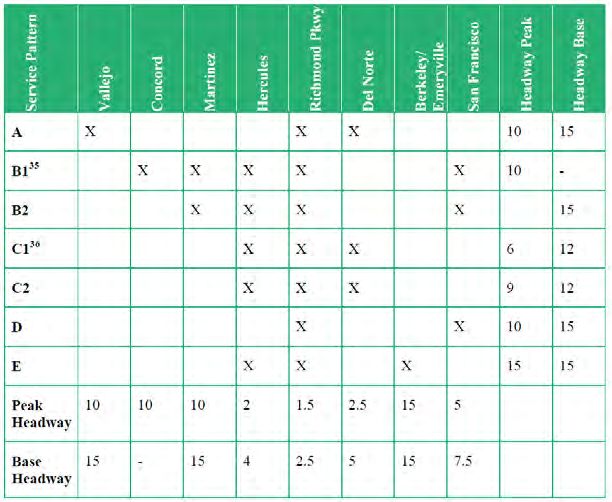
The service plan for I‐80 was combined with Highway 4 and proposed a series of express bus routes that would provide service from Martinez to West County and the Hercules Transit Center. The plan envisioned routes that enter the freeway at various points with destinations to El Cerrito Del Norte BART, Berkeley, Emeryville, and San Francisco. Proposed routes B1/B2, C1/C2, D, and E are documented in Figure 6. These routes would provide service
Original PDF, page 13
Background Studies and Travel Data | October 2018 from Hercules and Richmond Parkway to Berkeley/Emeryville and San Francisco. A map of proposed Route E, with service from Hercules and Richmond Parkway to Berkeley and Emeryville, is shown in Figure 7.
Figure 6: I‐80/Highway 4 Proposed Service Pattern (CCTA Express Bus Study, 2016)
Original PDF, page 14
Background Studies and Travel Data | October 2018 Figure 7: Proposed Route E (CCTA Express Bus Study, 2016)
Background Studies and Travel Data | October 2018
2.4 Grand MacArthur Transit Operations Analysis (Ongoing)
A number of AC Transit Transbay routes currently travel to San Francisco along westbound I‐580 using the Bay Bridge, which is very congested during most of the AM peak period. The Grand MacArthur Transit Operations Analysis is exploring diverting Transbay buses to use West Grand Avenue to reduce travel time delay and improve travel time reliability during commute periods. The study found that the optimal transit route varies by time of day and freeway conditions. Therefore, this analysis is considering a dynamic transit routing application that would provide a decision‐making process for Transbay buses to select the optimal route.
The project identified an interim solution as well as long‐term solution that would implement tools to demonstrate benefits to Transbay buses. The interim solution includes a web interface for AC Transit for real‐time traffic information as well as camera feeds at key points along West Grand Avenue. The long‐term solution could include automated decision tools that determine optimal routing with real‐time traffic integration with AC Transit’s CAD/AVL. Both solutions, if implemented along other corridors, could benefit current and future express bus routes from West County.
2.5 AC Transit Transbay Tomorrow
To address some long‐standing issues with overcrowding, and to update their service network, AC Transit developed the Transbay Tomorrow service plan. The plan reallocates existing resources based on number of vehicles and total hours of service in a cost neutral approach with some additional funds provided by the Metropolitan Transportation Commission’s (MTC) Bay Bridge Forward (BBF) Program. The plan uses various strategies to improve overcrowding, reliability, speed, and productivity of the service. In addition to adding vehicles and increasing frequency and span of service, stops are consolidated and routes are realigned to use major roads to increase speed and reliability.
The plan outlines that these strategies, although currently constrained by funding, can be implemented further as part of a larger set of unconstrained proposals for Transbay service expansion, should there be additional sources of funding identified.
2.6 San Pablo Avenue Complete Streets Project (Ongoing)
Alameda County Transportation Commission (ACTC) is conducting a complete streets study of San Pablo Avenue from downtown Oakland to Hilltop Mall. The project will propose multimodal improvements along (and potentially parallel to) San Pablo Avenue. These improvements will include bus facilities that could potentially be utilized by an express bus service proposed through this Plan. Bus improvements under consideration include exclusive lanes, transit signal priority, and queue jumps.
2.7 WCCTA Short‐Range Transit Plan (2016)
To obtain funding for transit services over the next ten years, the Western Contra Costa Transit Authority (WCCTA) adopted a Short‐Range Transit Plan (SRTP) that serves as a blueprint to meet current and future transit needs and demands for the community. WCCTA provides the WestCAT transit service; its service area includes the area of West Contra Costa County spanning from the Hilltop area to Crockett. Forecasted population growth, planned development changes, and a fiscally constrained budget are analyzed and balanced to develop the SRTP. The plan outlines current service levels and identified needs to be addressed including a financially unrestrained vision for the future that includes improving: service to Oakland/Emeryville; Lynx service to and from Pinole; service expansions throughout the area; increased weekend service; and service to Solano County.
Original PDF, page 16
Background Studies and Travel Data | October 2018 Oakland, Emeryville, and Berkeley are identified as having a strong commuter demand from the service area. The SRTP states that the majority of the morning trips in the service area are destined for the East Bay (primarily Oakland and UC Berkeley) and transfer to BART at the El Cerrito del Norte BART station. Preliminary results showed that an express route to the East Bay had potential demand. West Berkeley, downtown Oakland, and Emeryville’s commercial district were identified as having potential demand for an express route.
The SRTP also proposed the addition of express bus service between Pinole and San Francisco. The plan does not identify a specific park‐and‐ride location, but it notes that routing on an express bus service could be adjusted to serve local stops to alleviate the lack of a park‐and‐ride facility.
Both the proposed service to Pinole and potential express service to Oakland/Emeryville are considered part of WCCTA’s long‐term “vision,” which was developed without considering financial constraints; thus, these proposed services are considered long‐term goals and not yet being considered for implementation.
2.8 Emeryville‐Berkeley‐Oakland Transit Study (EBOTS)
The Emeryville‐Berkeley‐Oakland Transit Study (EBOTS) focused on cultivating an environment within the study corridor that would enhance the environment for transit, pedestrians, and bicyclists. The goals of the study included: creating an environment where a car is not required for mobility; creating a well‐connected and cohesive transit corridor; coordinating transit improvements with future population growth; implementing short‐term transit improvements; and enhancing long‐term mobility within the corridor.
Short‐term, mid‐term (5‐10 years), and long‐term (10‐20 years) improvements were identified that would benefit routes serving the EBOTS area, including express buses from West County. Short‐term improvements included:
expanding the West Berkeley shuttle; initiating a shuttle in West Oakland; and implementing bus stop upgrades and amenity improvements. Mid‐term improvements included an enhanced bus trunkline that would provide bi‐ directional service from Jack London Square to West Oakland BART and north through Emeryville and west Berkeley. Long‐term improvements included adding streetcar routes that would serve West Oakland BART and Jack London Square. These improvements showed a projected increase of 4,000‐7,000 transit trips and a reduction in total vehicle miles traveled (VMT) per line. The improvements would support an express bus service to the EBOTS area, providing connectivity that would effectively and conveniently expand access for all transit users.
3 EXISTING TRANSIT SERVICES
3.1 Existing Transit Services
A number of existing express transit services are already provided in the study area by both AC Transit and WestCAT. These services are documented below.
WestCAT
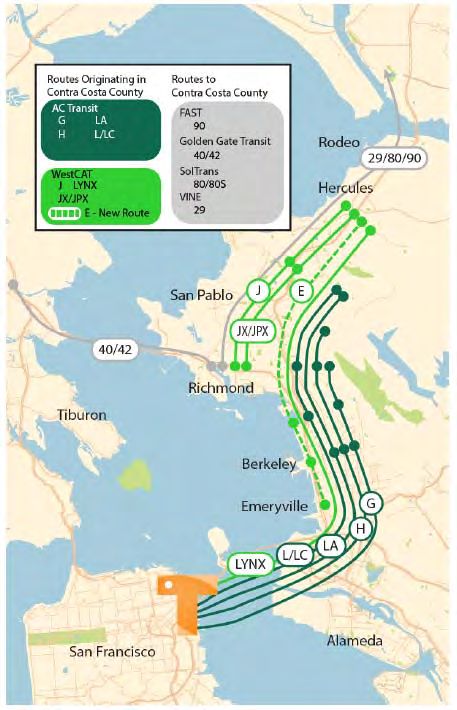
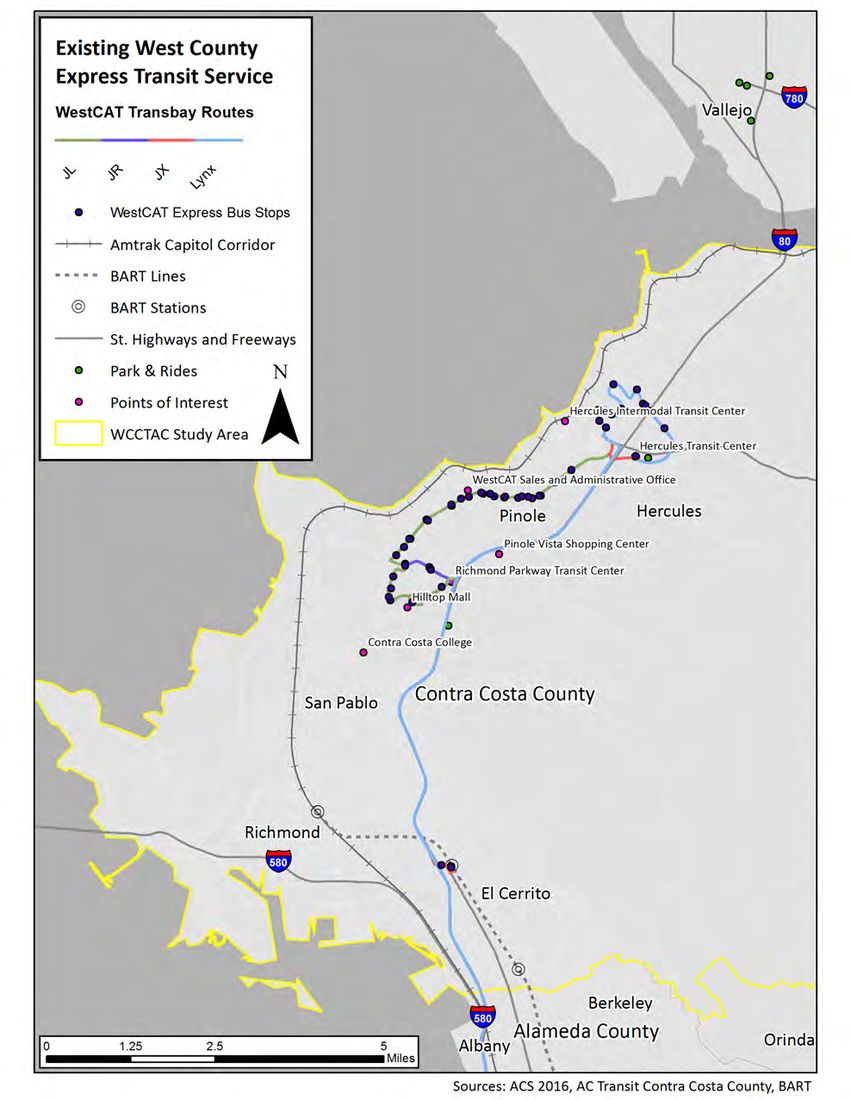
WestCAT provides the following express bus routes in West County, which are also depicted in Figure 8:
Routes JL/JR provide express bus service from Hercules, Pinole, and Tara Hills to El Cerrito del Norte BART. Both routes have a northern terminus at Hercules Transit Center and provide service along San Pablo Avenue in Hercules, Pinole, and Tara Hills. These routes diverge in northern Richmond, where route JL serves Hilltop Mall, while route JR serves Richmond Parkway Transit Center; both routes then travel straight to El Cerrito del Norte BART via I‐80. Service is provided all day in both directions.
Routes JX/JPX provide express bus service from Hercules to El Cerrito del Norte BART. Both routes have a northern terminus at Hercules Transit Center. Route JX provides direct, point‐to‐point service between
Original PDF, page 17
Background Studies and Travel Data | October 2018 Hercules Transit Center and El Cerrito del Norte BART via I‐80. Route JPX provides service along San Pablo Avenue and Tennent Avenue in Pinole, then follows I‐80 to El Cerrito del Norte. Non‐peak JPX trips also make additional stops along Fitzgerald Drive in Pinole and at Richmond Parkway Transit Center. Service is provided all day in both directions.
The Lynx is an express bus route service from various locations in Hercules to the Salesforce Transit Center in San Francisco. All trips serve the Hercules Transit Center; other locations in Hercules served at various points throughout the day include the Rodeo Park & Ride, Victoria Crescent, and BioRad.
AC Transit
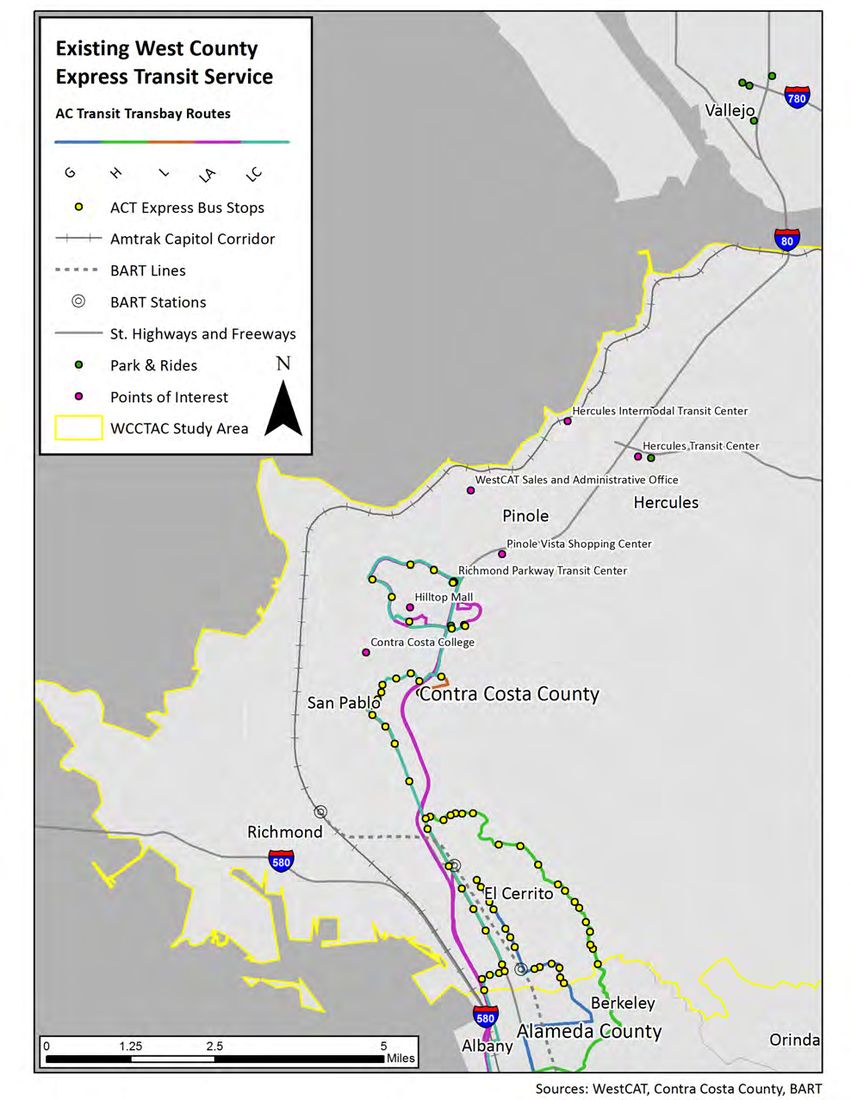
AC Transit has a network of bus lines that make local stops in various areas within its East Bay service area, then run an express segment on the regional freeway network to another transbay destination. These are branded as “Transbay” lines. All Transbay lines in the study area provide service to the Salesforce Transit Center in San Francisco. For all Transbay lines in the study area, only riders going to (or from) the Salesforce Transit Center may board (or alight) along the local segments; riders may not utilize the service to make local trips. The following Transbay lines provide service in West Contra Costa County; these are also depicted in Figure 9:
Line G provides service from Potrero Avenue & Richmond Street in El Cerrito to the Salesforce Transit Center; in the study area, it makes local stops in El Cerrito along Richmond Street and at El Cerrito Plaza BART. Line G makes additional local stops in Berkeley and Albany before heading to San Francisco via I‐80.
Line H provides service from Barrett Avenue & San Pablo Avenue in Richmond to the Salesforce Transit Center. In the study area, it makes local stops along Barrett Avenue and Arlington Boulevard in Richmond and El Cerrito. Line H makes additional local stops in Berkeley before heading to San Francisco via I‐80.
Line L provides service from Princeton Plaza Shopping Center in San Pablo to the Salesforce Transit Center. In the study area, it makes local stops in San Pablo along El Portal Drive, Church Lane, and San Pablo Avenue, and along San Pablo Avenue in Richmond and El Cerrito. It makes additional local stops in Albany before heading to San Francisco via I‐80.
Line LC provides service from Hilltop Park & Ride to the Salesforce Transit Center. It also makes local stops in Richmond at Hilltop Mall, Park Central & Hilltop Drive, and Richmond Parkway Transit Center before getting on I‐80; the route gets off I‐80 at El Portal Drive and makes local stops along Glenlock Street and Rollingwood Drive. South of Rollingwood Drive, Line LC has the same alignment as Line L.
Line LA provides service primarily from the Hilltop Park & Ride and the Richmond Parkway Transit Center to the Salesforce Transit Center. In the study area, it makes local stops at Hilltop Mall, Park Central & Hilltop Drive, and Richmond Parkway Transit Center before heading to San Francisco via I‐80.
Other Transit Services
Transit providers in other counties provide express bus service with destinations located within the study area. These include the following:
Golden Gate Transit’s Route 40/40X provides express bus service from San Rafael Transit Center to El Cerrito del Norte BART; it makes some local stops along Cutting Boulevard in Richmond. Trips on Route 40 also serve one stop in Point Richmond.
Vine Transit Route 29 provides express bus service to Vallejo Ferry Terminal and El Cerrito del Norte BART. Route 29 serves stops in Calistoga, St. Helena, Yountville, Napa, and American Canyon.
Fairfield and Suisun Transit’s (FAST) Green Express route provide express bus service from Fairfield and Suisun City to El Cerrito del Norte BART.
Original PDF, page 18
Background Studies and Travel Data | October 2018
Soltrans provides express bus service from locations in Vallejo to El Cerrito del Norte BART via Routes 80 and 82. In addition to express bus service, BART provides heavy rail service to the Richmond Transit Center in downtown Richmond providing access to downtown Berkeley, downtown Oakland, and San Francisco. The Capitol Corridor passenger rail line, operated by Amtrak, provides service from Sacramento to San Jose and makes stops at the Richmond Transit Center, Berkeley, Emeryville, and Jack London Square.
Original PDF, page 19
Background Studies and Travel Data | ® ®
WEST CONTRA COSTA COUNTY
EXPRESS BUS IMPLEMENTATION PLAN October 2018
Figure 8: Existing WestCAT Express Bus Service
San Pablo Ave
Background Studies and Travel Data | ® ®
WEST CONTRA COSTA COUNTY
EXPRESS BUS IMPLEMENTATION PLAN October 2018
Figure 9: Existing AC Transit Express Bus Service
San Pablo Ave
Background Studies and Travel Data | October 2018
3.2 Existing Transit Ridership
Ridership data is useful to evaluate the performance of existing routes and to project the ridership potential of new service in other areas. Data was supplied to Kimley‐Horn by a number of transit agencies. WestCAT provided ridership by route for express routes. AC Transit provided ridership by route, trip, and stop, as well as on‐board survey data. BART provided station‐level ridership and on‐board survey data.
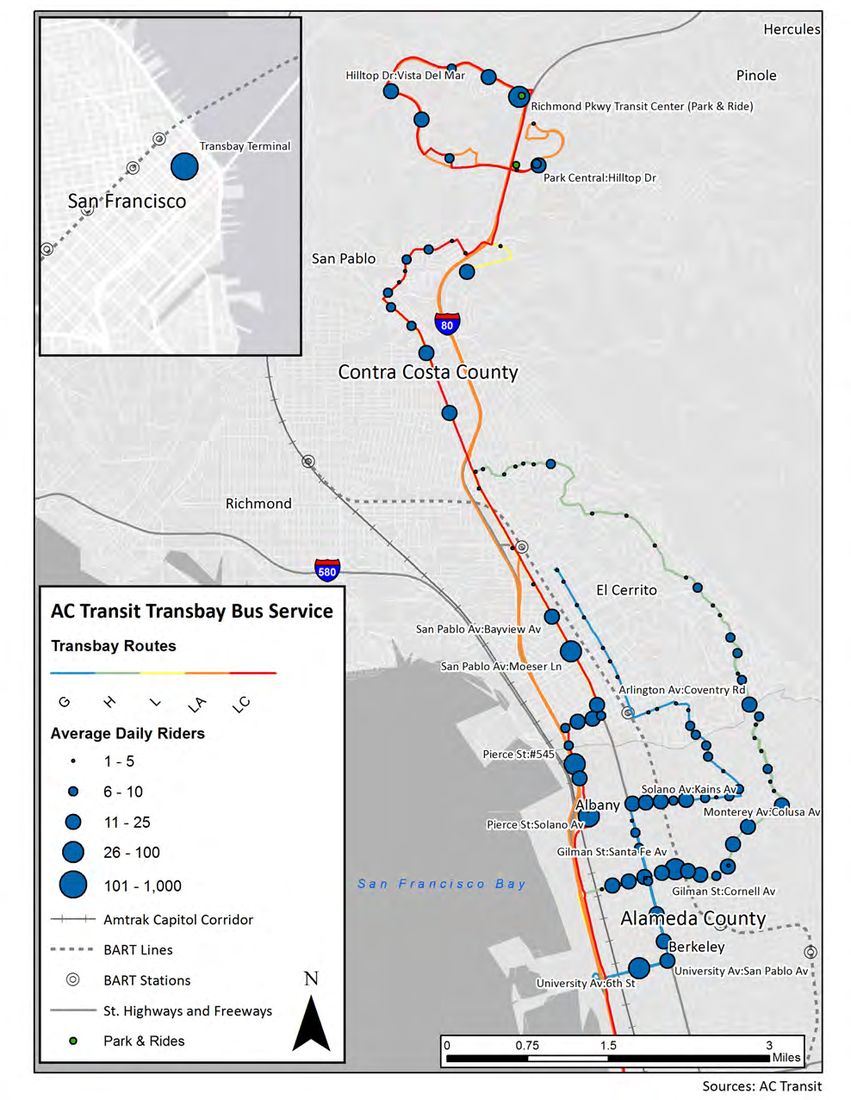
Table 1 shows the ridership by route for existing AC Transit and WestCAT express bus routes. Figure 10 shows ridership by stop for AC Transit Transbay routes; ridership data by stop was not available for WestCAT. In the study area, ridership on Transbay routes is highest at major transit centers and on stops along San Pablo Avenue. The highest ridership stops in the study area (accounting only for ridership generated by AC Transit Transbay routes) are listed below in Table 2.
Table 1: Ridership by Route (AC Transit, WestCAT) Provider Route Inbound Vehicle Trips Outbound Vehicle Trips Average Daily Riders AC Transit Transbay Routes G H LA Total 2,281 WestCAT Express and Transbay Routes JR/JL Express 1,211 JX Express JPX Express LYNX Transbay 1,110 Total 3,279 Table 2: Top 5 Ridership Stops in Study Area (AC Transit Transbay Ridership Only) Location Workers Richmond Parkway Transit Center San Pablo Ave & Moeser Ln (Richmond) Hilltop Dr & Vista Del Mar (Richmond) Park Central St & Hilltop Dr (El Sobrante) Arlington Ave & Coventry Rd (Kensington) Mode of access data was gleaned from on‐board survey data from AC Transit Transbay lines. Figure 11 shows bus access mode for Transbay riders boarding in the study area and heading to San Francisco; Figure 12 shows the bus access mode for Transbay riders boarding in San Francisco and heading to the study area. Mode of access data was not available for Line LC. For all AC Transit Transbay routes providing service in the study area, the vast majority of riders walk to reach their bus.
Original PDF, page 22
Background Studies and Travel Data | October 2018 Figure 13 shows the number of AC Transit Transbay riders who have access to an automobile; overall, only 49% of riders surveyed had access to a car.
Mode of access and demographic data was also collected in the 2017 WestCAT on‐board survey. Figure 14 shows the mode of access for WestCAT riders traveling from home to their first boarding point. Similar to the AC Transit Transbay lines, the vast majority (80%) of riders of WestCAT express routes (Routes JR/JL/JX/JPX) accessed the bus by walking. For WestCAT transbay service (Lynx), 30% of riders walked to their first boarding point while 26% were dropped off and 42% either drove alone and parked or carpooled and parked. Almost all riders accessed their non‐ home destination by walking – 93% and 96% of express and transbay riders, respectively.
Figure 15 shows the number of drivable vehicles available to WestCAT express and transbay riders. Only 17% of express riders and 8% of transbay riders did not have access to a car.
Figure 16 shows mode of access for the BART stations in the study area. Approximately one third of riders at these stations access them by driving alone or carpooling.
Original PDF, page 23
Background Studies and Travel Data | ® ®
WEST CONTRA COSTA COUNTY
EXPRESS BUS IMPLEMENTATION PLAN October 2018
Figure 10: Ridership by Stop (AC Transit)
San Pablo Ave
Background Studies and Travel Data | October 2018 Figure 11: AC Transit Transbay Access Mode – Toward San Francisco Source: AC Transit Onboard Survey Data (Obtained 2012, cleaned 2018) Figure 12: AC Transit Transbay Access Mode – Toward Study Area Source: AC Transit Onboard Survey Data (Obtained 2012, cleaned 2018) 0% 10% 20% 30% 40% 50% 60% 70% 80% 90% 100% Walked all the way Personal Bike Bike Share Was dropped off using Uber, Lyft, or similar service Was dropped off by someone ‐ not a service Drove alone and parked Drove or rode with others and parked Taxi Other ROUTE G ROUTE H ROUTE L ROUTE LA 0% 10% 20% 30% 40% 50% 60% 70% 80% 90% 100% Walked all the way Personal Bike Bike Share Was dropped off using Uber, Lyft, or similar service Was dropped off by someone ‐ not a service Drove alone and parked Drove or rode with others and parked Taxi Other ROUTE G ROUTE H ROUTE L ROUTE LA
Original PDF, page 25
Background Studies and Travel Data | October 2018 Figure 13: Automobile Access – AC Transit Transbay Riders Source: AC Transit Onboard Survey Data (Obtained 2012, cleaned 2018) Figure 14: Mode of Access – WestCAT Express/Transbay Riders Source: WestCAT Transit Passenger Survey Data (2017) 53% 47% 57% 43% 42% 58% 41% 59% 0% 10% 20% 30% 40% 50% 60% 70% 80% 90% 100% Has Access to a Car Does Not Have Access to a Car Route G Route H Route L Route LA 0% 10% 20% 30% 40% 50% 60% 70% 80% 90% 100% Walked Drove Alone Dropped Off Carpooled ‐ Parked Bicycled TNC Other Express (JR/JL/JX/JPX) Transbay (Lynx)
Original PDF, page 26
Background Studies and Travel Data | October 2018 Figure 15: Drivable Vehicles Available to Household – WestCAT Express/Transbay Riders Source: WestCAT Transit Passenger Survey Data (2017) Figure 16: Mode of Access – El Cerrito Plaza/El Cerrito del Norte/Richmond BART Source: 2015 BART Station Profile Survey 17% 36% 29% 12% 5% 2% 8% 17% 37% 30% 7% 1% 0% 10% 20% 30% 40% 50% 60% 70% 80% 90% 100% No Car Other Express (JR/JL/JX/JPX) Transbay (Lynx)
Original PDF, page 27
Background Studies and Travel Data | October 2018
4 POPULATION AND EMPLOYMENT
4.1 Population Density
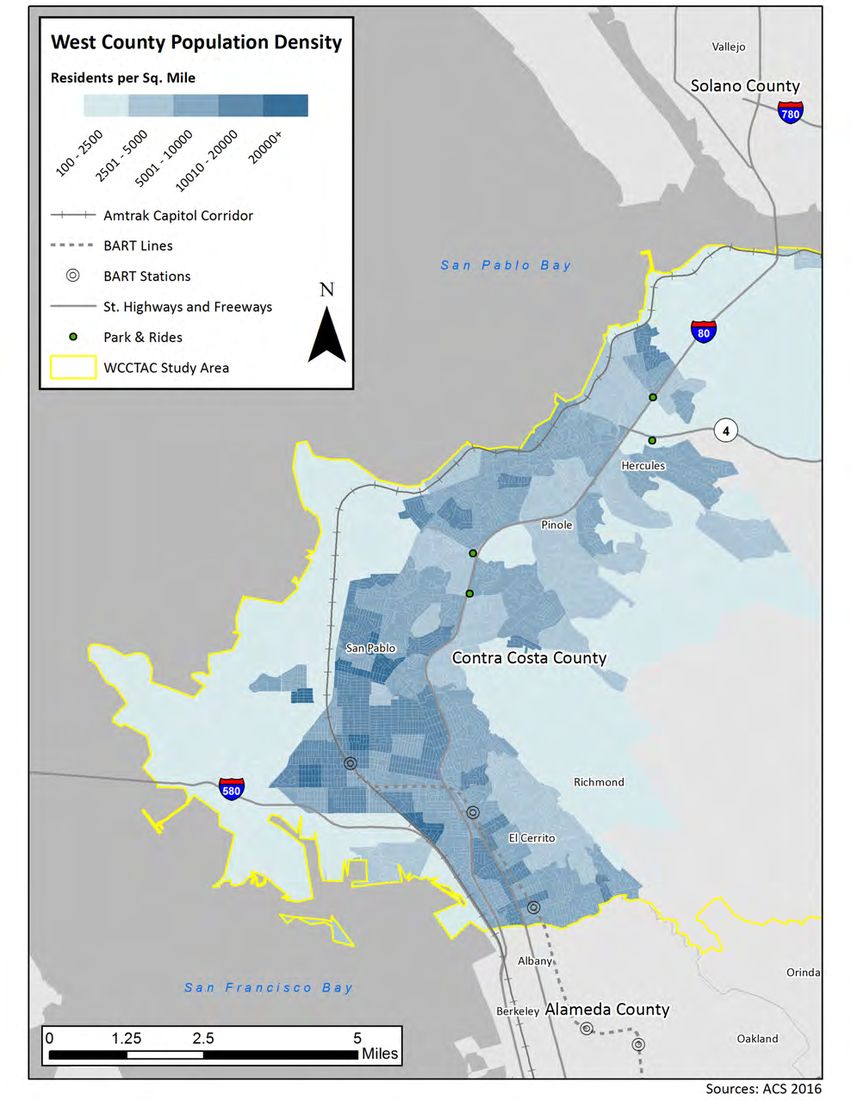
Figure 17 shows the population density in West County. As can been seen in the figure, population density in the study area is concentrated in the cities of Hercules, Pinole, San Pablo, Richmond, and El Cerrito, as well as the unincorporated areas in between. Population density is significantly lower in the areas north of Rodeo, west of Richmond Parkway, and the San Pablo Ridge.
4.2 Employment Density
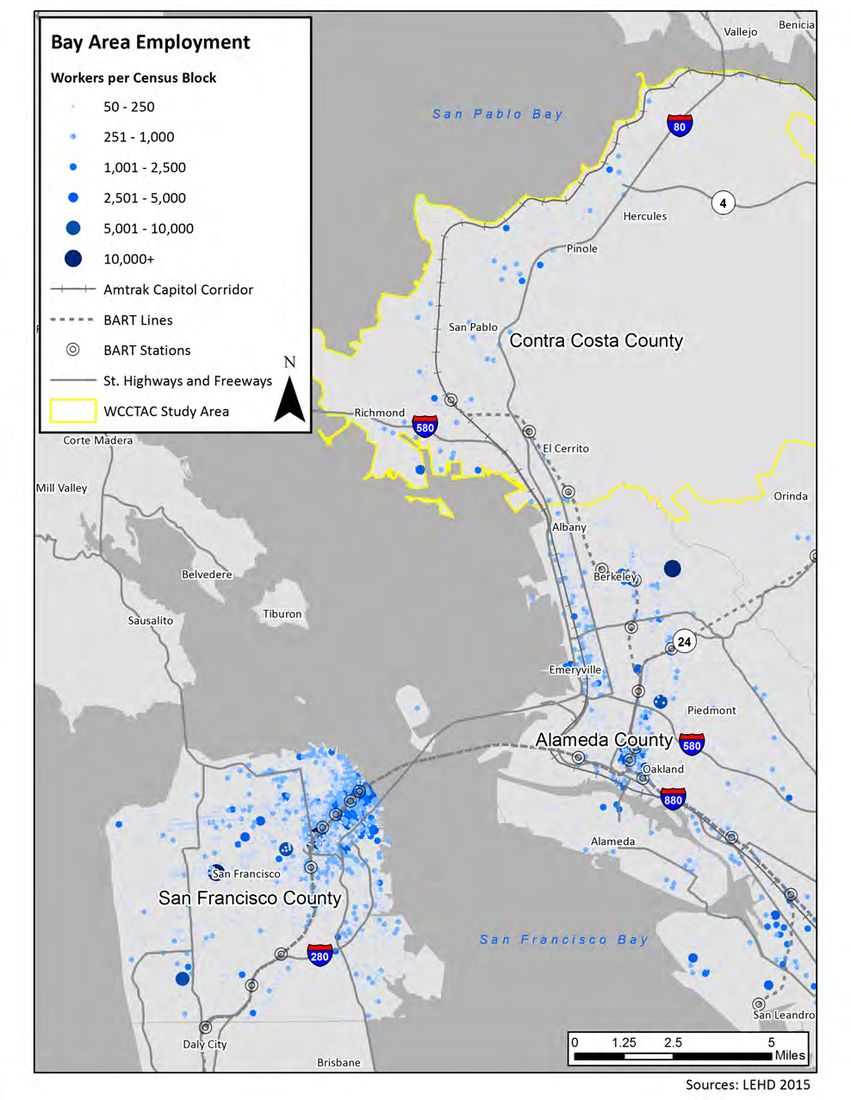
Figure 18 shows overall employment density throughout the region including West Contra Costa County, San Francisco, and Alameda County. Major employment centers include San Francisco, Oakland, and Emeryville.
4.3 Demographics
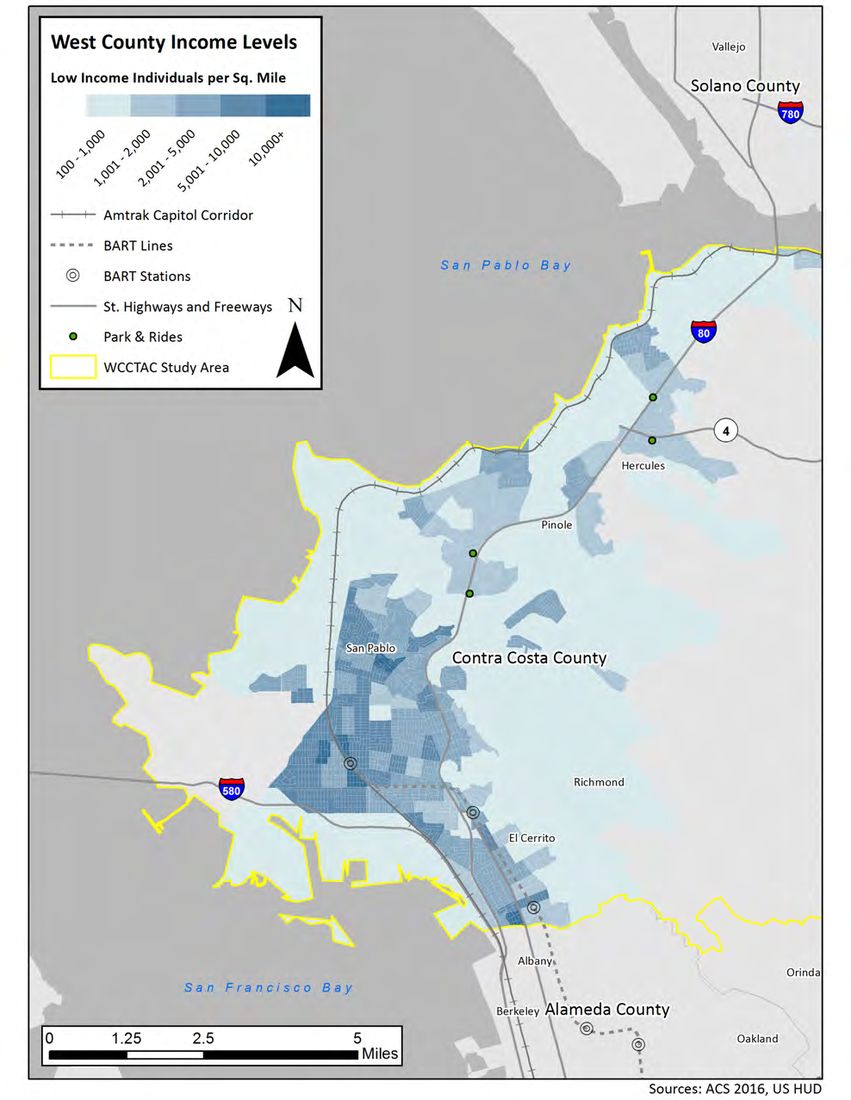
Approximately 26.6% of the population of West County is low income; this figure is based on the definition of low income as established by the Department of Housing and Urban Development, which defines low income as people making at or below 50% of the county median income. Figure 19 shows the concentration of low income households in the study area.
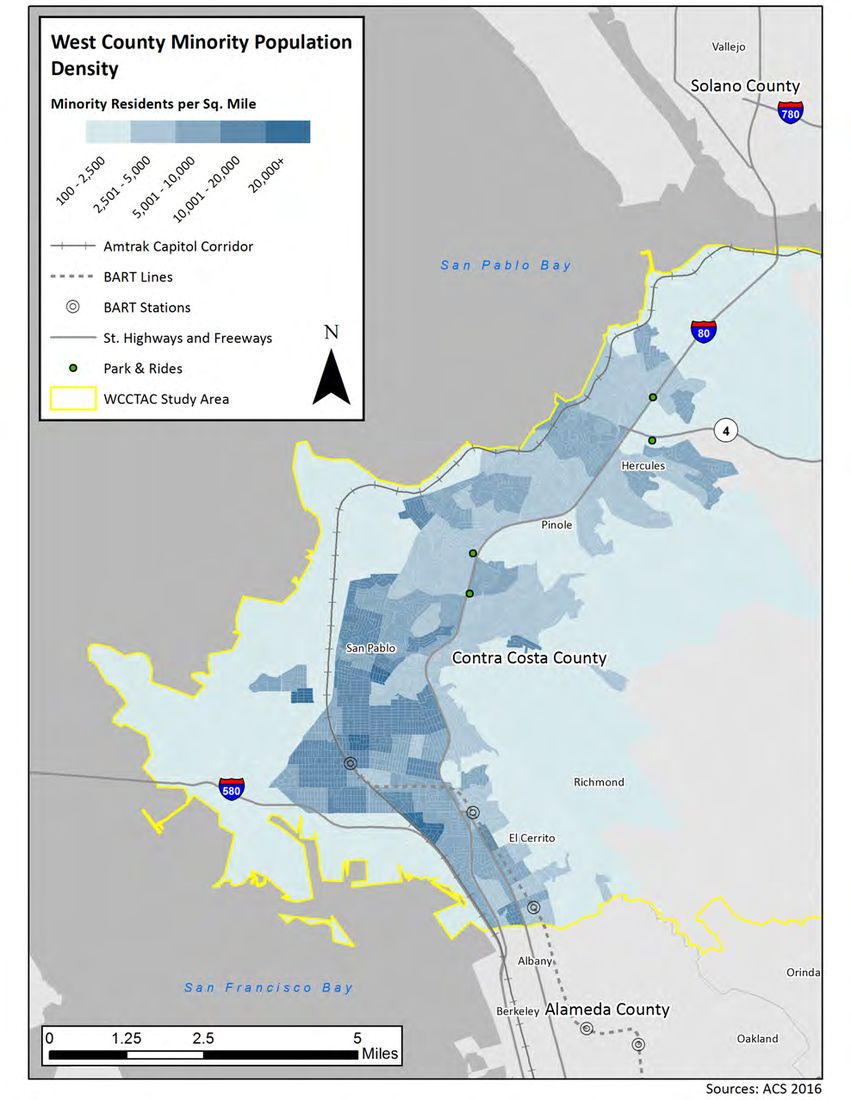
West Contra Costa County has a minority population of 75.3% (ACS); minority population in this case is defined as residents identified as non‐White or Hispanic. Figure 20 shows the distribution of minority populations in the study area.
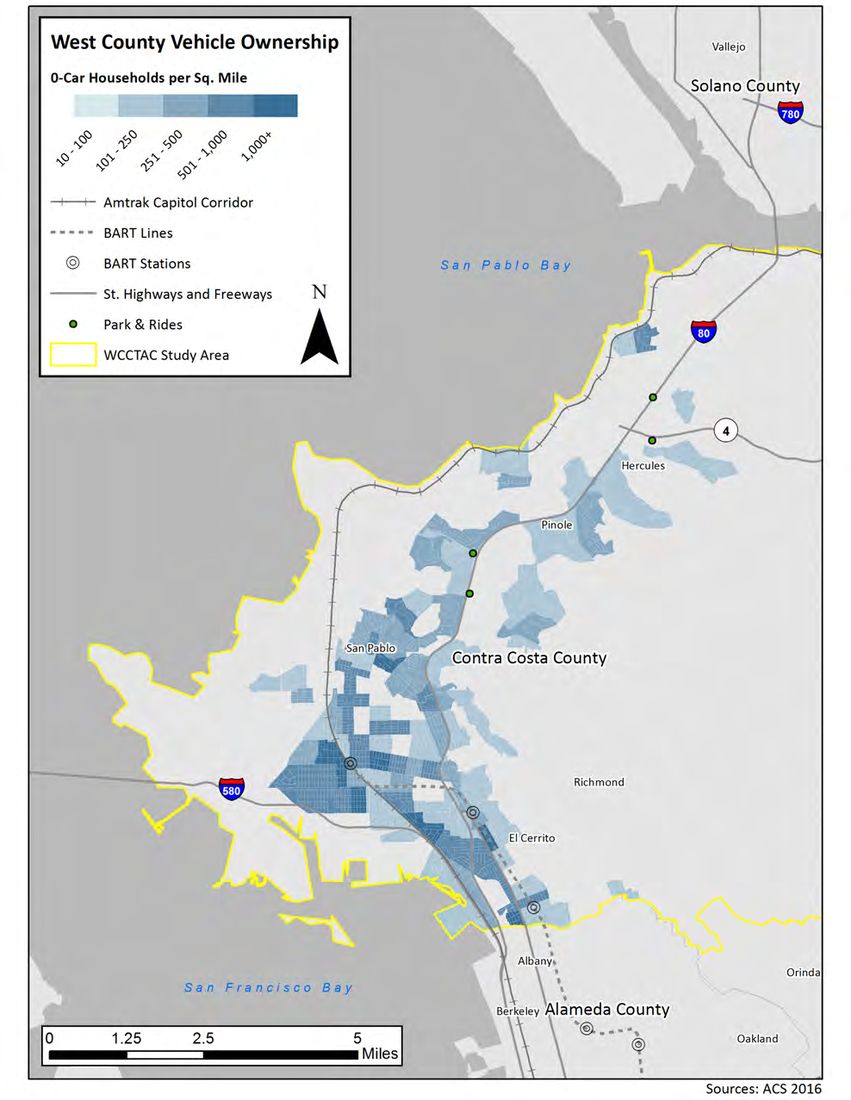
The ACS indicated that 7.8 percent of households in the study area do not have a vehicle. A significant portion of these households are concentrated in the cities of Richmond, San Pablo, and El Cerrito. Figure 21 shows the concentration of zero‐automobile households in the study area.
Original PDF, page 28
Background Studies and Travel Data | ® ®
WEST CONTRA COSTA COUNTY
EXPRESS BUS IMPLEMENTATION PLAN October 2018
Figure 17: Study Area Population Density (US Census Data)
San Pablo Ave
Background Studies and Travel Data | ® ®
WEST CONTRA COSTA COUNTY
EXPRESS BUS IMPLEMENTATION PLAN October 2018
Figure 18: Study Area Employment Density
San Pablo Ave
Background Studies and Travel Data | ® ®
WEST CONTRA COSTA COUNTY
EXPRESS BUS IMPLEMENTATION PLAN October 2018
Figure 19: Study Area Low-Income Population Density (US Census Data)
San Pablo Ave
Original PDF, page 31
Background Studies and Travel Data | ® ®
WEST CONTRA COSTA COUNTY
EXPRESS BUS IMPLEMENTATION PLAN October 2018
Figure 20: Study Area Minority Population Density
San Pablo Ave
Background Studies and Travel Data | ® ®
WEST CONTRA COSTA COUNTY
EXPRESS BUS IMPLEMENTATION PLAN October 2018
Figure 21: Study Area Density of Zero-Auto Households (US Census Data)
San Pablo Ave
Background Studies and Travel Data | October 2018
5 CURRENT COMMUTE PATTERNS
5.1 Existing Commute Patterns
Over 115,000 workers reside in the study area; a high proportion of these commuters–over 95,000, or 83%–of these workers are employed in locations outside of the study area. A breakdown of the top ten employment locations (cities or census‐designated places) for all workers is shown in Table 3. Table 4 breaks down the top ten employment locations outside of the study area.
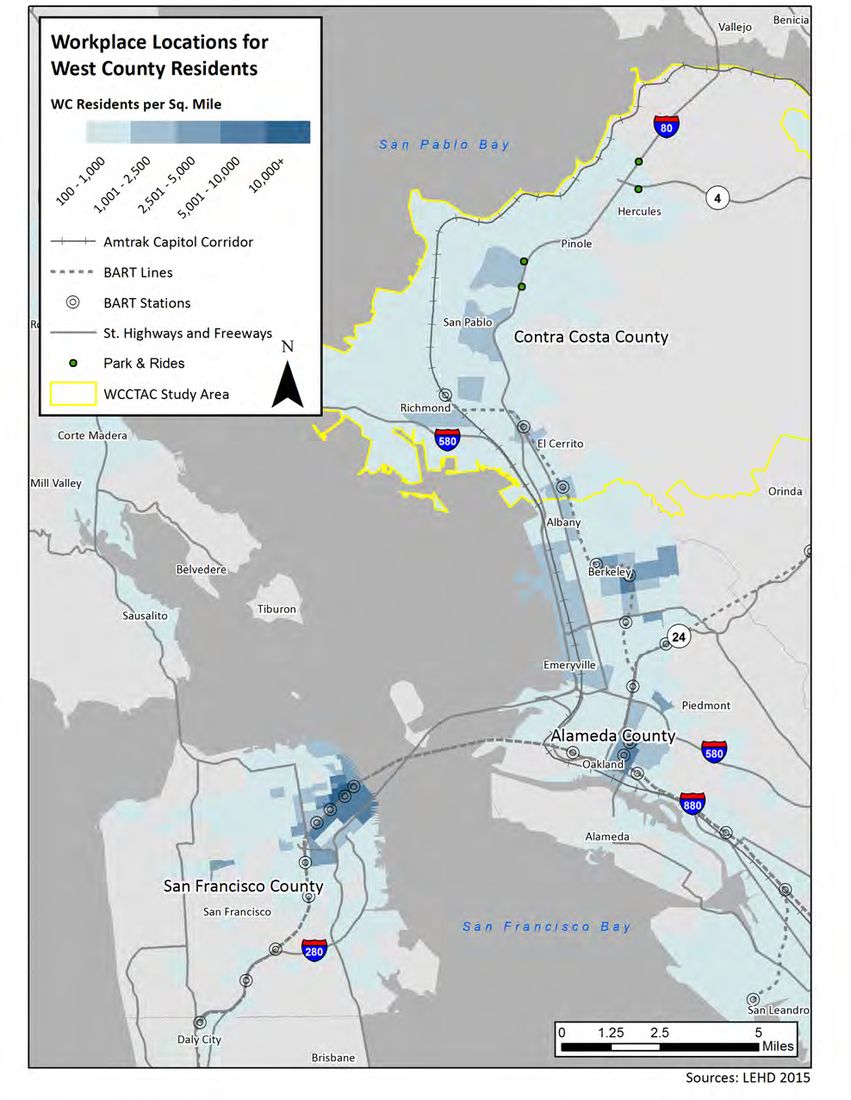
Table 3: Top 10 Overall Employment Locations for Study Area Residents (LEHD Data) Location Workers San Francisco 21,471 Oakland 11,344 Berkeley 9,971 Richmond 9,901 San Rafael 3,044 San Pablo 2,678 Martinez 2,102 Walnut Creek 2,052 San Jose 1,937 Pinole 1,886 Other 49,514 Total 115,900 Table 4: Top 10 Non‐Study Area Employment Locations for Study Area Residents (LEHD Data) Location Workers San Francisco 21,471 Oakland 11,344 Berkeley 9,971 San Rafael 3,044 Martinez 2,102 Walnut Creek 2,052 San Jose 1,937 Concord 1,875 Emeryville 1,735 Vallejo 1,517 Other 38,622 Total 95,670 Figure 22 shows the employment density of West Contra Costa County residents; i.e. the number of study area residents per square mile working in a particular census tract. Notable areas outside of the study area with a high concentration of West Contra Costa County workers include:
San Francisco o Market Street Corridor
Original PDF, page 34
Background Studies and Travel Data | October 2018 o Financial District o South of Market Neighborhood (“SoMa”) o UCSF Parnassus Campus o Northern portions of the Mission District
Oakland o Jack London Square o Downtown Oakland o Uptown Oakland o Broadway/MacArthur Boulevard Area
Berkeley o Downtown Berkeley o UC Berkeley Campus o North Berkeley
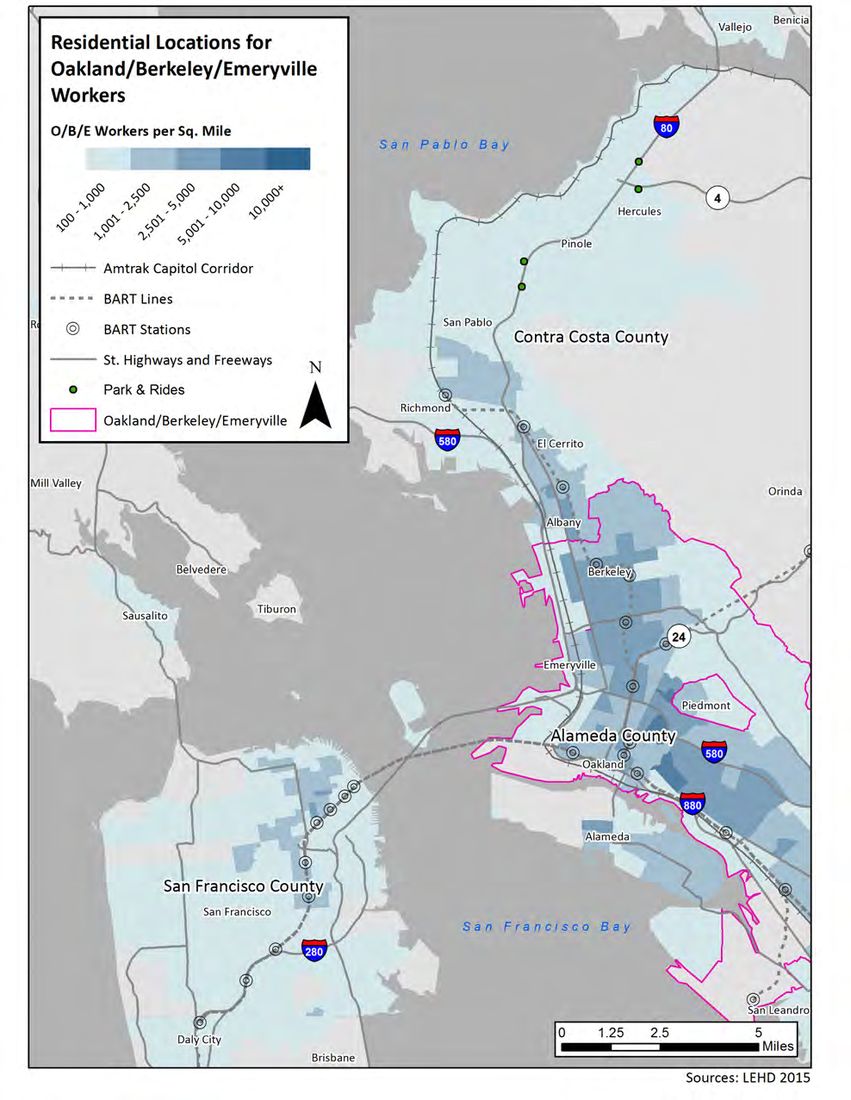
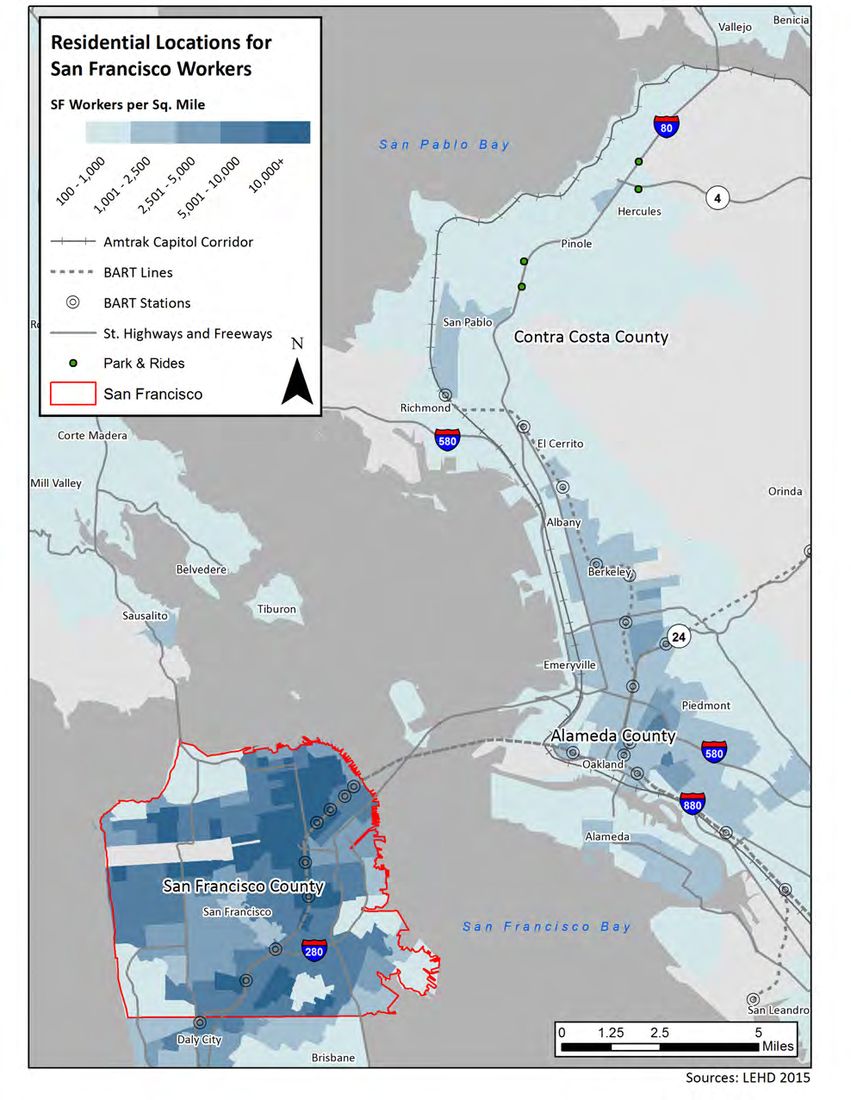
Berkeley/Emeryville o Commercial area approximately bound by University Avenue, San Pablo Avenue, I‐80, and I‐580 Figure 23 shows the residential locations of workers employed in Oakland, Berkeley, or Emeryville. Figure 24 shows the residential locations of workers employed in San Francisco. For both locations, workers in the study area are concentrated in Richmond, San Pablo, and Hercules.
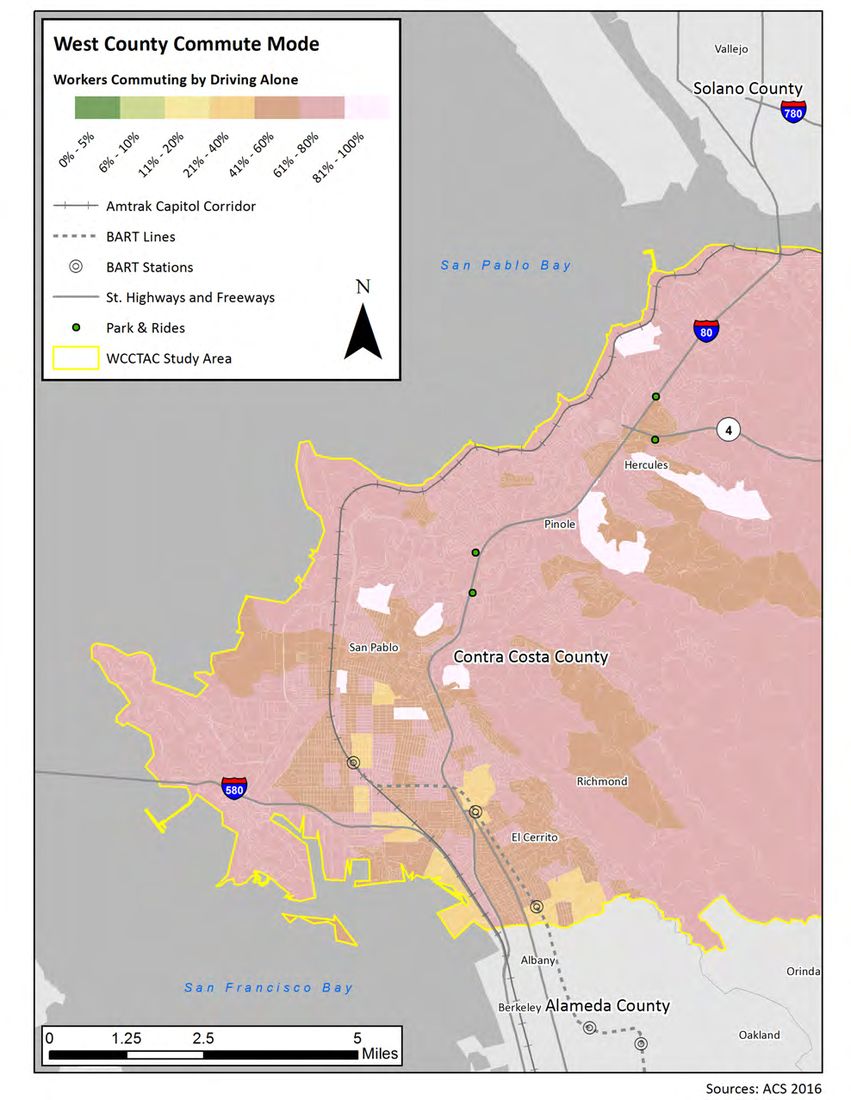
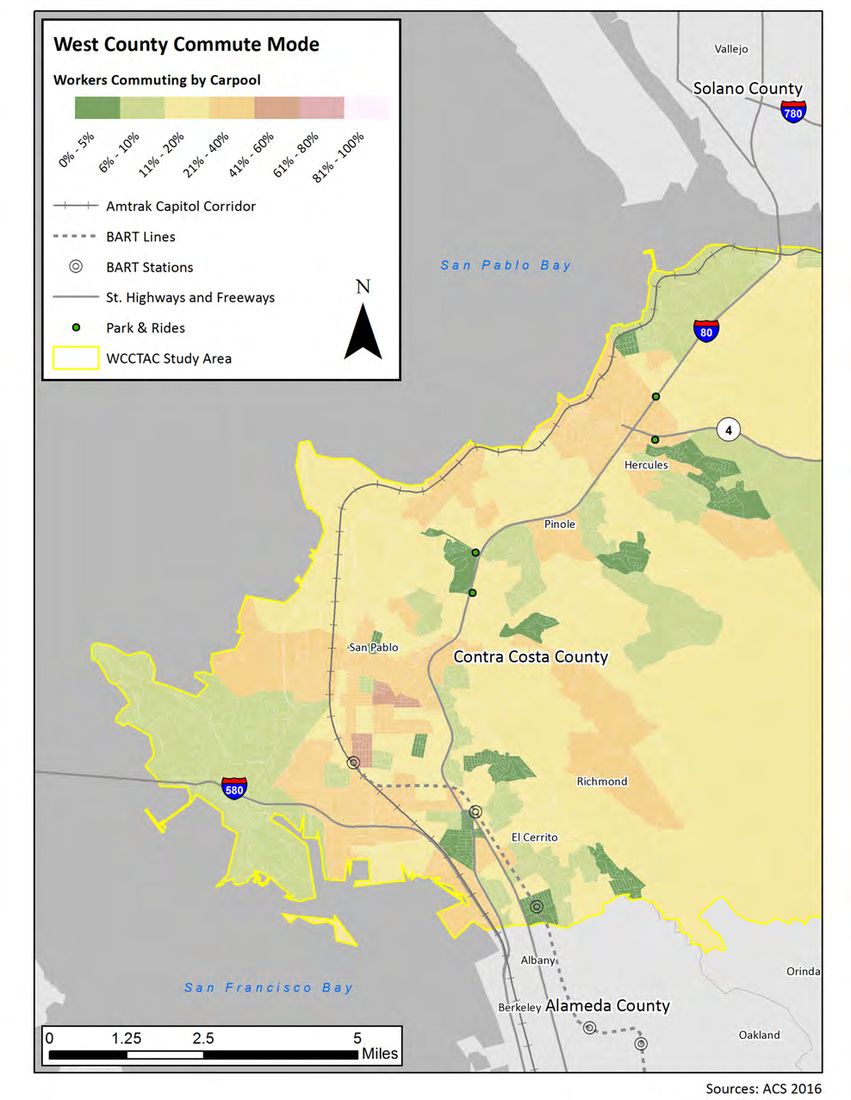
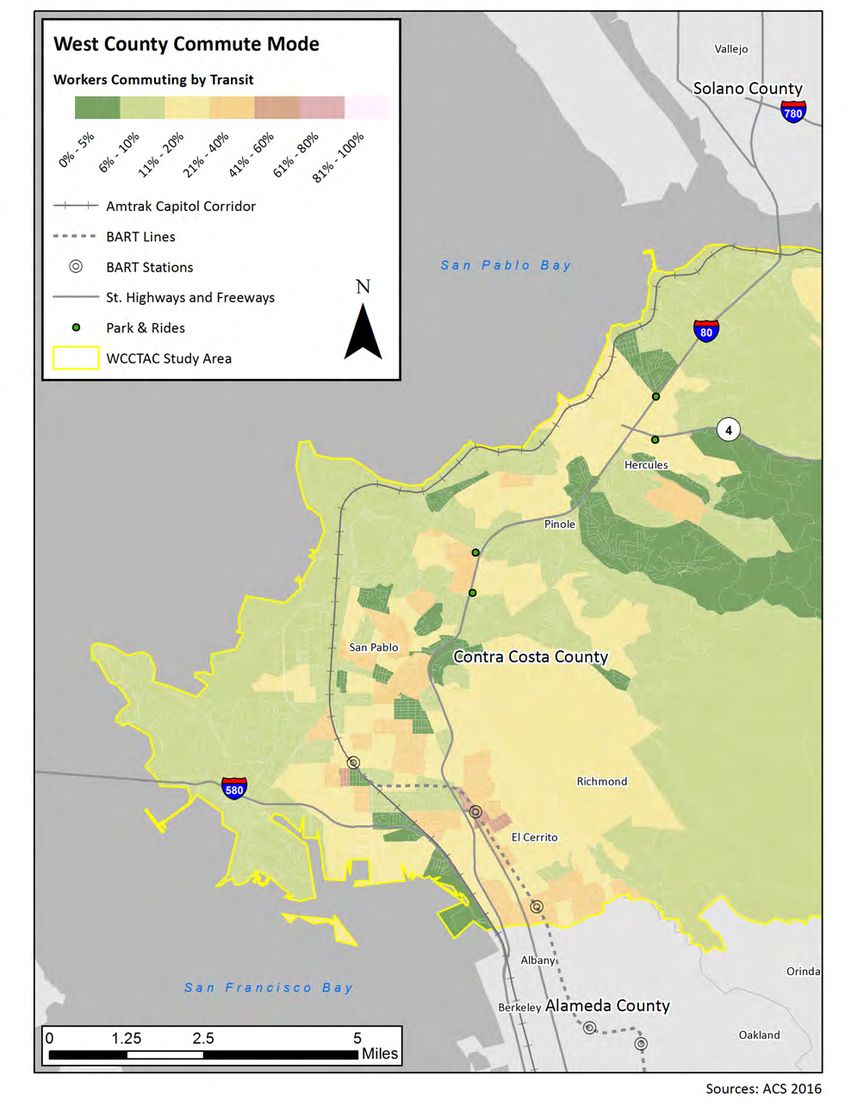
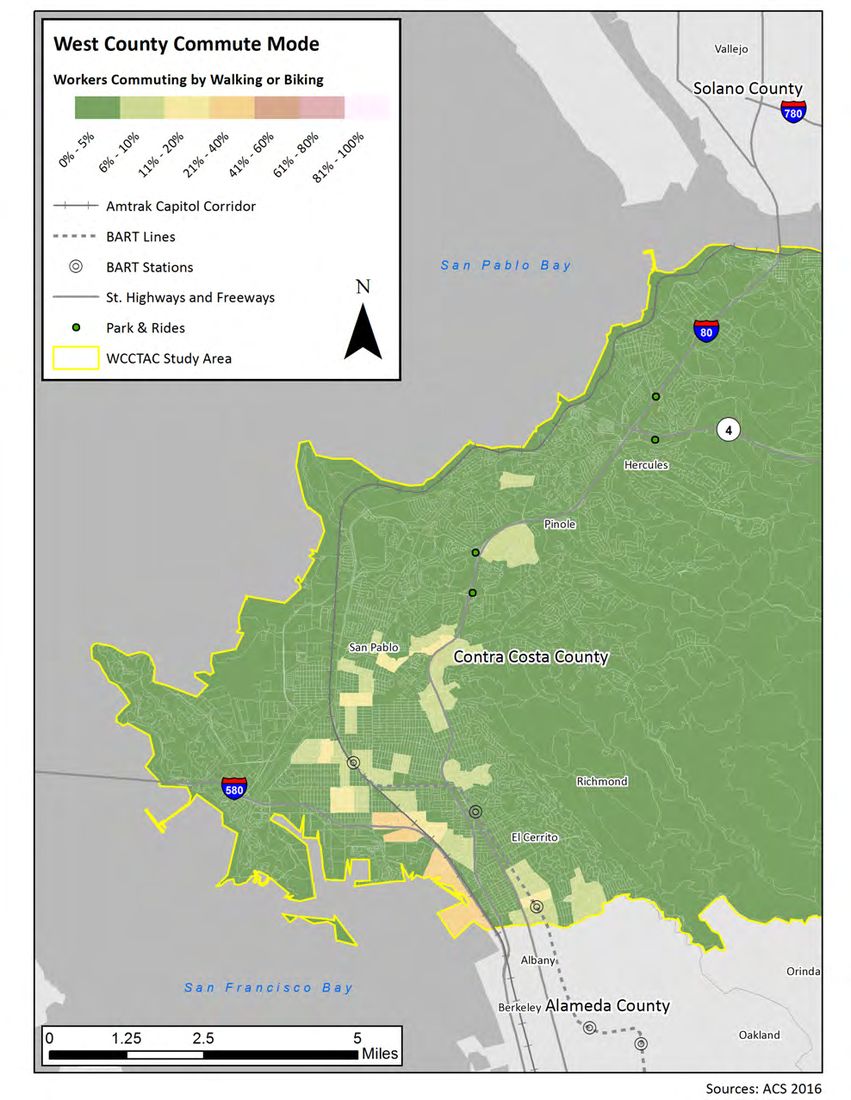
The following pages show the distribution of study area residents who commute by driving alone (Figure 25), carpool (Figure 26), transit (Figure 27), and either walking or biking (Figure 28). The data show that areas around San Pablo, Richmond, and El Cerrito have higher commute mode shares for modes other than driving alone; while areas to the north, such as Pinole and Hercules, have higher drive‐alone commute mode shares. This is consistent with the auto‐ownership patterns discussed in Section 4.3.
Original PDF, page 35
Background Studies and Travel Data | ® ®
WEST CONTRA COSTA COUNTY
EXPRESS BUS IMPLEMENTATION PLAN October 2018
Figure 22: Employment Locations for West County Residents (LEHD Data)
San Pablo Ave
Background Studies and Travel Data | ® ®
WEST CONTRA COSTA COUNTY
EXPRESS BUS IMPLEMENTATION PLAN October 2018
Figure 23: Residential Locations of Oakland/Berkeley/Emeryville Employees (LEHD Data)
San Pablo Ave
Background Studies and Travel Data | ® ®
WEST CONTRA COSTA COUNTY
EXPRESS BUS IMPLEMENTATION PLAN October 2018
Figure 24: Residential Locations of San Francisco Employees (LEHD Data)
San Pablo Ave
Original PDF, page 38
Background Studies and Travel Data | ® ®
WEST CONTRA COSTA COUNTY
EXPRESS BUS IMPLEMENTATION PLAN October 2018
Figure 25: Percent of Commuters in Study Area Who Drive Alone (US Census Data)
San Pablo Ave
Background Studies and Travel Data | ® ®
WEST CONTRA COSTA COUNTY
EXPRESS BUS IMPLEMENTATION PLAN October 2018
Figure 26: Percent of Commuters in Study Area Who Carpool (US Census Data)
San Pablo Ave
Background Studies and Travel Data | ® ®
WEST CONTRA COSTA COUNTY
EXPRESS BUS IMPLEMENTATION PLAN October 2018
Figure 27: Percent of Commuters in Study Area Who Use Transit (US Census Data)
San Pablo Ave
Original PDF, page 41
Background Studies and Travel Data | ® ®
WEST CONTRA COSTA COUNTY
EXPRESS BUS IMPLEMENTATION PLAN October 2018
Figure 28: Percent of Commuters in Study Area Who Walk or Bike (US Census Data)
San Pablo Ave
Background Studies and Travel Data | October 2018
5.2 Existing Transit Market Share
Since express bus services primarily serve commuters, the market share of an express bus service can be determined by dividing ridership by the number of potential commuters that could use the service.
LEHD employment data, combined with information on access distance from on‐board surveys, can be used to determine the number of potential commuters within the “capture area” of an express bus service. The WestCAT on‐board survey found that, on average, Lynx riders who drive to access the bus average of 2.6 miles (i.e, the distance from home to their stop). All Lynx riders, once they reach Salesforce Transit Center, have an average walk time to their non‐home destination of 9.3 minutes. Per TCRP Report 95, 50 percent of park‐and‐ride lot users live within 2.5 miles of the lot, and 85 percent of users live within a capture area with a parabolic shape, with more users being captured “upstream” from the facility, in the opposite direction of major commute flows1.
To approximate the capture area of express bus service, areas within 2.5 miles of park‐and‐ride lots and areas within ¼ mile from other express bus stops were considered to be within the residential capture area, and areas within ½ mile of Salesforce Transit Center were considered to be within the destination capture area. People who live within the residential capture area and work within the destination capture area are the potential primary market for express bus service.
Since on‐board survey data indicated that the vast majority of AC Transit Transbay riders walk to access the bus, it was assumed that Transbay buses are not capturing the park‐and‐ride market. Per LEHD employment data, a total of 989 workers live within ¼‐mile of an AC Transit Transbay stop and also work within ½ mile of the Salesforce Transit Center. An average of 537 daily boardings occur at these stops, indicating that AC Transit Transbay is capturing 54% of the potential market for express bus service in the areas that it serves in West County.
On‐board survey data for WestCAT indicated that Lynx riders include a mix of people who walk to access their stop and people who access the service via park‐and‐ride. Per LEHD employment data, a total of 811 workers live within 2.5 miles of park‐and‐rides served by Lynx who also work within ½‐mile of the Salesforce Transit Center. Utilizing access mode share information from the WestCAT on‐board survey, it was estimated that there are 377 daily park‐ and‐ride users on the Lynx service, which represents a capture of 47% of the potential commute market.
Identifying the market capture of existing services informs the potential market capture of new express bus services. Express bus service in the area captures a substantial portion of the commuters whose home and work destinations are both within walking distance of an express bus stop. If new express routes proposed as part of this Plan include local segments, the stops and alignments of those segments should be selected so that they are within walking distance of residents who commute to the express destination. The data also tells us the potential market capture of park‐and‐ride locations; if new express routes proposed as part of this Plan are designed as point‐to‐point services between park‐and‐rides and a commute destination, park‐and‐ride locations should be selected assuming that they will capture a similar portion of the travel market as existing services.
5.3 Travel Time Comparison
Table 5 shows a comparison of travel times between automobiles and transit. Automobile travel times shown are based on Google Maps estimates of travel times to arrive at the trip destination by 8:30 AM on a Tuesday. Transit travel times shown are based on scheduled departure and arrivals times in the same timeframe. Transit travel times for “one‐seat rides” for a particular origin‐destination pair are shown separately from travel times for transit trips requiring at least one transfer. As can be seen in the table, transit travel times are most competitive for trips 1 "TCRP Report 95: Park‐and‐Ride/Pool," Transportation Research Board, 2004. http://onlinepubs.trb.org/onlinepubs/tcrp/tcrp_rpt_95c3.pdf
Original PDF, page 43
Background Studies and Travel Data | October 2018 where a one‐seat ride is available; transit travel times are also competitive for trips where the destination is located near an existing BART station.
The travel times shown for trips going from Arlington Boulevard & Potrero Avenue in El Cerrito to Salesforce Transit Center may help inform the low levels of ridership on the northern portions of Lines G and H, as shown in Figure 10. Both of these lines have lengthy segments on local roads which increase travel time, thus making these services less competitive when compared to travel times by automobile or by taking a local bus to BART.
Additionally, the northern portions of these lines, particularly Line H, serve higher‐income areas with few transit‐ dependent households.
Original PDF, page 44
| Origin | Destination | Auto Travel Time | One Seat Ride | Transit Trips Requiring Transfers | |||||
|---|---|---|---|---|---|---|---|---|---|
| Travel Time | Transit Services | Travel Time | Transit Services | Transfers Required | |||||
| Hercules Transit Center | Salesforce Transit Center (San Francisco) | 0:55‐1:40 | 0:43 | Lynx | 0:55 | JR/JL/JX/JPX, BART (Embarcadero) | 1 | ||
| El Cerrito del Norte BART | 0:20‐0:45 | 0:16‐0:23 | JX/JPX | ‐ | ‐ | ‐ | |||
| Jack London Square (Oakland) | 0:40‐1:15 | ‐ | ‐ | 1:04 | JR/JL/JX/JPX, BART, Broadway Shuttle | 1‐2 | |||
| 14th St & Broadway (Oakland) | 0:35‐1:15 | ‐ | ‐ | 0:43‐0:50 | JR/JL/JX/JPX, BART (12th Street/Oakland City Center) | 1 | |||
| San Pablo Ave & Powell St (North Oakland) | 0:30‐1:10 | ‐ | ‐ | 0:48‐0:53 | JR/JL/JX/JPX, 72R | 1 | |||
| San Pablo Ave & University Ave (Berkeley) | 0:30‐1:05 | ‐ | ‐ | 0:48 | JR/JL/JX/JPX, 72R | 1 | |||
| Richmond Parkway Transit Center | Salesforce Transit Center (San Francisco) | 0:45‐1:30 | 0:46‐0:50 | LA | 0:49‐1:02 | JR/JL/JX/JPX, BART (Embarcadero) | 1 | ||
| Jack London Square (Oakland) | 0:30‐1:00 | ‐ | ‐ | 0:52 | JR, BART (12th Street/Oakland City Center), Broadway Shuttle | 1‐2 | |||
| 14th St & Broadway (Oakland) | 0:30‐1:00 | ‐ | ‐ | 0:40 | JR, BART (12th Street/Oakland City Center) | 1 | |||
| San Pablo Ave & Powell St (North Oakland) | 0:26‐0:55 | ‐ | ‐ | 0:49‐0:57 | JL, 72R | 1 | |||
| San Pablo Ave & University Ave (Berkeley) | 0:22‐0:50 | ‐ | ‐ | 0:49 | JR, 72R | 1 | |||
| I‐80 Park & Ride at Hilltop Dr | Salesforce Transit Center (San Francisco) | 0:45‐1:25 | 1:10 | LA | 1:15 | JL, BART (Embarcadero) | 1 | ||
| Tennent Ave & San Pablo Ave (Pinole) | Salesforce Transit Center (San Francisco) | 0:50‐1:40 | ‐ | ‐ | 0:55‐1:14 | JL, Lynx JPX, BART (Embarcadero) | 1 | ||
| Tulare Ave & San Pablo Ave (San Pablo) | Salesforce Transit Center (San Francisco) | 0:40‐1:20 | 0:51 | L | 0:49 | 72R, BART (Embarcadero) | 1 | ||
| Moeser Ln & San Pablo Ave (El Cerrito) | Salesforce Transit Center (San Francisco) | 0:35‐1:10 | 0:36 | L | 0:47 | 72R, BART (Embarcadero) | 1 | ||
| Arlington Blvd & Potrero Ave (El Cerrito) | Salesforce Transit Center (San Francisco) | 0:40‐1:15 | 0:55 | H | 0:53 | Line 7, BART (Embarcadero) | 1 |
Background Studies and Travel Data | September 2018 Table 5: Auto vs. Transit Travel Time Comparison Origin Destination Auto Travel Time One Seat Ride Transit Trips Requiring Transfers Travel Time Transit Services Travel Time Transit Services Transfers Hercules Transit Center Salesforce Transit Center (San Francisco) 0:55‐1:40 0:43 Lynx 0:55 JR/JL/JX/JPX, BART (Embarcadero) El Cerrito del Norte BART 0:20‐0:45 0:16‐0:23 JX/JPX ‐ ‐ ‐ Jack London Square (Oakland) 0:40‐1:15 ‐ ‐ 1:04 JR/JL/JX/JPX, BART, Broadway Shuttle 1‐2 14th St & Broadway (Oakland) 0:35‐1:15 ‐ ‐ 0:43‐0:50 JR/JL/JX/JPX, BART (12th Street/Oakland City Center) San Pablo Ave & Powell St (North Oakland) 0:30‐1:10 ‐ ‐ 0:48‐0:53 JR/JL/JX/JPX, 72R San Pablo Ave & University Ave (Berkeley) 0:30‐1:05 ‐ ‐ 0:48 JR/JL/JX/JPX, 72R Richmond Parkway Transit Center Salesforce Transit Center (San Francisco) 0:45‐1:30 0:46‐0:50 LA 0:49‐1:02 JR/JL/JX/JPX, BART (Embarcadero) Jack London Square (Oakland) 0:30‐1:00 ‐ ‐ 0:52 JR, BART (12th Street/Oakland City Center), Broadway Shuttle 1‐2 14th St & Broadway (Oakland) 0:30‐1:00 ‐ ‐ 0:40 JR, BART (12th Street/Oakland City Center) San Pablo Ave & Powell St (North Oakland) 0:26‐0:55 ‐ ‐ 0:49‐0:57 JL, 72R San Pablo Ave & University Ave (Berkeley) 0:22‐0:50 ‐ ‐ 0:49 JR, 72R I‐80 Park & Ride at Hilltop Dr Salesforce Transit Center (San Francisco) 0:45‐1:25 1:10 LA 1:15 JL, BART (Embarcadero) Tennent Ave & San Pablo Ave (Pinole) Salesforce Transit Center (San Francisco) 0:50‐1:40 ‐ ‐ 0:55‐1:14 JL, Lynx JPX, BART (Embarcadero) Tulare Ave & San Pablo Ave (San Pablo) Salesforce Transit Center (San Francisco) 0:40‐1:20 0:51 0:49 72R, BART (Embarcadero) Moeser Ln & San Pablo Ave (El Cerrito) Salesforce Transit Center (San Francisco) 0:35‐1:10 0:36 0:47 72R, BART (Embarcadero) Arlington Blvd & Potrero Ave (El Cerrito) Salesforce Transit Center (San Francisco) 0:40‐1:15 0:55 H 0:53 Line 7, BART (Embarcadero)
Original PDF, page 45
Background Studies and Travel Data | September 2018
6 FINDINGS
The following are key findings based on the review of previous studies and planning work in the study area:
Previous studies have made recommendations of providing new or better express bus access to San Francisco and the East Bay. The West Contra Costa County High‐Capacity Transit study identified a recommended set of routes providing access to Oakland, Berkeley, and Emeryville. The WestCAT SRTP identified demand for a similar set of potential express bus destinations.
The connectivity needed to distribute and collect riders in the East Bay may be made more feasible from a combination of existing and proposed services (e.g. EBOTS) or existing and proposed transit‐related improvements, such as the signal improvements made as part of the I‐80 SMART Corridor Project or potential bus improvements to San Pablo Avenue as part of the San Pablo Avenue Complete Streets Study. As recommendations are developed for this Plan, coordination and further study will be required to identify opportunities for other transit services to connect to proposed express bus routes.
The following are key findings based on the travel data analyzed in this memorandum:
Existing express bus services in the study area serve both choice riders (riders who have access to a car but choose to ride transit anyway) and transit‐dependent riders (riders with no access to a car who must ride transit).
On‐board survey data shows that most WestCAT riders have access to a car, whereas only half of riders on AC Transit Transbay routes have automobile access. This is reflective of the service areas of these service providers. Zero‐auto households are more concentrated in San Pablo, Richmond, and El Cerrito, which is also the area served by AC Transit Transbay routes. WestCAT’s express and transbay routes serve Hercules, Pinole, and Tara Hills, where zero‐auto households are less prevalent.
Existing AC Transit express bus services have a high market capture (54%) of people who live and work within walking distance of both their origin and destination stop.
The existing WestCAT Lynx express bus service captures 47% of people who live within driving distance of Lynx‐served park‐and‐rides and work within walking distance of the Salesforce transit center.
Many of the existing express bus services in the study area essentially have a local segment and an express segment. Along the local segments of these routes, buses make frequent stops at curbside bus stops spaced approximately every ¼ to ½ mile. The express segments of these routes connect the local segment to an express destination. In the case of AC Transit Transbay and WestCAT Lynx service, this express destination is the Salesforce Transit Center in San Francisco. In the case of WestCAT express routes (Routes JR/JL/JX/JPX), the express destination is El Cerrito del Norte BART. Potential new express bus services should take into account the fact that local segments will better capture transit‐dependent commuters within walking distance, while routes serving park‐and‐rides will better capture car‐owning choice riders within driving distance.
Lines G and H see low ridership at stops near their northern termini; this could be due to a number of factors. The northern portions of route H serve primarily high‐income areas with few transit‐dependent residents. Additionally, both of these lines have lengthy segments on local roads which increase travel time, thus making these services less competitive when compared to travel times by automobile or BART.
Transit travel times are most competitive with automobile travel times when a one‐seat ride is available and in cases where a trip destination is located near an existing BART station.
The following are major commute destinations for study area residents; these should be considered for destinations for a potential express bus service:
Original PDF, page 46
Background Studies and Travel Data | September 2018 o San Francisco
Market Street Corridor
Financial District
South of Market Neighborhood (“SoMa”)
UCSF Parnassus Campus
Northern portions of the Mission District o Oakland
Jack London Square
Downtown Oakland
Uptown Oakland
Broadway/MacArthur Boulevard Area o Berkeley
Downtown Berkeley
UC Berkeley Campus
North Berkeley o Berkeley/Emeryville
Commercial area approximately bound by University Avenue, San Pablo Avenue, I‐80, and I‐580
Original PDF, page 47
® ®
WEST CONTRA COSTA COUNTY
EXPRESS BUS IMPLEMENTATION PLAN C.
OUTREACH SUMMARIES
AND MATERIALS
Final Plan | February 2020
MEMORANDUM
DATE February 21, 2019 TO Kimley-Horn and WCCTAC FROM Brendan Hurley and Carey Stone, PlaceWorks SUBJECT Community Outreach Round 1 – Express Bus Implementation Plan
Project Background
The memo provides a summary of Round 1 outreach efforts for the WCCTAC Express Bus Implementation Plan (Plan). Round 1 outreach efforts focused on West Contra Costa County commute trends and preferences, desired bus and stop amenities, and preferred headways. Round 1 outreach began in September 2018 and concluded in December 2018.
The memo covers the following topics: Spreading the Word Public Input Channels Analysis of Survey Results Next Steps Conclusions and Recommendations
Spreading the Word
To ensure the community was aware of the planning process, PlaceWorks created the following items as described below: Project Webpage Social Media Project Fact Sheet and Postcard Press Releases and News Articles PROJECT WEBPAGE PlaceWorks published the Express Bus Implementation Plan project webpage on the WCCTAC website in October 2018. The webpage provides information in both English and Spanish. The webpage includes the project timeline, a way to subscribe to the project mailing list, and online engagement tools, which are described below. The webpage address is included on both the project fact sheet and postcard, and people were encouraged to visit the webpage to find out more information about the project and WCCTAC as an organization.
Original PDF, page 49
February 21, 2019 | Page 2 PlaceWorks notified potential riders and interested parties about the webpage through social media, the fact sheet, postcard, and press releases, as well as emails to partner jurisdictions and neighborhood associations, as described below.
SOCIAL MEDIA Working with WCCTAC and Kimley-Horn, PlaceWorks posted information about the Express Bus Implementation Plan on Twitter, Facebook, and Instagram.
PlaceWorks used paid advertising to announce the availability of the online surveys via two promoted Facebook posts. The first promoted post reached 12,300 people with 992 engaging in the post (this is the total number of likes, comments, shares, post clicks, link clicks and image clicks). The second promoted post reached 4,645 people with 290 people engaging in the post.
PROJECT FACT SHEET AND POSTCARD In addition to social media efforts, PlaceWorks created a project fact sheet and postcard that provided information in an easy-to-read format in both English and Spanish. The fact sheet described the benefits of an express bus, and the project timeline, scope, and outreach methods, including the project website and online engagement links. The postcard included a short project description and invited recipients to provide feedback through the project webpage and online engagement site.
PlaceWorks emailed the fact sheet to major employers and government agencies to spread awareness of the project. The following jurisdictions and groups received the fact sheet: Alameda County, the Cities of San Pablo, Pinole, Hercules, Richmond, Berkeley, and El Cerrito, and the Richmond and Bay Front Chambers of Commerce. PlaceWorks emailed the fact sheet to the following large employers: Bayer, UCSF, Alta Bates, Sutter Health, Kaiser Permanente, John Muir Health (through Commute Solutions), and Novartis.
PlaceWorks printed and mailed the postcard to 27,699 households in West Contra Costa County on November 26, 2018. Table 1 identifies the number of postcard recipients per city.
Postcard recipients were determined based on the following methodology:
- All addresses within El Sobrante, Hercules, Pinole, and
Richmond that are within BOTH an SB 535 Disadvantaged Community AND within Census block groups that have a low-income population greater than 1,000 people per square mile.
- All addresses that fall within Census block groups that have a low-income population greater than
2,500 people per square mile.
- All addresses in Hercules (this step was added because the previous two steps did not include any addresses in Hercules).
Table 1: Postcard Recipients City Number of Addresses El Sobrante Hercules 2,314 Pinole 2,852 Richmond 13,572 Rodeo 1,286 San Pablo 7,418 Grand Total 27,699
Original PDF, page 50
February 21, 2019| Page 3 PRESS RELEASES AND NEWS ARTICLES PlaceWorks also submitted press releases and short news articles to notify people about the project and to encourage them to take the online surveys. These were provided to:
15 news organizations City Manager newsletters at six cities The 26 Richmond Neighborhood Councils Out of the 46 organizations reached, the following posted information about the project either through a news article, social media and/or e-newsletter:
E’ville Eye Richmond Standard Cities of El Cerrito, Hercules, Richmond, Pinole, and San Pablo Richmond Chamber of Commerce Four Richmond Neighborhood Associations: Parchester Village Neighborhood Council, Point Richmond Neighborhood Council, Richmond Heights Neighborhood Council, and Richmore Village/Metro Square Neighborhood Council El Sobrante Municipal Advisory Council As shown in Appendix A, all of these organizations, were contacted at least twice in an effort to elicit as many responses as possible.
Public Input Channels
This section describes the outreach methods used to generate feedback on the project. ONLINE ENGAGEMENT For Round 1 Outreach, PlaceWorks created four online tools to engage potentially interested riders, with both English and Spanish versions:
- Project Survey. The Project Survey included 11 questions that asked respondents for basic information about their commutes, such as where they are commuting to and from, how long it takes them, and how they currently travel.
- Ranking Exercise. The Ranking Exercise allowed respondents to rank the most likely factors that would influence them to use the express bus to commute.
- Demographics Survey. The Demographics Survey asked questions about age, race/ethnicity, residence location, and household income.
Original PDF, page 51
February 21, 2019 | Page 4
- Comment Forum. The Comment Forum invited people to share their ideas or comments about the project.
There were 471 responses to the Project Survey, 238 responses to the Ranking Exercise, 196 responses to the Demographics Survey, and 46 entries in the Comment Forum (with six Project Surveys and two Ranking Exercises submitted in Spanish). Across the four online tools, nearly 950 responses were collected. These exercises concluded on December 21, 2018 except that the general Comment Forum remains open to collect ongoing input.
POP-UP EVENTS In Round 1, PlaceWorks held two pop-up events to notify people about the project, answer questions, and collect responses to the online surveys via iPads with internet access. Pop-up booth materials included the project postcard, intercept survey, 24”x36” service area map, and giveaways such as reusable shopping bags, key chains, and pens donated by WCCTAC and pencils donated by WestCAT.
The first pop-up occurred at the weekly Pinole farmer’s market on Saturday, December 1, 2018. Despite cold and rainy weather, PlaceWorks staff spoke to about 35 people interested in the project and collected 25 survey submittals. On Sunday, December 2, 2018, PlaceWorks held a second pop-up event at the Hercules community tree lighting. At the WCCTAC booth, kids decorated holiday busses and bookmarks while adults filled out surveys. PlaceWorks collected another 25 submittals.
INTERCEPT SURVEYS Kimley-Horn and PlaceWorks also conducted six separate intercept surveys, and an analysis of the survey results follows this section of the memo.
Transit Intercept Surveys Kimley-Horn performed intercept surveys at four transit center locations: El Cerrito Del Norte BART Station, Hercules Transit Center, Richmond Parkway Transit Center, and Richmond BART Station. The surveys were conducted in person via internet-connected iPads during morning and evening commute times over a period of three days, November 14, 15, and 28, 2018. A total of six three-hour blocks were completed. During this time, 192 surveys were collected online with 20 more completed on paper copies that were later inputted online. Project postcards with the survey link were distributed to people who didn’t have the time to complete the survey on-site.
Emeryville Intercept Surveys PlaceWorks conducted two additional intercept surveys to solicit input directly from employees in Emeryville. The first was conducted on December 12, 2018 from 7:30 a.m. to 9:30 a.m. on board the Emery Go Round. The surveyors announced the purposed of the project, asked if anyone was from Contra Costa County, and then rode with respondents while they filled out the survey. Out of roughly 150 people approached, only three completed surveys, as most riders were not West Contra Costa County commuters.
On December 13, 2018, the surveyors walked between 65th Street and Powell Street along Hollis Street from 11:30 a.m. to 1:30 p.m. Surveys were conducted at major intersections and in front of
Original PDF, page 52
February 21, 2019| Page 5 popular lunch spots. Out of roughly 140 people approached, eight people from Contra Costa County filled out a survey. Again, the majority of people contacted were not West Contra Costa County commuters.
An interesting comment received is that Emeryville will be implementing stricter parking measures (like meters), so this respondent was interested in the express bus service as an alternative to both driving and parking. PlaceWorks handed out flyers to everyone that took the survey or expressed interest in the project.
Large Employer/Employee Outreach PlaceWorks contacted about 30 companies located in Mission Bay, Oakland, Emeryville, and Berkeley in order to collect data on ways to best encourage their employees to commute by express bus.
Appendix B includes lists the companies contacted. One or two companies from each portion of the project study area expressed interest in learning more about the project. Due to employee time constraints and the geographical spread of these companies, no company agreed to an in-person focus group on site for Round 1.
PlaceWorks held a project webinar on December 6, 2018 to reach employees at companies that have expressed interest in the project. The webinar included polling features to make it interactive and engaging for participants. Representatives from four companies attended the webinar, and each was asked for follow-up data and to see if their company would be interested in hosting an in-person focus group. Pixar in Emeryville and Commute Solutions at John Muir Health in Berkeley have shown interest in hosting an in-person focus group.
Analysis of Survey Results
This section summarizes the survey results and is organized by each survey type. PROJECT SURVEY PlaceWorks performed two sets of analysis: data from all survey respondents, and only responses from West Contra Costa Commuters (commuters from San Pablo, Richmond, Pinole, Hercules, and unincorporated communities going to destinations in Berkeley, Oakland, Emeryville, and San Francisco). West Contra Costa Commuters comprised 72 percent of all respondents. Since the majority of survey respondents are from West Contra Costa County, the results did not change substantially between the two datasets. Accordingly, the following analysis primarily presents responses from the entire dataset; however, any significant differences between the two datasets are noted.
Transit Riders vs. Non-Transit Riders Methodology To identify trends germane to automobile versus transit commuters, PlaceWorks divided responses into three categories: transit commuters, automobile commuters, and people that took a combination
Original PDF, page 53
February 21, 2019 | Page 6 of these two modes. To determine these three groups, PlaceWorks employed the following assumptions based on how respondents answered Question 4 of the Project Survey:
- If respondents marked that they took local bus, express/commuter bus, or BART, they are counted as a transit commuter. All respondents who indicated that they biked, walked, or scootered to work also indicated they commuted by some form of transit. Therefore, transit riders, pedestrians, cyclists, and scooter riders all counted as transit commuters.
- If respondents marked that they drive alone, carpool, or Lyft/Uber, they were counted as an automobile commuter.
- If respondents marked that they took both transit and automobile, they were considered to be combination commuters.
Throughout this section, each Project Survey question is evaluated by transit riders, non-transit riders, and combination commuters. Commute Start/End Points The first two questions asked about commute origins and destinations. Results to these questions are shown in Figures 1 and 2. Since nearly half of the total responses were completed at the Hercules transit station during the morning commute, it is not surprising that 55 percent of respondents started their commute in Hercules. The second largest commute origin, at 15 percent, was Richmond.
Commuters originating from Pinole were the third highest, representing 12 percent of all respondents. The majority of respondents, 52 percent, were commuting to San Francisco. Oakland and Berkeley were the next most popular destinations, with 17 percent and 13 percent of all respondents, respectively. There was a slight difference in the destinations of West Contra Costa Commuters from the rest of the survey respondents, with 60 percent commuting to San Francisco, 20 percent to Oakland, 15 percent to Berkeley, and 5 percent to Emeryville.
Major Takeaway: 45 percent of surveys received (212 out of 471) were collected during intercept surveys at the Hercules Park in Ride. As such, transit riders from Hercules that are going to San Francisco for accounted for a significant portion of the surveys collected.
Arrival Time for Work/School Question 3 asked respondents what time they need to arrive at work/school. Approximately 23 percent of respondents need to arrive at work by 8:00 a.m., followed by 17 percent by 9:00 a.m., and 11 percent by 8:30 a.m. as shown on Figure 3.
Major Takeaway: About half of commuters need to arrive by 9:00 a.m.
Original PDF, page 54
February 21, 2019| Page 7 Figure 1: Q1 In what City does your daily commute begin? Figure 2: Q2 In what City is your place of employment/schooling?
0% 5% 10% 15% 20% 25% 30% 35% 40% 45% 50% 55% Antioch Berkeley Concord Danville El Cerrito Emeryville Hercules Martinez Oakland Pinole Pittsburg Pleasant Hill Richmond San Francisco San Pablo Unincorporated Contra… Walnut Creek Sum of Transit, bike, or walk to work Sum of Drive Alone, Carpool, or Lyft/Uber to work Sum of Combination of driving and taking transit to work 0% 5% 10% 15% 20% 25% 30% 35% 40% 45% 50% 55% Antioch Concord El Cerrito Hercules Lafayette Martinez Oakley Orinda Outside of Contra Costa County Pinole Pittsburg Pleasant Hill Richmond San Pablo Unincorporated Contra Costa County Percentage of Respondents Sum of Transit, bike, or walk to work Sum of Drive Alone, Carpool, or Lyft/Uber to work Sum of Combination of driving and taking transit to work
Original PDF, page 55
February 21, 2019 | Page 8 Figure 3: Q3 What time do you need to arrive at work/school? Note: 18 people responded with vague answers, which are labeled as “Not Available” (“NA”).
0% 5% 10% 15% 20% 25% NA 4:15:00 AM 5:00:00 AM 5:30:00 AM 5:45:00 AM 6:00:00 AM 6:15:00 AM 6:30:00 AM 6:45:00 AM 7:00:00 AM 7:15:00 AM 7:30:00 AM 7:40:00 AM 7:45:00 AM 7:50:00 AM 7:55:00 AM 8:00:00 AM 8:10:00 AM 8:15:00 AM 8:20:00 AM 8:30:00 AM 8:45:00 AM 9:00:00 AM 9:15:00 AM 9:30:00 AM 10:00:00 AM 10:15:00 AM 10:20:00 AM 10:30:00 AM 11:00:00 AM 12:00:00 PM 1:00:00 PM 1:30:00 PM 2:00:00 PM 3:00:00 PM 5:30:00 PM 8:00:00 PM 9:00:00 PM 10:00:00 PM 10:45:00 PM 11:00:00 PM Percentage of Respondents Combination of driving and taking transit to work Drive Alone, Carpool, or Lyft/Uber to work Transit, bike, or walk to work
Original PDF, page 56
February 21, 2019| Page 9 Transportation Mode Split As shown in Figure 4, West Contra Costa commuter respondents take express/commuter buses more and have lower rates of driving alone compared to the total survey population. As mentioned above, because many of the responses were taken at transit centers or stations, a follow-on survey at locations could yield different commute mode choices.
Figure 4: Q4 How do you make your commute today? Major Takeaway: Most respondents rely on transit to commute to school or work. Commute Duration Figures 5 and 6 show the survey respondents’ average commute times. The majority of respondents, approximately 65 percent, had 46 to 90 minute commutes for both the AM and PM commute. A higher percentage of transit users had longer commutes compared to other modes. Many respondents reported longer afternoon commutes.
Major Takeaways: Most respondents have a commute time duration between 46 and 90 minutes. Commute times generally increase in the afternoon.
0% 5% 10% 15% 20% 25% 30% Percent of Responses West Contra Costa Commuters Total Respondents
Original PDF, page 57
February 21, 2019 | Page 10 Respondents that take public transit or a combination of modes usually have a longer commute time compared to those who drive alone.
Figure 5: Q5 Door to door, how long does your commute take in the AM? Figure 6: Q6 Door to door, how long does your commute take in the PM? Parking This section looks at the cost people pay for parking. Figure 7 shows that of the respondents who pay for parking, 44 percent paid between $1 to $10 to park, and of this group, most take public transit or a combination of driving and transit for their commute. Among the respondents who park for free, 13 percent drive alone, whereas only 10 percent commute by transit or some combination thereof. Of 0% 5% 10% 15% 20% 25% 30% 35% 40% 45% 0 to 15 minutes 16 to 30 minutes 31 to 45 minutes 46 to 60 minutes 60 to 90 minutes 90 to 120 minutes Over 120 minutes Percentage of Respondents Combination of driving and taking transit to work Drive Alone, Carpool, or Lyft/Uber to work Transit, bike, or walk to work 0% 5% 10% 15% 20% 25% 30% 35% 40% 45% 0 to 15 minutes 16 to 30 minutes 31 to 45 minutes 46 to 60 minutes 60 to 90 minutes 90 to 120 minutes Over 120 minutes Percentage of Respondents Combination of driving and taking transit to work Drive Alone, Carpool, or Lyft/Uber to work Transit, bike, or walk to work
Original PDF, page 58
February 21, 2019| Page 11 the West Contra Costa County respondents who park for free, 7 percent drive alone and 8 percent commute by transit or some combination thereof.
Figure 7: Q7 If you now drive for any portion of your commute, how much do you pay for parking each day? Major Takeaways: The average cost to park for survey respondents was between $1 and $10 a day.
Of the respondents who park for free, 13 percent drive to work compared to 10 percent who took transit or a combination of transit and driving.
Non-Commute Travel Needs As shown in Figure 8, only 9 percent of respondents need access to a car while at work or school. 0% 5% 10% 15% 20% 25% 30% 35% 40% 45% 50% I do not drive Free $1 to $10 $11 to $20 $21 to $30 Over $30 Percentage of Respondents Combination of driving and taking transit to work Drive Alone, Carpool, or Lyft/Uber to work Transit, bike, or walk to work Figure 8: Q8 Do you need a car during the day once you've reached your place of employment?
0% 10% 20% 30% 40% 50% 60% 70% 80% 90% 100% No Yes Percentage of Respondents Combination of driving and taking transit to work Drive Alone, Carpool, or Lyft/Uber to work Transit, bike, or walk to work
Original PDF, page 59
February 21, 2019 | Page 12 Figure 9 depicts whether respondents make errands to/from work and, if so, what type of errands they make. Approximately 62 percent of total respondents combine errands with commuting. The majority of respondents, who do not make errands to/from work or school, or 45 percent, are public transit riders. The most common errand that respondents make, regardless of travel mode, is stopping to shop. A greater percentage of respondents who drive, or do so in combination with transit, need to drop off kids at school/daycare compared to transit riders. Other categories that were commonly listed as errands people make were banking and medical appointments Major Takeaways:
Most respondents do not need a car once they reach their commute destination. Transit riders are less likely to run errands to/from work compared to other modes.
Bus Fare Pricing Figure 10 shows how much respondents would be willing to pay for a one-way express bus fare. The majority of respondents (52 percent) identified that they are willing to pay between $2.50 and $5 for each trip. This is comparable to the existing fare of the Lynx Transbay bus of $5.1 Approximately 33 1 www.westcat.org/fares, accessed January 8, 2019.
Figure 9: Q9 If you often make stops to run errands on your way to/from work, what types of errands do you make? 0% 10% 20% 30% 40% 50% 60% 70% 80% 90% 100% Transit, bike, or walk to work Drive Alone, Carpool, or Lyft/Uber to work Combination of driving and taking transit to work Percentage of Respondens Other Stop to Shop Drop off kids at school/daycare Go to Gym I don’t run errands on the way to/from work
Original PDF, page 60
February 21, 2019| Page 13 percent or respondents are willing to pay between $5 and $10, and 15 percent of respondents said that the bus price would have to be less than $2.50 for them to use it. Existing transit riders would be willing to pay more money for an express bus fare compared to other travel modes.
Major Takeaway: 52 percent of respondents say they would be willing to pay between $2.50 to $5.00 for a one-way express bus ticket. Figure 10: Q10 How inexpensive would a new one-way express bus trip have to be for you to use it?
Obstacles to Taking Transit The final question on the survey asked respondents to rank the reasons why they do not take transit (existing transit riders were directed to skip the question). A total of 187 respondents answered this question, and 278 skipped it. During routine monitoring of the survey results, Kimley-Horn noted that the ranking response results were in the same order as the question. To determine if this affected the accuracy of the results, PlaceWorks randomized the response order on November 29, 2018. Figure 11 shows how results differed before and after the responses were randomized.
The responses before randomization followed the order in which the responses where shown on the questionaire, with “Doesn’t go where I need it to go” being first and “I don’t have a way of getting to a transit stop” being ranked last. Once the responses were randomized, some of the factors changed significantly, atlthough the top two respones were still highly ranked: the number one reason after randomization was that people didn’t take transit due to the travel time taking too long and the second reason was that transit did not go where they needed it to go. The answers “Concerns about personal safety”, “Work hours don’t allow for it”, and “I don’t have a way of getting to a transit stop” all ranked significantly higher after the randomization.
0% 10% 20% 30% 40% 50% 60% Less than $2.50 $2.50 to $5.00 $5 to $10 Percentage of Respondents Combination of driving and taking transit to work Drive Alone, Carpool, or Lyft/Uber to work Transit, bike, or walk to work
Original PDF, page 61
February 21, 2019 | Page 14 Figure 11: Q11 If you don’t take transit to commute today, why not? Major Takeaways: After randomization, the highest ranked reason why people don’t take transit to commute is due to travel time taking too long.
After randomization, the lowest ranked reason is that they don’t know enough about transit options. RANKING EXERCISE The Ranking Exercise asked respondents to rank the factors that influence whether or not to ride transit. Bus frequency, reliability, and shorter trip duration were the top factors respondents considered when taking transit. Figure 12 shows the outcome of the survey with all responses together. The higher the rank indicates which factor was more important to the survey respondent.
Figure 12: Please rank the factors that you consider when taking public transit in order of importance: I don’t know enough about the transit options I don’t have a way of getting to a transit stop I need my car during the day Costs too much Concerns about personal safety Work hours don’t allow for it Not reliable enough Doesn’t go where I need it to go Travel time is too long Score Rank After Nov 29 Before Nov 29 Bike rack availability Ability to work on bus Parking availability Availability of wi-fi and power outlets Comfort Real-time arrival information Proximity of bus stop to home/office Cost Clean and safe Shorter trip duration Reliability (arrives on schedule) Bus frequency (arrives every 15 minutes) Score Rank
Original PDF, page 62
February 21, 2019| Page 15 On November 29, 2018, the Ranking Exercise was updated to randomize the order of the factors that people would consider when riding public transit. There were 57 respondents past this date and 181 respondents prior to randomization. Figure 13 shows the results collected before and after PlaceWorks randomized responses. While both bus frequency and reliability ranked high, one of the largest discrepancies is the ranking factor of proximity of bus stop to home/office. More respondents scored this category as important after randomizing than before by more than 2 points. Ability to work on the bus, availability of Wi-Fi and power outlets, and bus frequency had a lower ranking of importance after the results were randomized.
Figure 13: Ranking Results Before and After Randomization on November 29th Major Takeaways: Proximity of bus stop to home/office was ranked significantly higher after the order of factors was randomized.
Ability to work on bus, availability of Wi-Fi and power outlets, and bus frequency were ranked lower after randomization. Reliability and bus frequency were both highly rated before and after randomization.
DEMOGRAPHICS SURVEY The project team collected voluntary demographic data from survey respondents to gauge whether the outreach campaign was reaching a wide range of study area population. The Demographics Survey was an optional survey. A total of 196 people responded to this survey.
Bike rack availability Ability to work on bus Parking availability Availability of wi-fi and power outlets Comfort Real-time arrival information Proximity of bus stop to home/office Cost Clean and safe Shorter trip duration Reliability (arrives on schedule) Bus frequency (arrives every 15 minutes) Score Rank After Nov 29 Before Nov 29
Original PDF, page 63
February 21, 2019 | Page 16 As shown in Figure 14, the highest cohort of respondents, nearly 30 percent, were between the ages of 30-39 years. Respondents 60 and over represented 12 percent of the total respondents. Since most of the intercept surveys were done at transit centers and stations during commute times, it is not surprising that there were fewer respondents 60 and over. Approximately 84 percent of respondents were between 20 and 59 years old.
Figure 14: Q1 How old are you? As shown in Figure 15, nearly 40 percent of the survey respondents were from Hercules, which is most likely due to the intercept surveys and one pop-up event being held in this city. A total of 81 percent of respondents lived in West Contra Costa County.
Figure 16 shows the race/ethnicity of respondents who identified as follows: 36 percent white, 25 percent Asian, 12 percent Black or African American, and 11 percent identified as Hispanic or Latino.
The remaining 16 percent included people that identified as other races/ethnicities, a combination of races/ethnicities, American Indian and Alaska Native, or Native Hawaiian and other Pacific Islander.
0 - 19 years old 20 - 29 years old 30 - 39 years old 40 - 49 years old 50 - 59 years old 60 - 69 years old 70 - 79 years old + 80 years old 0% 5% 10% 15% 20% 25% 30% 35% Percentage of Respondents
Original PDF, page 64
February 21, 2019| Page 17 Figure 15: Q2 Where do you live? Figure 16: Q3 How would you identify your race/ethnicity? 0% 5% 10% 15% 20% 25% 30% 35% 40% 45% Hercules Pinole Richmond San Pablo Rodeo Crockett Unincorporated Contra Costa County Other Cities within Contra Costa County Outside of Contra Costa County Percentage of Total Respondents White Asian Black or African American Hispanic or Latino Native Hawaiian and Other Pacific Islander American Indian and Alaska Native Two or More of the above Races/Ethnicities Other Race/Ethnicity 0% 5% 10% 15% 20% 25% 30% 35% 40% Percentage of Total Respondents
Original PDF, page 65
February 21, 2019 | Page 18 In Figure 17, the largest cohort of respondents (21 percent) identified a household income of $100,000 to $150,000. The Area Median Income for Contra Costa County is $104,400, as established through the US Department of Housing and Urban Development (HUD).2 Approximately 20 percent of the respondents have household incomes of $50,000 or less, while 34 percent of respondents have a household income of over $150,000.
Figure 17: Q4 What is your family or household income? Major Takeaways: Approximately 81 percent of the respondents live in West Contra Costa County, with another 11 percent residing elsewhere in Contra Costa County.
Approximately 64 percent of the respondents identify their race/ethnicity as non-white. Approximately 20 percent of respondents have a household income of less than $50,000.
COMMENT FORUM SUMMARY People had the option of submitting an online comment to share their ideas about the new express bus service. In total, 46 people submitted comments. Appendix C shows each individual comment.
General themes from the comments include: People believe that this bus service is needed, especially between West Contra Costa and the East Bay.
A few respondents mentioned that there were enough routes to San Francisco already, such as the LYNX bus, and thought that efforts should be focused exclusively on East Bay destinations.
2 https://www.huduser.gov/portal/datasets/il.html, accessed January 9, 2019. Less than $25,000 $25,000 to $49,999 $50,000 to 74,999 $75,000 to $99,999 $100,000 to $150,000 $150,000 to $200,000 $200,000 or more 0% 5% 10% 15% 20% 25% Percentage of Respondents
Original PDF, page 66
February 21, 2019| Page 19 Many people questioned how the new express bus service would connect to other existing transit options, like BART connections at the 19th Street and MacArthur Stations in Oakland, the new Richmond Ferry Terminal, and regional bike paths.
A few respondents noted that LYNX bus lines during peak commute times are usually overcrowded and suggested having multiple express busses during this time.
Some people brought up concerns about the traffic on I-80 and, if the bus makes stops frequently, it may create a longer commute than other modes.
Some identified concerns about the lack of transit connections between East Contra Costa and West Contra Costa. Six commenters asked that transit service be expanded on weekends and holidays as well as having some service during non-commute hours.
Generally, people felt safer on an express bus than on BART.
Next Steps
Outreach for Round 1 concluded on December 21, 2018. Round 2 outreach efforts will be undertaken during March through May 2019. In Round 2, the project team will share and seek feedback on potential express bus route alignments and stop locations. Round 2 outreach will include another two pop-up events, employee focus groups, and online engagement.
Conclusions and Recommendations
CONCLUSION #1: ROUTE TIMING Most survey respondents need to get to work between 7:00 a.m. and 10:00 a.m. Commuters would be more likely to take public transit with shorter bus headways and if their overall trip duration were reduced. The average travel time of respondents was between 60 to 90 minutes; the new express bus should aim to be within or faster than this timeframe. At the same time, the Plan should consider the transit needs of people who are retired, work on weekends/holidays, or have non-traditional work hours, who could also benefit from express bus service.
CONCLUSION #2: PRICING A majority of respondents indicated that they would be willing to pay between $2.50 and $5 for a one-way express bus ticket. This is comparable to the existing prices of the LYNX express bus.
Approximately 30 percent of respondents said they would be willing to pay between $5 and $10 a ride; and a few people mentioned in the Comment Forum that the express bus would need to compete with BART fares.
Original PDF, page 67
February 21, 2019 | Page 20 CONCLUSION #3: BUS AMENITIES Although comfort amenities such as bike racks and the ability to work or use Wi-Fi on the bus could be helpful in attracting new riders, these categories generally scored low in the ranking exercises.
Ultimately, having a reliable and convenient bus route was the most important factor in transportation choice. CONCLUSION #4: COMMUTE DESTINATIONS While more than 50 percent of respondents commute to San Francisco, some of the comments received reflect a desire for an express bus that only stops in East Bay destinations, especially since other express buses and BART already provide service to San Francisco.
Original PDF, page 68
February 21, 2019| Page 21
Appendix A
List of organizations contacted for press releases or newsletter outreach.
Press Release Recipients
Neighborhood Councils
The Advocate Atchison Village Neighborhood Council Bay Citizen Belding Woods Neighborhood Council Bay City News Castro Heights Neighborhood Council Berkeleyside Coronado Neighborhood Council Contra Costa Herald Crescent Park Apartments Residential Council Contra Costa Marketplace Magazine Eastshore Neighborhood Council East Bay Times El Sobrante Municipal Advisory Council El Cerrito Patch Fairmede Hilltop Neighborhood Council E'ville Eye Community News Greenbriar Neighborhood Council Pinole-Hercules Patch Hilltop District Neighborhood Council Oakland Post News Group Iron Triangle Neighborhood Council Richmond Confidential* Laurel Park Neighborhood Council Richmond Standard Marina Bay Neighborhood Council Richmond Pulse May Valley Neighborhood Council Univision North & East Neighborhood Council Panhandle Annex Neighborhood Council Parchester Village Neighborhood Council Park Plaza Neighborhood Council Point Richmond Neighborhood Council
Newsletter Recipients
Pullman Neighborhood Council City of San Pablo Social Media Quail Hill Neighborhood Council City of San Pablo E-Newsletter Richmond Annex Neighborhood Council City of Pinole City Manager's E-Newsletter Richmond Heights Neighborhood Council City of Hercules City Manager's E-Newsletter Richmore Village/Metro Square Neighborhood Council City of Richmond City Manager's E-Newsletter Santa Fe Neighborhood Council Richmond Chamber of Commerce Shields-Reid Neighborhood Council City of El Cerrito Social Media SW Richmond Annex Neighborhood Council Bold indicates organizations and jurisdictions that published a news article about the project. All have been contacted at least twice.
Original PDF, page 69
February 21, 2019| Page 22
Appendix B
List of organizations contacted for employer focus groups.
Employer and Location
San Francisco
Emeryville Cisco Systems Inc. Emeryville Transportation Management Association Dropbox Clif Bar & Co Gap, Inc. Mission Bay TMA Grifols Diagnostics Solutions Uber IKEA UCSF LeapFrog Oaks Card Club Oakland Novartis* Alta Bates Summit Medical Center, Summit Campus Peet’s Coffee & Tea Inc.
BART Pixar* City of Oakland Stanford Health Care Zephyrus Biosciences Clorox County of Alameda* Berkeley Kaiser Permanente Alta Bates Pandora Media Bayer Healthcare Stanford Health Care City Sports UCSF Benioff Children’s Hospital John Muir Health* West Berkeley Shuttle UC Berkeley (Berkeley) Bold indicates companies that responded to an email and/or phone call. Most have been contacted at least twice.
Asterisk (*) indicates that someone from that company attended the Webinar, hosted on 12/6.
Original PDF, page 70
February 21, 2019| Page 23
Appendix C: Comment Forum (52 respondents)
We Need an express non-stop bus from transit center to Downtown Oakland with stops along Broadway from 19th St to Jack London Square. Does "commuter" refer only to riders using the service on weekdays? I'm retired, and I would like good express service on weekends, as well.
It would be nice to have a bus services from Hercules to Oakland (12th St.-City Center) during the rush hours in the morning and the afternoon.
I currently take the Lynx from my neighborhood in Hercules to the Bart transit city in Hercules, then whichever bus leaves the transit center first headed to the Del Norte Bart station, then a Bart train to 12th street city center station downtown Oakland. It is very stressful, takes coordination and trains are crowded and I'm not comfortable with sitting down on some of the seats in the Bart trains. I commuted for over two years to dpwntown SF via the Westcat Lynx...best commuting experience that I have ever had. I arrived to my destination relaxed and enjoyed a comfortable ride to SF. Please, please consider a lynx style bus route from Hercules to downtown Oakland, even if its only a morning and evening route for starters. Thank you very much for your consideration!! Best regards, I live in El Sobrante and there is no direct service to el cerrito del norte bart or plaza. The #70 which I must walk several blocks to, parts have no sidewalk and must walk in the dark with cars traveling in excess of 80mph during early morning and late night hours, when I walk and catch the bus is dangerous. Please bring express service to El Sobrante direct to Bart Stations excluding Richmond Bart, which coworkers have experienced close muggings and intimidation. Thank you!
I love the idea of an express bus that connects Richmond to SF. I live near San Pablo Ave and Moeser Lane in Richmond Annex. It is VERY VERY difficult trying to take BART to SF. If I drive from my house to the BART station, there's no place to park (all the spaces are already taken). But if I try to take the AC Transit bus from San Pablo Ave to BART, the service is completely unreliable. Sometimes the bus shows up, sometimes it doesn't. If you're going to have a bus, please make sure it shows up when it's supposed to.
Please add a bus stop at Stanton Ave and San Pablo Ave or La Puerta Rd, Richmond, CA and San Pablo Ave towards Berkeley. We should try this express bus service since the traffic on Hwy 80 is one big nightmare.
Option A: If there is a central stop at the MacArthur bart station for Oakland, that would help to bypass most of the freeway and is a good place for many ppl to do a short Bart transfer to the other Oakland Bart stops (between MacArthur , 19th, 12 St stations). **A stop near 19th Bart station is preferable.** Option B:
Another option is to do an Express bus from Hercules to several oakland stops near the current Bart stations. That way there's only several stops for ppl to wait for. I'm not sure how you could connect Jack London square and Chinatown though.
Express service to Oakland, Berkeley, and Emeryville from the Pinole/Hercules area is badly needed. I personally limit my job options as a result of the horrible Bay Area commute.
Original PDF, page 71
February 21, 2019| Page 24 I think there are enough commuter transits going to San Francisco. I think more commuter Transits need to go to more EastBay downtown areas i.e. Oakland, Berkeley, Emeryville.
Speeding up traffic on hwy 80 won't do much: one has to travel to and from 80 at both the start and end of each journey. Public transit has to (1) connect places we live to places we work and (2) run more often than once every 15 minutes during rush hour. Please, make public transit viable for people who don't want to waste their lives commuting.
Expand Actransit 72R where the service to start early for early bird commuters in Hercules and nearby neighborhood when catching the rapid bus at El Cerrito Del Norte with less stops to get to downtown Oakland in 20 minutes. Bart can be problematic so this viable option would help daily commuters to have another alternative.
I'd like better service within West County; do you know how many buses it takes to go from Downtown Richmond to Pinole Vista or Hilltop Mall? And how much time is involved? Or getting to Walnut Creek without multiple transfers?
I am thrilled to hear that you are studying express buses to the cities listed; it will be a godsend to riders. I would also like to see Westcat coordinate with AC Transit so that riders can get anywhere on San Pablo Avenue with no more than one transfer. Specifically, there should be an AC Transit stop near the corner of San Pablo Ave and Richmond Parkway (there is a Westcat stop near that intersection already). That way, riders could get to important stops in San Pablo (including City Hall and the library) without having to go so far out of their way.
- I find it appalling that residents of West CCC have no viable way of using public transportation into East CCC. I live in Pinole and work at Los Medanos College and would love to take public transportation. Currently that would mean: taking a bus to El Cerrito Del Norte, taking a train into Oakland( WHY???), transferring to an Antioch bound train, then transferring to another bus to get to the college. It would take me roughly 2.5 -3 hours. 2) If there is not BART line from
Richmond to East County (and again, WHY??), then there should be an express bus to a BART station along the Antioch-SF line -- preferably to the North Concord/Martinez line to take advantage of Highway 4 ease. An express bus going on El Camino to Orinda BART would not be an express at this point -- that route is a parking lot after 7am in the morning, and after 4pm in the afternoon. 3) Give CCC residents safe, clean, fast and affordable public transportation to other spots in CCC -- why is the assumption that all CCC residents are working in the East Bay or SF?? Please make this happen! I am having to drive approximately 3 hours/day on days when I have to drive to Lafayette and Oakland to drop off my kids, then drive to work in Pittsburg, then drive back to Oakland, then drive back to Pinole. It's hell. Truly. Make public transportation possible for families like mine!
The title of the post card I received about this issue: Shorten Your Commute! I don't see that happening. I work in Concord and if I take the bus, it will take me twice as long to get to work & back to the transit parking lot than if I drive. That's the main reason I don't take public transportation with the exception of BART.
I work approximately 5 miles from the Concord BART, but I have experienced the same problem with the buses at that station: they start/stop too often and don't drop off near my place of work. I don't mind the walk from where the bus drops me, but the timing is unreliable. I don't see this project doing any better than what we already have for public transportation.
We need better BART accessibility: line extensions, in-fill stations, and at least a second bay crossing. Buses are a terrible stop-gap, they just mean more traffic.
Original PDF, page 72
February 21, 2019| Page 25 Make Amtrak commute train stop in Hercules please! I use Westcat, Lynx and Bart often and would love to see, Westcat and Lynx offer weekend service. The idea of express service to other east bay citities is brilliant.
Travel to Hohhot, Inner Mongolia, PRC; and look at their Bus Rapid Transit System. The transit system uses the Freeway Median with stations in the middle of the Freeway.
it would be of interest depending on where it stops and how many stops it makes after i get on I commute near Valley View El Sobrante (De Anza HS), but the AC Transit transbay buses make too many stops in Richmond before getting on 80, slowing down the entire commute. (Also, if I take the 74 local bus to the L or LC I have to catch a very early bus. Therefore, I drive from El Sobrante to Hércules to catch the Lynx!! Why not have the 74 continue to Orinda BART, and or have an Express bus from El Sobrante or Pinole which would immediately get on 80. There are many people in the El Sobrante Pinole área that do not have good options. AC Transit and Westcat are competing too much instead of working together to make it easier for the commuters!! Parking in Hércules Transbay center is extremely dangerous. My car tires were slashed. Most people who I spoke to had their cars broken into. BART should provide cameras. No phone service in case of emergency. Poor cellular connections. We hope you listen to the commuters!!
Bus should stop near Hercules Downtown at bike route. Better way to get/pay for monthly passes. Used to use express bus from Point Richmond. Direct service from Point Richmond going to El Cerrito Plaza where I can go shopping and take BART, along 580 and 80 would be a great help to me if I'm to use a bus. Likewise, it would be helpful to have direct service along Garrard to Barrett to go to Kaiser, the Post Office and City Hall.
We need better bus service to Marin from Hercules via Richmond Parkway. With traffic and being indirect it's not ideal to take a bus along congested highway 80 and transfer at el Cerrito del Norte where connections are easily missed.
This is a wonderful idea. My concern is cost and reliability. I take the JPX and sometimes the bus doesn’t come or it does really late. If the current lines aren’t always reliable, what will happen if and when there are express busses? I also hope the express busses are reasonably priced.
I currently use WestCat to connect with AC Transbay bus at Richmond Transit center in the morning, but in the evening I have to use BART to get home because AC Transbay service in the PM is much less reliable and there is poor coordination between AC Transit and WestCat bus schedules.
This sounds like a great idea! I would take the bus if it ran as frequently as BART and did not cost more. $2.00 each way. Or, I'd pay $3.50 each way if it included free parking. If it costs more than that, I would ride BART.
Original PDF, page 73
February 21, 2019| Page 26 To avoid traffic on the 80 I leave my house at 5:30am to get to work at 6am. I'll leave work at 2pm or 2:30pm to get home by 3pm. Using BART takes too long to get to work in Emeryville because I need to either drive to BART or take a bus to BART, BART to MacArthur station, and then take the Emeryville-go-round.
WEST should run the express bus services between San Francisco and Hercules at weekends too. I quite often go to SF on Sunday. Bart is always crowded but their stations and cars are filthy quite often I run into some crazy passengers. I have no doubt I am not the only one who feel this way and that once you start bus services, people in Hercules, Berkeley and other cities will be attracted instead of Bart. Weekend services by Lynx is definitely needed for those who want a safe and quiet trip to and from SF Thanks The West Contra Costa County Express Bus Implementation Plan should also include a 7-day circuitous bus route on strategic points around Hercules starting and ending at the Transit Station so residents will be encouraged to shop and work in Hercules.
I really appreciate bus service for commuting. I commuted to San Francisco for approximately two years with Westcat Lynx and it proved to be the best form of transportation for me. The trans bay buses are comfortable, clean, the drivers skilled and professional and I always felt safe and not stressed out, like when I drove my personal car to work in prior years. I would like to see a similarly model as the Lynx service from Hercules to downtown Oakland. I appreciate this survey and would like more information about this project. My husband commuted to SF for decades and he preferred the bus instead of Bart and so do I.
Thank you very much! I would like to see the carpool lane reserved ONLY for busses on Hwy 80 during commute hours. if that happened, buses could get into SF in 20 minutes instead of 45-90 minutes! Once people hear (and see) that bus travel is SIGNIFICANTLY faster, easier, more pleasant than driving - everybody would take the bus. You'd be able to park tons of cars at Hilltop Mall and other areas and run super frequent busses every 15 minutes full of people. Think big! Try it out for one hour one day and see. The current gridlock on hwy 80 is hurting business in our area, and contributing to the decline of quality of life in the bay area. I encourage you all to think big and make changes happen! lots of love.
As you do these surveys, keep in mind that people in our area may not work in Berkeley, Emeryville and Oakland precisely because there is no rapid bus service to these East Bay job centers. If there was an easy way to commute from here to the east bay I could consider jobs in the east bay, but currently its easier to commute to SF so that is where I work.
There needs to be rapid bus service from the Richmond ferry terminal to and from the Richmond Parkway Transit Center, Hercules transit center, El Cerrito Del Norte Bart and Richmond Bart when ferry starts running in January.
I would love to see Lynx travel from Hercules to Oakland. Blue Shield is moving our headquarters from SF to Oakland (12 street) in Q4/2019 and I would rather take Lynx than drive to BART del Norte station and BART rest of the way to OAK. Many Blue Shield employees live in Hercules and take the Lynx into SF today.
Don’t add these additional cities to existing Lynx line as I don’t want my commute to be even longer than it is today. Create additional bus lines.
With the new Richmond ferry service beginning in January, offer a route from the Hercules transit center there so residents don’t have to drive causing additional traffic.
Original PDF, page 74
February 21, 2019| Page 27 Understandably, you cannot provide every service needed or desired by everyone, but please don't forget about those of us who are not job commuters.
Weekend service to San Francisco and the East Bay would be wonderful. For example, even if the LYNX made one or two stops en route to S.F., it would still be my preferred method to cross the Bay on weekends, where I regularly go for the theater and the opera or to meet friends. Here's another suggestion, run the express buses from Hercules to the El Cerrito del Norte BART station on weekends. That gives people great convenience to access entertainment on both sides of the Bay in a timely, convenient fashion. Anything you can do to both provide alternative transit to driving and make available transit take less time would be welcome. Thank you for asking.
Please implement nextbus (real-time bus arrival times on the web) on all buses so we know when the bus will deviate from the schedule due to traffic and other conditions.
I think this is a good stop gap until we can figure out how to extend the BART line. Ultimately, Contra Costa would benefit from an extension and the residents have been paying the tax for this extension for decades.
Your survey is aimed at working commuters. However, there are many retirees who want safe, reliable options to get to Berkeley, emeryville and Oakland which Bart does not provide. I would ride a bus to shop in those cities but I won’t take Bart because there is no parking during the week and it is no longer safe.
Create a strictly bus only lane/route for faster commutes Please, run LYNX bus on weekends and holidays! A lot of people are working on those days. It is extremely hard to get to SF and back without LYNX bus service from Hercules, CA. Bart ride is too dangerous and unpleasant. At least two LYNX buses in the morning and in the evening on weekends would improve situation tremendously (for example 8:00 am and 9:00 am in the morning, and 7:00 pm plus 8:00 pm in the evening). Also, those people who would like to go to SF for fun on weekends would appreciate late evening bus (coming back from the theatres, from the restaurants).
I live in May Valley Richmond (surrounded by the unincorporated community of El Sobrante). I drive alone to and from the Del Norte BART station to get to work and wish there was a better first-mile, last-mile solution to get to BART. The 74 bus has too many stops and takes a long winded route to get to Richmond Bart. I’d like my area to be serviced by a direct, express line to get to BART, but also downtown San Francisco.
The morning and evening Lynx buses from Hercules/San Francisco need to be either bigger or increase in frequency. People arrive 15-20 mins before the scheduled arrival in the morning and sometimes don't even get a seat. The same thing occurs with the evening commute. Either have high capacity buses or have two buses show up for the popular morning and evening commute hours.
Outreach to Employee Transportation Coordinators on the Oakland/Berkeley/Emeryville end with print/digital/physical materials to distribute to any potential users. Getting the ETC's and empowering them to realize the potential for an improved transit experience would be helpful before launch.
I would not use any other stop except SF. I would not take the bus to casually go to those other cities, I would drive. But having frequent buses from Hercules to SF is good and I would actual like more buses/times between 1:30pm-3:30pm leaving SF back to Hercules
Original PDF, page 75
February 21, 2019| Page 28 An important factor for my choice in taking express buses is that they can travel in HOV lanes to avoid traffic back up. In AC Transit LA and Westcat Lynx express buses to SF, i notice more and more cars with less that three occupants are in the HOV lanes. Express buses would be even more attractive as a commute option if the police were enforcing correct use of HOV lanes and ticketing the "cheater" cars in those lanes. The "cheater" cars are growing in numbers in the HOV lanes as there is no repercussion, no police pulling people over.
I've taken the AC Transit express bus (LA) from Richmond Transit Center to SF. I switched to Westcat Lynx from Hercules Transit Center as on that route there is more frequency of buses to SF, and from SF all day and during commute home. Also appreciate Westcat lynx bigger travel coach style buses. AC Transit LA has more use of local city buses, that have less comfortable seating and feel unsafe on the highway. I would appreciate having seatbelts on buses. It's very dangerous to travel on highway with no seatbelts. Thanks for opportunity to provide feedback!
Original PDF, page 76
MEMORANDUM - DRAFT
DATE September 3, 2019 TO WCCTAC and Kimley-Horn FROM Charlie Knox and Carey Stone, PlaceWorks SUBJECT Express Bus Implementation Plan - Community Outreach Round 2 Summary Report
Project Background
This memo provides a summary of Round 2 outreach efforts for the WCCTAC Express Bus Implementation Plan project. Round 2 outreach efforts focused on preferences among potential riders for express bus pick-up and drop-off locations and factors that would influence express bus ridership.
Round 2 outreach began in April 2019 and concluded in July 2019. This memo covers the following topics:
Spreading the Word
Public Input Channels
Analysis of Round 2 Survey Results
Conclusions and Recommendations
Spreading the Word
To ensure that the community was aware of the planning process, PlaceWorks created and/or updated the following items, as described below:
Project Webpage and Other Websites
Social Media Posts
Round 2 Project Flyer
Press Releases and News Articles PROJECT WEBPAGE AND OTHER WEBSITES PlaceWorks published the Express Bus Implementation Plan project webpage on the WCCTAC website in October 2018. The webpage provides information in both English and Spanish. The webpage includes the project timeline, a way to subscribe to the project mailing list, and online engagement tools, which are further described below. The webpage address is included on both the project flyer and postcard (the postcard was developed in Round 1), and people were encouraged to visit the webpage to find out more information about the project and WCCTAC as an organization. In April 2019, the webpage was updated for Round 2, including links to the Round 2 survey page and references to the home page.
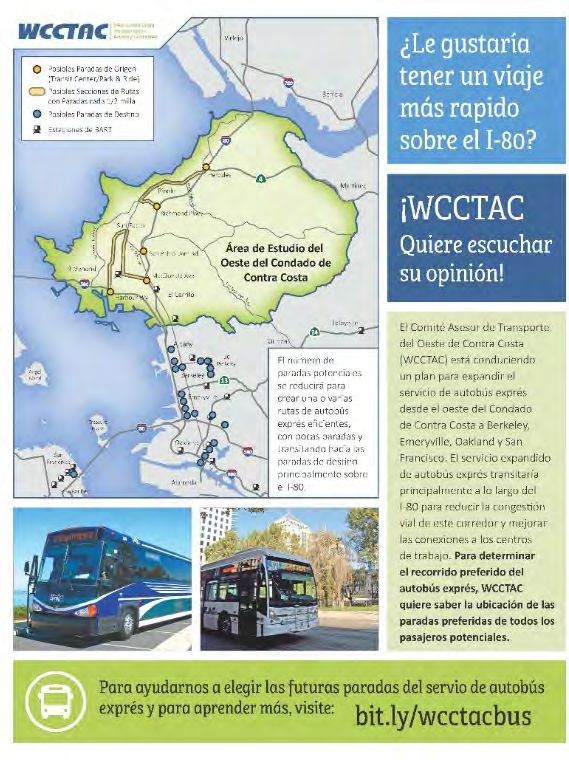
Original PDF, page 77
September 3, 2019 | Page 2 PlaceWorks notified potential riders and interested parties about the webpage by posting on social media, passing out project flyers, and creating press releases, as well as through emails to the project mailing list, partner jurisdictions, neighborhood associations, and East Bay businesses.
In addition to updating the project webpage, the City of Hercules and UC Berkeley Parking and Transportation included information about the project on their websites.
SOCIAL MEDIA PlaceWorks utilized paid advertising to announce the availability of the online surveys via three promoted Facebook posts. The promoted Facebook posts reached a total of 4,600 West Contra Costa County residents. Members of the project Technical Advisory Committee (TAC) were also asked to share the Facebook post using their social media accounts.
ROUND 2 PROJECT FLYER PlaceWorks created a flyer, both in English and Spanish, to spread the word about potential express bus stop locations and to encourage people to take the Round 2 survey. The flyer, (Figure 1), was circulated via email, provided at 8.5"x11" in person to more than 40 businesses in Berkeley and Emeryville, handed out at the Richmond Juneteenth Festival, and distributed to Emerytech and Wareham offices in Emeryville. The flyer was also printed at 24"x36" to be easily visible at pop-up events.
PRESS RELEASES AND NEWS BLURB Similar to Round 1, PlaceWorks created a press release and short news blurb to notify people about Round 2 outreach efforts and to encourage interested parties to take the online survey. The press release and news blurb were provided to:
15 news organizations
City Manager newsletters at six cities, and one chamber of commerce
26 Richmond Neighborhood Councils
WCCTAC Board, TAC, and interested parties Appendix A lists each organization that received the press release and news blurb. Figure 1 Round 2 Flyer
Original PDF, page 78
September 3, 2019 | Page 3 The following organizations posted an article about Round 2:
El Cerrito City Manager’s Update and Facebook post
City of Hercules City Manager’s B-Weekly Report
City of Pinole City Manager’s Report
City of San Pablo E-Newsletter
City of Richmond City Manager’s Weekly Report
Richmond Chamber of Commerce Newsletter
Lawrence Berkeley National Laboratory Newsletter
Front page article in the Richmond Post newspaper (Figure 2)
Public Input Channels
This section describes the various project outreach methods used to generate feedback:
Online Engagement
Pop-up Event
Outreach to Local Businesses
Employee Focus Groups ONLINE ENGAGEMENT For Round 2, PlaceWorks created a second online survey that asked respondents to identify their preferred origin and destination express bus stops among choices established after Round 1 in collaboration with the Technical Advisory Committee.
PlaceWorks collected 798 surveys between May 3, 2019 and July 22, 2019. The survey was available in English and Spanish. In addition to answering the set survey questions, participants also had the option of submitting an open-ended comment. Between February 22, 2019 and July 26, 2019, a total of 56 new comments were submitted, as listed in Appendix B.
POP-UP OUTREACH EVENTS The purposes of the Round 2 pop-up events were to notify potential riders about the project, answer questions, and direct people to the online survey. Pop-up booth materials included the project postcard, 24"x36" versions of the project flyer, and giveaways such as reusable shopping bags, key chains, and pens donated by WCCTAC and pencils donated by WestCAT.
Figure 2 WCCTAC Richmond Post Article
Original PDF, page 79
September 3, 2019 | Page 4 The two Round 2 pop-up events occurred as follows:
Richmond Juneteenth Festival (June 15, 2019). PlaceWorks staffed a booth at the Juneteenth Festival held by the City of Richmond, and discussed the project with over 60 people.
Hercules July 4th Event (July 4, 2019). Council Member and WCCTAC Board Member, Chris Kelley, staffed a booth at the Hercules July 4th Event.
OUTREACH TO LOCAL BUSINESSES In order to reach local businesses, PlaceWorks reached out to employers by phone, via email, and in person. Appendix C details the list of businesses contacted.
PlaceWorks visited 43 retail stores and businesses in West Berkeley and Emeryville to ask employers about the possibility of holding a focus group and distributing the Round 2 Outreach flyer. Multiple businesses, including Bay Street Mall, offered to distribute the outreach flyer, and REI allowed us to present at a morning huddle.
In addition, PlaceWorks coordinated with Chad Smalley, the Economic Development and Housing Manager for the City of Emeryville, to distribute the survey link to 300 businesses and request employers to host focus groups.
PlaceWorks also worked with Oakland Kaiser Permanente, Lawrence Berkeley National Laboratory (LBNL), and SalesForce to distribute an email with the survey link to their employees. The outreach undertaken by LBNL generated 97 survey responses of the 200 to 300 LBNL employees who live in West Contra Costa County.
EMPLOYEE FOCUS GROUPS PlaceWorks held a total of three focus group meetings with:
Novartis (Emeryville)
Pixar (Emeryville)
REI (Berkeley) The purpose of the focus groups was to share information about the project and get feedback on the potential express bus stop locations. A summary of each meeting is below.
Novartis Meeting – May 10, 2019 10:00 AM to 11:00 AM PlaceWorks and Kimley Horn staff met with six Novartis employees. Charlie Knox from PlaceWorks gave a short presentation and then facilitated a question and answer session. Employees were encouraged to take the survey on their mobile device or submit written comments.
Key takeaways:
Novartis is moving offices closer to the Amtrak Station and Hollis Street. Accordingly, employees favor the potential express bus stop at 59th Street.
Original PDF, page 80
September 3, 2019 | Page 5
An employee from Pinole stated that the express bus will need to be faster than driving.
Participants asked about connections to the Richmond Ferry and Amtrak and agreed to seek interest from fellow employees and neighbors near their homes.
Pixar Meeting – May 10, 2019 12:00 PM to 1:00 PM PlaceWorks, Kimley Horn, and WCCTAC staff met with eight Pixar employees. Charlie Knox from PlaceWorks gave a short presentation and then facilitated a question and answer session. Employees were encouraged to take the survey on their mobile device or submit written comments.
Key takeaways:
Some employees consistently work late, sometimes leaving the office at midnight or later, which makes taking a bus difficult if no late service or alternative mode is provided.
Several participants believe the bus should be less expensive than taking BART. Their perception is that since it isn’t Transbay, it should be less than the cost of the WestCAT Lynx route.
The office has free parking on-site, which makes switching to public transit challenging.
Participants expressed enthusiasm about the possibility of the express bus being able to use the shoulder to bypass traffic and agreed to seek interest from fellow employees and neighbors near their homes.
REI Meeting – June 14, 2019 8:45 AM to 9:00 AM PlaceWorks staff met approximately 20 employees during REI’s morning staff meeting. Charlie Knox from PlaceWorks gave a short description about the project and then facilitated a question and answer session. Employees were encouraged to take the survey on their mobile device or from home.
Key takeaway:
Employees expressed general excitement about the express bus service and agreed to seek interest from fellow employees and neighbors near their homes.
Online Comment Forum
In Round 2, respondents could also submit comments online. A total of 56 online comments were submitted between February 22, 2019 and July 26, 2019. A summary of these comments, and their frequency, is as follows:
General support for the express bus project (13)
Request for express bus stops at BART stations (10)
El Cerrito Del Norte BART (2)
El Cerrito Plaza BART (2)
MacArthur BART (2)
Original PDF, page 81
September 3, 2019 | Page 6
Martinez BART (2)
Orinda BART (1)
Walnut Creek BART (1)
Requests for specific routes (18)
El Sobrante to UC Berkeley (1)
Hercules and Pinole to Downtown Berkeley (1)
Hercules to Oakland (5)
Hercules to San Francisco Financial District (1)
Marin County (1)
Oakland to West Berkeley (2)
Pinole to Downtown San Francisco (1)
Point Richmond to Emeryville and Jack London Square (1)
Rodeo to Oakland (1)
San Pablo Dam Road to San Francisco and Oakland (1)
San Pablo to Berkeley (1)
San Pablo to Oakland (2)
Requests for specific stops (12)
El Sobrante (3)
Kaiser Oakland (3)
Kensington neighborhood (1)
LaMorinda/Walnut Creek area (1)
Pinole Valley Road at I-80 (1)
Regatta at Marina Bay Parkway (1)
San Francisco Airport (1)
San Pablo Avenue and Victoria Crescent (1)
General comments (5)
Bike racks on buses (1)
Bus only lanes (1)
Disabled access (2)
NextBus real-time arrival app (1)
Analysis of Round 2 Survey Results
The purpose of the Round 2 survey was to seek input on preferred express bus pick-up and drop-off locations and to understand the factors that would influence express bus ridership.
PlaceWorks collected 798 surveys between May 3, 2019 and July 22, 2019. PlaceWorks performed two sets of analysis: (1) data from all survey respondents, and (2) only responses from West Contra Costa County (i.e., residents from San Pablo, Richmond, Pinole, Hercules, and unincorporated communities).
West Contra Costa Commuters comprised 65 percent of all respondents. Since the majority of survey
Original PDF, page 82
September 3, 2019 | Page 7 respondents are from West Contra Costa County, the results did not change substantially between the two datasets and typically varied by only a few percentage points (1 to 5 percent). Accordingly, the following analysis only presents responses from the entire dataset.
The graphs below generally report the percent of the total responses and the total number of respondents by category shown as X % (X). COMMUTE ORIGIN AND DESTINATION (QUESTIONS 1 AND 2) Questions 1 and 2 asked where respondents live and the location of their place of employment/school.
Figure 3 below illustrates the majority of respondents live in West Contra Costa County cities, primarily Richmond, Hercules, El Sobrante, Pinole, and El Cerrito. Respondents also live in communities in central and eastern Contra Costa County, as well as various Alameda County cities, San Francisco, and Napa, Solano, and Marin Counties, which are represented under the “Other” category.
Figure 3 Question 1: Place of Residence (772 Respondents) 1% (10) 1% (11) 1% (11) 2% (14) 2% (14) 2% (16) 3% (22) 3% (23) 4% (34) 5% (36) 5% (42) 6% (46) 6% (46) 7% (56) 23% (174) 28% (217) 0% 5% 10% 15% 20% 25% 30% Crockett Antioch Pittsburg San Francisco Rodeo Walnut Creek City in Alameda County Oakland Berkeley Other El Cerrito El Sobrante Pinole City in Contra Costa County Hercules Richmond
Original PDF, page 83
| 15% | ||||||||
|---|---|---|---|---|---|---|---|---|
| 4% (24) 7% 8 | % (46) |
September 3, 2019 | Page 8 Figure 4 reports the proportion of West Contra Costa County survey respondents compared to the 2019 West Contra Costa County population. The Round 2 survey was generally successful in securing survey responses in similar proportion to the 2019 West Contra Costa County population distribution for El Cerrito, Pinole, and Richmond. However, the Round 2 survey received more responses from residents of Hercules (32 percent) compared to the proportion of the 2019 Hercules population in West Contra Costa County (10 percent), in part due to complementary outreach by the City of Hercules. There were no survey respondents from San Pablo whose residents comprised 12 percent of the 2019 West Contra Costa County population.
Figure 4 Proportion of West Contra County Respondents Compared to 2019 West Contra Costa County Population Source: Data source for 2019 West Contra Costa County population is the California Department of Finance.
0% 40% (217) 42% 0% 5% 10% 15% 20% 25% 30% 35% 40% 45% San Pablo Richmond Pinole Other WCCC Unicoporated City Hercules El Sobrante El Cerrito Percent of 2019 West Contra Costa County Population Percent of West Contra Costa Survey Respondents
Original PDF, page 84
September 3, 2019 | Page 9 Figure 5 illustrates the majority of respondents (79 percent) work in Berkeley, Oakland, San Francisco, and Emeryville.
Figure 5 Question 2: Place of Employment (775 Respondents) 1% (5) 1% (6) 1% (8) 1% (10) 2% (18) 4% (28) 5% (35) 7% (53) 12% (92) 13% (103) 27% (207) 27% (210) 0% 5% 10% 15% 20% 25% 30% Walnut Creek San Pablo Pinole El Cerrito Cities in contra Costa County Hercules Other Richmond Emeryville San Francisco Oakland Berkeley
Original PDF, page 85
| tween | 4:00 PM | ||||||||
|---|---|---|---|---|---|---|---|---|---|
| work or | school |
September 3, 2019 | Page 10 COMMUTE ARRIVAL AND DEPARTURE TIMES (QUESTIONS 3 AND 4) Questions 3 and 4 asked what time respondents arrive and leave work or school. Figure 6 shows that the largest cohort of respondents (46 percent) arrive to work or school between 8:00 AM and 9:00 AM, with roughly 34 percent arriving between 6:00 AM and 8:00 AM and 13 percent arriving between 9:00 AM and 10:00 AM.
Figure 6 Question 3: Commute Arrival Time (770 Respondents) Question 4 asked respondents what time they leave work or school. Figure 6 shows that 36 percent of respondents leave work or school between 5:00 PM and 6:00 PM. Approximately 28 percent of respondents leave between 4:00 PM and 5:00 PM, 14 percent leave between 6:00 PM and 7:00 PM, and 10 percent leave work or school between 3:00 PM and 4:00 PM.
0% (3) 0% (1) 0% (3) 1% (4) 0% (1) 0% (1) 1% (6) 2% (13) 46% (358) 2% (13) 1% (4) 0% 5% 10% 15% 20% 25% 30% 35% 40% 45% 50% After 6:00 PM 5:00 PM to 6:00 PM 4:00 PM to 5:00 PM 2:00 PM to 3:00 PM 1:00 PM to 2:00 PM 12:00 PM to 1:00 PM 11:00 AM to 12:00 PM 10:00 AM to 11:00 AM 9:00 AM to 10:00 AM 8:00 AM to 9:00 AM 7:00 AM to 8:00 AM 6:00 AM to 7:00 AM 5:00 AM to 6:00 AM 4:00 AM to 5:00 AM
Original PDF, page 86
September 3, 2019 | Page 11 Figure 7 shows that the largest cohort of respondents (36 percent) depart work or school between 5:00 PM and 6:00 PM, with roughly 38 percent departing between 3:00 PM and 5:00 PM and 14 percent departing between 6:00 PM and 7:00 PM.
Figure 7 Question 4: Commute Departure Time (687 Respondents) COMMUTE MODE (QUESTION 5) Question 5 asked respondents to report their primary mode(s) of transportation to work or school.
Respondents had the option of choosing all commute mode choices that applied including:
Drive alone
BART
Local bus
Express bus
Carpool
Walk
Other
Lyft/Uber
Bike/scooter 2% (13) 5% (35) 14% (93) 36% (248) 28% (195) 10% (70) 3% (20) 1% (7) 0% (0) 1% (6) 0% 5% 10% 15% 20% 25% 30% 35% 40% After 8:00 PM 7:00 - 8:00 PM 6:00 - 7:00 PM 5:00 - 6:00 PM 4:00 - 5:00 PM 3:00 - 4:00 PM 2:00 - 3:00 PM 1:00 - 2:00 PM 12:00 - 1:00 PM Before 12:00 PM
Original PDF, page 87
| 67% ( | ||||||
|---|---|---|---|---|---|---|
| 3 | 7% (291) | |||||
| 16% 12% (97 12% (92) 11% (82) 9% (72) 45) 45) | (123) ) | |||||
| 6% ( 6% ( |
September 3, 2019 | Page 12 A total of 777 respondents answered this question, the results represented on Figure 8. Approximately 44 percent of respondents reported driving alone and another 23 percent reported driving alone in combination with some other mode of transportation.
Of the 37 percent of respondents who commute by BART, a little less than half also reported they drive for a portion of their commute. Approximately 16 percent of respondents indicated they commute using a local bus, with 12 percent using an existing express bus. Furthermore, 12 percent commute by carpool, 11 percent commute by walking, 6 percent by bike or scooter, 6 percent by Lyft or Uber, and 9 percent indicated “Other.”1 Respondents who chose “Other” identified commute modes such as riding the ferry, employer- provided shuttles, university- provided shuttles, WestCAT Lynx bus routes, paratransit, and Amtrak.
Figure 8 Question 5: Commute Mode (777 Respondents) Note: Because respondents could check any commute mode options that applied, the number of responses summarized after the percentage totals 1,364.
1 Since this was a “check all that apply” question, the total number of responses for each category was divided by the total number of respondents who answered Question 5 (i.e., 777 respondents) to come up with the percent of total.
Given this methodology, the percentages do not add up to 100%. 67% (517) Bike/scooter Lyft/Uber Other (please specify) Walk Carpool Express bus Local bus BART Drive alone 0% 10% 20% 30% 40% 50% 60% 70%
Original PDF, page 88
September 3, 2019 | Page 13 EXPRESS BUS AMENITIES (QUESTION 6) Question 6 asked respondents what amenities would influence their decision to ride an express bus.
Respondents could choose one or more options from a list of seven amenities. As shown on Figure 9, respondents favored real-time arrival information (76 percent), discounted or subsidized fares (64 percent), and vehicle parking (64 percent).2 Figure 9 Question 6: Preferred Express Bus Amenities (756 Respondents) Note: Because respondents could check all preferred express bus amenities that applied, the number of responses summarized after the percentage totals 2,042.
Approximately 14 percent of respondents chose the “other” option and noted the following factors that would influence them to ride the express bus:
Frequency of bus trips
Coffee vendors on-site
Connections to BART stations
Space for bike racks on the express bus
Reliable arrival times
Free parking
Safe parking
Security at express bus stops 2 Since this was a “check all that apply” question, the total number of responses for each category are divided by the total number of respondents who answered Question 6(i.e., 756 respondents) to come up with the percent of total.
Given this methodology, the percentages do not add up to 100%. 5% (41) 14% (105) 14% (105) 33% (251) 64% (483) 64% (483) 76% (574) 0% 10% 20% 30% 40% 50% 60% 70% 80% Bike/scooter-share Bike parking Other (please specify) Bus shelters and benches Vehicle parking Discounted or subsidized fares Real-time arrival information
Original PDF, page 89
| 12% | (82) 1 75) | 9% (126) 21% (13 | ||
|---|---|---|---|---|
| 8% % (27) 9 | 9% (61) (50) % (56) 11% ( | |||
| 1% (8) 4 | ||||
| 6% (37) |
September 3, 2019 | Page 14
Limited number of stops
Connection to Lynx
Uber subsidy
Disabled-persons accessibility
WiFi EXPRESS BUS ORIGIN STOPS (QUESTIONS 7 AND 8) A total of 657 respondents identified their preferred express bus pick-up location. Of the provided options, the Existing Hercules Transit Center, Future Hercules Intermodal Transit Center, and Potential Park & Ride near Harbour Way and I-580 were the top three choices at 19 percent, 12 percent, and 11 percent of the total responses, respectively (Figure 10). In addition, 65 percent of the respondents chose an express bus origin stop that provided parking, which appears to confirm that the availability of parking is a key consideration for potential riders. Approximately 21 percent (135 respondents) of the respondents indicated that none of the express bus stop origins would work for them. Of the 135 respondents who chose “none of the above,” 60 percent (80 respondents) reported living in cities south of Richmond, which indicates that they would have to back-commute to board at an express bus origin stop. Respondents also suggested alternate bus origin stops, which are described below.
Figure 10 Question 7: Preferred Express Bus Origin Stop (657 Respondents) Respondents had the option of suggesting other bus stop origin locations in Question 8. Of the 350 responses, 252 responses listed locations in West Contra Costa County (organized east-to-west):
None of the above I: Potential Park & Ride at I-80 & MacDonald Ave H: Potential Park & Ride near Harbour Way & I-580 G: Potential Park & Ride at I-80 & San Pablo Dam Road F: Along 23rd Ave/MacDonald Ave (stops every 1/2 mile) E: Along Rumrill Blvd (stops every 1/2 mile) D: Richmond Parkway Transit Center Park & Ride C: Along San Pablo Ave (stops every 1/2 mile) B: Existing Hercules Transit Center A: Site of the Future Hercules Intermodal Transit Center 0% 5% 10% 15% 20% 25%
Original PDF, page 90
September 3, 2019 | Page 15
Crockett (8 of 350 total responses). Most respondents stated any location in Crockett would work.
Rodeo (11 of 350 total responses). Most respondents requested the Willow Avenue Park and Ride be considered as a potential origin stop.
Hercules (63 of 350 total responses). Common locations included:
Along Refugio Valley Road
At San Pablo Avenue and Hercules Avenue
At San Pablo Avenue and Sycamore Avenue
Victoria by the Bay, particularly along Victoria Crescent Way
Pinole (24 of 350 total responses). Common locations included:
At Appian Way and San Pablo Avenue
At Appian Way and Tara Hills Drive
Along Pinole Valley Road near I-80
El Sobrante (13 of 350 total responses). Most respondents requested stops along San Pablo Dam Road.
Richmond (88 of 350 total responses). Common locations included:
Along Carlson Avenue
Hilltop Mall
Marina Bay (primarily at Regatta Boulevard and Marina Bay Parkway)
Point Richmond
Along San Pablo Avenue
San Pablo (12 of 350 total responses). Common locations included:
Along San Pablo Avenue
I-80 at El Portal Drive
El Cerrito (32 of 350 total responses). Common locations included:
El Cerrito Del Norte BART Station
El Cerrito Plaza BART Station
Arlington Avenue at Barrett Avenue
Moeser Lane at San Pablo Avenue
Kensington (1 of 350 total responses). The respondent requested a stop along Arlington Avenue at Oberlin Avenue. PlaceWorks analyzed the suggested stops from residents of Richmond and Hercules, the two cities with the most respondents. When looking at the 112 suggested stops from Richmond residents, top responses included:
4 suggestions for Hilltop Mall
4 suggestions for along Carlson Avenue
6 suggestions for the two El Cerrito BART stations
Original PDF, page 91
September 3, 2019 | Page 16
23 suggestions for along San Pablo Avenue
27 suggestions for Marina Bay (primarily at Regatta Boulevard and Marina Bay Parkway) When looking at the 72 suggestions from Hercules residents to Question 8, top responses included:
5 suggestions for Refugio Valley Road
6 suggestions for San Pablo Avenue and Sycamore Avenue
7 suggestions for the existing Hercules Transit Center
10 suggestions for San Pablo Avenue and Hercules Avenue
16 suggestions for Victoria by the Bay Respondents also suggested origin stops in the following cities:
Albany
Antioch
Berkeley
Brentwood
Castro Valley
Concord
Emeryville
Martinez
Moraga
Oakland
Orinda
Pittsburg
Pleasant Hill
San Francisco
San Ramon
Vallejo
Walnut Creek EXPRESS BUS DESTINATION STOPS (QUESTIONS 9 – 13) Question 9 asked respondents to identify the destination of their daily commute (Figure 11). Of the 670 respondents who answered this question, the top two destinations were Berkeley and Oakland at 30 percent each. PlaceWorks worked with Oakland Kaiser Medical Center, UC Berkeley Parking and Transportation Department, and LBNL to distribute the survey link to employees and students, which could have affected the frequency of responses for Berkeley and Oakland.
Original PDF, page 92
| 30% (202) 30% (201) | ||||||||||
|---|---|---|---|---|---|---|---|---|---|---|
| 14% (92) | 16% (105) | |||||||||
| 10% (70) |
September 3, 2019 | Page 17 Figure 11 Question 9: Express Bus City Destination (670 Respondents) Approximately 10 percent of the respondents identified a commute destination other than Berkeley, Emeryville, Oakland, or San Francisco:
Alameda (2)
Albany (1)
Concord (1)
Corte Madera (1)
El Cerrito (8)
Fairfield (1)
Foster City (1)
Hercules (2)
Marin (1)
Martinez (1)
Menlo Park (1)
Mill Valley (1)
Novato (1)
Piedmont (1)
Pinole (3)
Pittsburgh (1)
Pleasanton (2)
Richmond (17) Berkeley Emeryville Oakland San Francisco Other (please specify) 0% 5% 10% 15% 20% 25% 30% 35%
Original PDF, page 93
September 3, 2019 | Page 18
Rodeo (1)
San Jose (2)
San Pablo (2)
San Pablo
San Rafael (3)
San Ramon (1)
South San Francisco (1)
Walnut Creek (1)
| 2% (3) 1% (1) 1% (1) 3% ( 4% ( | 6) 7) | 76% ( | |||||
|---|---|---|---|---|---|---|---|
| 5% 2% (4 8 | (10) ) % (16) |
September 3, 2019 | Page 19 Berkeley If respondents chose Berkeley as their commute destination, they were forwarded to Question 10, which presented a list of potential Berkeley express bus stop locations. Of the 199 respondents who identified Berkeley as their commute destination, 76 percent chose the Downtown Berkeley BART station as their preferred express bus destination stop (Figure 12). Again, the popularity of the Downtown Berkeley BART stop may have been influenced by outreach undertaken by UC Berkeley and LBNL to employees and students. Of the eight percent of respondents who chose “Other,” common suggested destination stops included UC Berkeley and along Ashby Avenue (five respondents suggested Ashby at 6th Avenue, 7th Avenue, or San Pablo Avenue, and one respondent suggested Ashby Avenue at Telegraph Avenue).
Figure 12 Question 10: Berkeley Express Bus Stop Location Responses (199 Respondents) Other (please specify) H: Shattuck Ave/Dwight Wy G: Shattuck Ave/Durant Ave F: Downtown Berkeley BART E: University Ave/MLK Jr Way D: University Ave/San Pablo Ave C: University Ave/6th St B: Virginia St/6th A: Gilman St/6th St 0% 10% 20% 30% 40% 50% 60% 70% 80%
Original PDF, page 95
| 12% ( | 11) | 30% (28) 29% (27) | ||||
|---|---|---|---|---|---|---|
| 18% | (17) | |||||
| 2% (2) | 8% | (7) |
September 3, 2019 | Page 20 Emeryville If respondents chose Emeryville as their commute destination, they were forwarded to Question 11, which presented a list of potential Emeryville express bus stop locations. Of the 92 respondents who identified Emeryville as their commute destination, the majority chose express bus stops along Hollis Street (Figure 13). Respondents who chose “Other” suggested adding a stop near The Towers and/or Powell Street at I-80 or along Hollis Street at 45th Street or 64th Street.
Figure 13 Question 11: Emeryville Express Bus Stop Location Responses (92 Respondents) Other (please specify) E: 40th St/San Pablo Ave D: 40th St/Hollis St C: 53rd St/Hollis St B: 59th St/Hollis St A: 65th St/Hollis St 0% 5% 10% 15% 20% 25% 30% 35%
Original PDF, page 96
| 14% | (28) | 59% (115) | ||||
|---|---|---|---|---|---|---|
| 10% (19) 11% (22) | ||||||
| 2% (3) 2% (3) 3% (6) |
September 3, 2019 | Page 21 Oakland If respondents chose Oakland as their commute destination, they were forwarded to Question 12, which presented a list of potential Oakland express bus stop locations. Of the 196 respondents who chose Oakland as their commute destination, the majority (59 percent) chose MacArthur Boulevard/Broadway as the preferred express bus stop location (Figure 14). Again, the popularity of this location is likely related to outreach undertaken by Kaiser Oakland which is located at the intersection of MacArthur Boulevard and Broadway. Of the six respondents who chose “Other,” four identified stops close to Oakland Kaiser. Other suggested stops included the Oakland Coliseum/San Leandro BART, and MacArthur Boulevard at Sheffield Avenue.
Figure 14 Question 12: Oakland Express Bus Stop Location Responses (196 Respondents) Other (please specify) F: Jack London Square E: 8th St/Broadway D: 12th St BART C: 19th St BART B: MacArthur Blvd/Broadway A: MacArthur BART 0% 10% 20% 30% 40% 50% 60% 70%
Original PDF, page 97
September 3, 2019 | Page 22 San Francisco If respondents chose San Francisco as their commute destination, they were forwarded to Question 13, which asked if an express bus stop at the Transbay Terminal would work for their commute. As shown in Figure 15, 90 percent of respondents (of 105 total responses) indicated the Transbay Terminal would be a feasible express bus stop. Respondents who said “no,” indicated the Transbay Terminal is too far from the Civic Center, Mission District, and other parts of the city and that transit connections to these areas would take too long from the Transbay Terminal.
Figure 15 Question 13: Would the Transbay Terminal Express Bus Stop Work for You? (105 Respondents) 90% (94) 10% (11) Yes No
Original PDF, page 98
September 3, 2019 | Page 23 RESPONDENT DEMOGRAPHICS (QUESTIONS 14 – 16) The Round 2 Survey also collected voluntary demographic data from survey respondents to gauge whether the outreach campaign was reaching a wide range of demographics.
Question 14 asked survey respondents to identify their age group which was answered by a total of 636 respondents. As shown in Figure 16, the age of survey respondents covered a range of age groups. The highest cohort of respondents, approximately 28 percent, were between the ages of 30-39 years.
Respondents age 60 and over account for 11 percent of the total responses, which is likely related to the survey targeting working adults. More than 85 percent of respondents were between 20 and 59 years old.
Figure 16 Question 14: Age of Survey Respondents (636 Respondents) 2% (12) 11% (73) 23% (147) 22% (140) 28% (177) 13% (83) 1% (4) 0% 5% 10% 15% 20% 25% 30% 70-79 years old 60-69 years old 50-59 years old 40-49 years old 30-39 years old 20-29 years old 0-19 years old
Original PDF, page 99
| 11% | 14% (69) | ||||||
|---|---|---|---|---|---|---|---|
| 3% (82) | 24% | ||||||
| 3 | % (16) 5% (28) 4% 8% |
September 3, 2019 | Page 24 Figure 17 shows the race/ethnicity of the 613 respondents who identified their race, in comparison to the 2017 race/ethnicity breakdown of West Contra Costa County as reported by the American Community Survey.3 The reported race/ethnicity of survey respondents as follows: 36 percent White, 24 percent Asian, 11 percent Black or African American, and 13 percent Hispanic or Latino. The remaining 16 percent included people that identified as other races/ethnicities, a combination of races/ethnicities, American Indian and Alaska Native, or Native Hawaiian and other Pacific Islander.
Figure 17 Question 15: Race/Ethnicity of Survey Respondents Compared to 2017 West Contra Costa County Population (613 Respondents) Source: Data source for West Contra Costa County demographics is the 2017 American Community Survey.
https://censusreporter.org/profiles/06000US0601393620-west-contra-costa-ccd-contra-costa-county-ca/, accessed on August 27, 2019. 36% (223) 0% (3) 36% 0% 5% 10% 15% 20% 25% 30% 35% 40% White Two or More of the above Races/Ethnicities Other Race/Ethnicity Native Hawaiian and Other Pacific Islander Hispanic or Latino Black or African American Asian American Indian and Alaska Native 2017 West Contra Costa County Residents Survey Respondents
Original PDF, page 100
| 4) | 30% | |||||||
|---|---|---|---|---|---|---|---|---|
| 25% | ||||||||
| 8% |
September 3, 2019 | Page 25 As shown in Figure 18, the largest cohort of respondents (43 percent of the 585 respondents who reported their income) identified a household income of $100,000 to $200,000. The Area Median Income for Contra Costa County is $104,400, as established through the US Department of Housing and Urban Development (HUD) and the 2019 federal poverty line for a family of four is $25,750.4 Figure 18 Question 16: Household Income of Survey Respondents (585 Respondents) Source: Data source for West Contra Costa County demographics is the 2017 American Community Survey.
Conclusions
Express Bus Routes Although the survey did not directly ask about express bus routes, participants generally commented that there should be limited express bus stops along the routes, the express bus service should be faster than driving alone, and there should be connections to and from BART.
Express Bus Origin Stops Overall, survey respondents preferred express bus origin stops that provide parking. Of the origin stop options provided, 32 percent of survey respondents preferred stops in Hercules. Richmond was also a 4 https://www.huduser.gov/portal/datasets/il.html, accessed January 9, 2019.
43% (249) 0% 5% 10% 15% 20% 25% 30% 35% 40% 45% Over $200,000 $100,000 to $200,000 $50,000 to $100,000 Under $50,000 2017 West Contra Costa County Residents Survey Respondents
Original PDF, page 101
September 3, 2019 | Page 26 popular origin stop location with 31 percent of respondents favoring stops in Richmond (with 88 respondents suggesting alternate origin stops in Richmond, particularly in Marina Bay).
Express Bus Destination Stops Stops in Downtown Berkeley, at MacArthur and Broadway in Oakland, along Hollis Street in Emeryville, and the San Francisco Transbay Terminal were the most frequently chosen destinations. Outreach efforts by Kaiser Permanente, UC Berkeley, and LBNL may have boosted results for Berkeley and Oakland destinations.
Destination stops near employment areas that provide all-day parking could prove challenging to entice drivers to switch to express bus service.
Express Bus Amenities Real-time arrival information, vehicle parking, and subsidized fares scored highest in potentially attracting express bus riders, though bike racks and bus shelters could also be helpful in promoting ridership.
Original PDF, page 102
September 3, 2019 | Page 27
Appendix A
List of organizations contacted for press releases or newsletter outreach. Press Release Recipients Richmond Neighborhood Councils The Advocate Atchison Village Neighborhood Council Bay Citizen Belding Woods Neighborhood Council Bay City News Castro Heights Neighborhood Council Berkeleyside Coronado Neighborhood Council Contra Costa Herald Crescent Park Apartments Res. Council Contra Costa Marketplace Magazine Eastshore Neighborhood Council East Bay Times El Sobrante Municipal Advisory Council El Cerrito Patch Fairmede Hilltop Neighborhood Council E'ville Eye Community News Greenbriar Neighborhood Council Pinole-Hercules Patch Hilltop District Neighborhood Council Richmond Post News Group Iron Triangle Neighborhood Council Richmond Confidential Laurel Park Neighborhood Council Richmond Standard Marina Bay Neighborhood Council Richmond Pulse May Valley Neighborhood Council Univision North & East Neighborhood Council Panhandle Annex Neighborhood Council Parchester Village Neighborhood Council Newsletter Recipients Park Plaza Neighborhood Council City of San Pablo Social Media Point Richmond Neighborhood Council City of Pinole City Manager's E-Newsletter Pullman Neighborhood Council City of Hercules City Manager's E-Newsletter Quail Hill Neighborhood Council City of Richmond City Manager's E-Newsletter Richmond Annex Neighborhood Council Richmond Chamber of Commerce Richmond Heights Neighborhood Council City of El Cerrito City Manager's E-Newsletter Richmore Village/Metro Square Neighborhood Council Santa Fe Neighborhood Council Shields-Reid Neighborhood Council SW Richmond Annex Neighborhood Council Note: Bold indicates organizations and jurisdictions that published a news article about the project and the article was confirmed. All have been contacted at least once.
Original PDF, page 103
September 3, 2019 | Page 28
Appendix B
Appendix B includes the 56 public comments submitted between February 22, 2019 and July 26, 2019. Eliminating lanes of traffic on an already congested major thruway along with elimination of street parking will make the congestion and parking so much worse.
what about the people coming from Highway 4 Brentwood, Antioch, Pittsburg way Idea should be expanded to include Martinez, Bay Point, Pittsburgh, and Antioch.
WE NEED IT ASAP I think this is an option worth exploring especially when there are problems with BART. An express bus to Oak Med Center would be fabulous. I live in Kensington and could use the service along Arlington Ave, Colusa, or San Pablo streets. Thank you for asking!
I don't live or work in West Contra Costa, but it would be great if an express bus connected the Kaiser Pinole medical office building, the Kaiser Richmond medical center, and the Kaiser Oakland medical center, as many Kaiser employees travel between those locations routinely. Thank you!
Having a stop in Marina Bay in Richmond at Regatta and Marina Bay Pkwy would be walkable for a lot of people living in the bedroom community. No parking needed.
How about an express bus from Del Norte BART to down town Pinole maybe stopping near Sprouts (for East Pinole) and then to Hercules? Please have express bus from Marina Lakes Drive to SFO international airport I love the Lynx from Hercules to SF. Would love to see it expanded to Berkeley, Emeryville, Oakland and even Walnut Creek. I am retired and not a fan of driving to these places, although I do so. I’m sure there are many who would find this a life changing convenience.
Would love to have a bus that goes to Emeryville. My office is just there and there are a lot of other businesses and hotels in the area that would greatly benefit with this, expansion. There can be a stop just after exiting Powell St where the hotel is or at 1900 powell where the emerygoround usually drops off people. Commute time from Hercules to Emeryville takes me 45mins to an hour on commute times as i dont have use the carpool. If this express bus will happen, i would definitely take it instead of driving.
I would like WCC to explore the possibility of routes to Marin County. Need a route to Oakland, preferably MacArthur bart station or Kaiser. As the transportation manager for UC Berkeley, I feel that many of our employees, students, and staff can take advantage of an easy transit option from the hilltop, Pinole. And Hercules areas to the immediate Berkeley area. While I understand that the primary option is in West Berkeley, there could be an advantage to connect with our folks here. Please contact Dave Sorrell (d.sorrell@Berkeley.edu) if you guys feel that UCB can be a potential partner (we are interested in outreach opportunities). Thanks!
The idea is very good to extend your express experience for the area around El Sobrante. However, it would really help to put a stop of two on San Pablo Dam road with access to Orinda BART, as was the case for many years, and to San Francisco. If you want cars to get off the road, replace them with viable stops on San Pablo Dam Road. There are over 40,000 cars a day that run up and down San Pablo Dam Road. You could alleviate a lot of the traffic with a express bus line to San Francisco, which would reduce the San Pablo Dam Road traffic load. San Pablo Dam Road is a main Highway
Original PDF, page 104
September 3, 2019 | Page 29 from 580, and Orinda, to 80 and access to San Francisco. If you had a bus line going down San Pablo Dam Road to San Francisco, or a bus running up and down San Pablo Dam Road to Orinda BART, a lot of congestion could be alleviated. Thank you.
El Cerrito Plaza to The Towers Emeryville would be truly fantastic! Would love to see a stop near Pinole Valley Road and the Dwight D. Eisenhower freeway crossing! It would be fairly easy to exit the free-way, pick up at Sprouts or Kaiser and get right back on the freeway.
Greetings, There are no stops indicated on the map for El Sobrante. San Pablo Dam Road is heavily traveled and to have no stops in this town is counter intuitive. By having stops in El Sobrante, a heavily populated residential town, you can save people from traveling on Hwy 80 to either go to a Bart station or to travel to Oakland/San Francisco. Additionally, many drivers come from other areas but travel down San Pablo Dam Road to get to Interstate 80. Am surprised not to see a stop on San Pablo Dam Road in El Sobrante. San Pablo Avenue has numerous AC Transit buses already servicing the area.
An express bus service and bus only lanes are majorly welcomed improvements to transit service between west Contra Costa and Oakland/Berkeley/Emeryville. As a resident of West Oakland I look forward to the reduction in air pollution and asthma caused by car emissions. - Blake Hwy 80 is very congested and traffic incidents can delay buses. Consider express service to BART in El Cerrito. We really need to extend BART to Hercules Your survey is basically only for people commuting to work. Retired folks would also benefit from alternative modes of transportation. I would go to Oakland more frequently if there was an express bus from Hercules. The same is true of going to Berkeley. I travel to SF only by Lynx. Would love to see some Lynx service on the weekends.
I am retired, so I don't need the service to get to a job. Instead, I use it to reach entertainment venues in San Francisco several times a year, and that can be during the work week as well as on weekends. I realize I am not your target customer for express bus service, but I would love to have service to San Francisco, Berkeley, Oakland, and Emeryville on weekends. Maybe, soon, you'll be able to offer that, too.
Hello and Greetings, Express buses are urgently needed in El Sobrante. In order for me to get to Del Norte (El Cerrito) Bart station, I must take the #74, then take the 72R, then finally arrive at Bart.
In other words, it takes me about one hour and 30 minutes to get from my house in El Sobrante (on San Pablo Dam Road and Clark Street) to Del Norte Bart. It is unclear where the proposed stop will be in El Sobrante. The map is very general and vague. I wanted to let you know there needs to be at least one stop on San pablo Dam Road, before the Casino, preferably on Clark, or May Road or even Castro Ranch as there are many commuters in these areas that need to go to Bart or San Francisco. Can you please provide a more clearer location of where the proposed bus stop will be in El Sobrante? Thanks again.
It would be wonderful if there was express bus service between Pinole and downtown S.F. It takes much too long to take Westcat to BART and then BART to S.F.
Please implement NextBus (real-time bus arrivals). If a bus is late it would be helpful to know ahead of time. Many of us have 2 hour commutes in the morning because the bus is late.
A bus to downtown berkeley would be so wonderful!!!
Original PDF, page 105
September 3, 2019 | Page 30 I would like to take an Express Bus from Point Richmond on Canal & West Cutting Blvd to Emeryville and Jack London Square. Alternatively, from the WETA Richmond Ferry Terminal to Emeryville and Downtown Oakland.
Why is this the question? Why are you ONLY concerned about connecting West Contra Costa County to points further West? For those of us who live in the Pinole/Hercules area, and work in Contra Costa County, we need viable commute options from Hercules to the BART station in Martinez. We shouldn't have to take bus to El Cerrito or Richmond, take BART to MacArthur in Oakland, THEN get a Contra Costa bound BART train. It makes the commute two hours long by public transportation, when a simple solution would be for an express bus to go from Hercules to the Martinez BART, so we could get to where we need to go in Contra Costa more directly.
I work in Albany but live in San Pablo along Tara Hills, is there any way there can be express buses to this area? Right now the JL/JR stops along San Pablo to El Cerrito Del Norte, but that would take longer to make the change to a 72 to get to Albany Because BART does not come close to Emeryville train station, it is hard to get there. A great express bus route would be from El Cerrito Plaza BART, to Emeryville train station. That would pick up the traffic along over-crowded San Pablo Rd., the parallel artery that is clogged because I-80 is so jammed.
Our office from SF is relocating to Oakland this summer. An express bus from Hercules to Oakland would benefit a lot of employees like me who will be facing the struggles of everyday traffic of "bus then transferring to Bart" commute. Most especially it will benefit our family if we can leave and back to our house at the perfect time.
I think it is a very good idea that WCCTAC is exploring the idea of starting express bus service from West Contra Costa to East Bay cities of Emeryville, Berkeley and Oakland. Currently, there is no direct bus or BART service to east bay and there is so much traffic on I-80 and so many accidents it is hard to predict how long it would take to drive 15 to 20 miles. Also, parking has become very expensive. Better late than never. Thank to WCCTAC.
I AM INTERESTED IN A WCC Express Bus to Oakland and West Berkeley. What about a later LYNX bus for when SF Giants game are playing. Thank you Rodney rcalindas@yahoo.com Hi Everyone, This comment is about connecting Hercules to Martinez. I commute by bicycle to/from these 2 cities during the week when the weather allows. Is it possible to create a bike lane or trail parallel to Hwy 4 from Cumming Skyway to Sycamore Ave at Claey's Ranch? It'll save bike commuters about 4 miles of hills. Thank you Would be great to have from Hercules, Pinole, San Pablo area to decrease congestion on Highway 80 To Oakland!
A bus directly to downtown Oakland - 11th & Broadway would be GREAT!!! Instead of expanding ACT bus service, you should be IMPROVING existing services for seniors!
There should be an alternative to the existing noisy/bumpy/disturbing vans with sometimes- disturbed-individuals, so that senior citizens can get to and from their doctor appointments safely with a minimum of stress. The current situation is woefully lacking and needs upgrading. Bring back the sedan rides for elderly instead of these disruptive van-buses!
So much needed especially for the disabled or people who don't have a vehicle, cannot drive or are afraid to drive themselves. Thank you.
Original PDF, page 106
September 3, 2019 | Page 31
Appendix C
List of organizations contacted for employer focus groups. Oakland Gilman Area Businesses Kaiser Permanente
Dollar Tree1 Jack London Improvement District
REI*1
Chipotle Emeryville
Walgreens1 Novartis*
La Calle 101 Pixar*
Philz1 Wareham Development, Emerystation Campus
Berkeley Burgers1 Emerytech Office
Whole Foods1 Emeryville Chamber of Commerce (300 employers)
North Face Outlet1 Bay Street and Powel Street Plaza
City of Berkeley Transfer Station and Recycling Center1
Ikea1
Picante1
Trader Joe’s1
Gilman Brewery1
Apple1
Starbuck at Powell Street Plaza1
Fieldworks Brewery1
Starbucks at Hollis Street and 65th Street1
H&M1 Fourth Street Shopping Area
Gap1
Artis Coffee1
Los Moles1
Amazon 4-Star1
Uniqlo1
Peets Coffee1
Old Navy1
Sur La Table1
Ross1
Apple1
Banana Republic1
Lulumon1
American Eagle1
Sierra Nevada Tasting Room1
Barns and Noble1
Takara Sake1
Bay Street Management Office1
Anthropologie1
Vivarium1 John Muir Health
Zut! 1 Berkeley Bowl West1
Truitt & White Hardware1 Berkeley IronWorks1
Market Hall Foods1 Note: Bold indicates companies that emailed out information to their employees or constituents. Asterisk (*) indicates that a focus group was held at the employer’s office.
1 PlaceWorks canvassed in-person flyers and information to store managers.
Original PDF, page 107
® ®
WEST CONTRA COSTA COUNTY
EXPRESS BUS IMPLEMENTATION PLAN D.
PROPOSED STOP
AND INTERSECTION
IMPROVEMENTS
Final Plan | February 2020
San Pablo Ave/Shamrock Dr San Pablo Ave/Del Monte Dr San Pablo Ave/Pinole Shores Dr San Pablo Ave/Tara Hills Dr Richmond Pkwy/Bella Vista Apartments Stop #16 SB Stop #14 SB Stop #12 SB Stop #10 SB Stop #18 SB Stop #9 NB Stop #15 NB Stop #11 NB Stop #13 NB Stop #17 NB Hercules Transit Center Richmond Pkwy Transit Center Proposed Tara Hills Dr Mobility Hub (Option 2) Proposed Tara Hills Dr Mobility Hub (Option 1) Planned Hercules Regional Intermodal Transit Center San Pablo Ave Pinole Valley Rd Hilltop Dr Richmond Pkwy Atlas Rd Blume Dr Appian Way Shawn Dr Refugio Valley Rd Fitzgerald Dr Sycamore Ave Redwood Rd Shamrock Dr Manor Rd Valley View Rd Tara Hills Dr §¨¦ ¬«
Pinole
Hercules
Richmond
San Pablo
San Pablo Bay Hercules Ave Tsushima St Del Monte Dr Willow Ave San Pablo Ave Sunnyview Dr Pinole Shores Dr 0.5 0.25 Miles
Legend
Proposed Northbound Stops (Odd #) Proposed Southbound Stops (Even #) Transit Centers and Mobility Hubs I-80 Alignment San Pablo Ave/Richmond Pkwy Alignment % BART Stations BART Alignment CCJPA Alignment ±
Proposed Stop LocaƟons - Hercules/Pinole | Final Report
® ®
WEST CONTRA COSTA COUNTY
EXPRESS BUS IMPLEMENTATION PLAN
Original PDF, page 109
% % 23rd St/Dover Ave 23rd St/Rheem Ave 13th St/Rheem Ave 23rd St/Garvin Ave Rumrill Blvd/Rd 20 23rd St/Preble Ave Broadway/Rumrill Blvd Harbour Way/Maine Ave Macdonald Ave/37th St San Pablo Ave/Stone St Rumrill Blvd/Market Ave Harbour Way/Roosevelt Ave Harbour Way/Macdonald Ave Macdonald Ave/27th St/Broadway Stop #46 SB Stop #20 SB Stop #36 SB Stop #34 SB Stop #22 SB Stop #24 SB Stop #32 SB Stop #44 SB Stop #28 SB Stop #30 SB Stop #38 SB Stop #40 SB Stop #26 SB Stop #39 NB Stop #27 NB Stop #29 NB Stop #19 NB Stop #35 NB Stop #42 SB Stop #33 NB Stop #21 NB Stop #23 NB Stop #25 NB Stop #31 NB Stop #43 NB Stop #45 NB Stop #37 NB Stop #41 NB Contra Costa College Proposed San Pablo Dam Rd Mobility Hub Proposed Bissell Ave Mobility Hub Proposed Wright Ave Mobility Hub 23rd St Ohio Ave Richmond Pkwy Castro St 34th St 2nd St 3rd St Market Ave Garvin Ave 29th St 30th St Marina Way Rumrill Blvd El Portal Dr Roosevelt Ave Cutting Blvd 37th St McBryde Ave Carlson Blvd Barrett Ave San Pablo Ave Parr Blvd Center Ave Maricopa Ave Giant Rd Church Ln Arlington Blvd Chesley Ave Solano Ave 1st St Road 20 13th St Potrero Ave San Pablo Dam Rd Garrard Blvd Vale Rd Appian Way Brookside Dr Dimm St Barranca Ave Arlington Blvd Road 20 39th St Esmond Ave Wilson Ave §¨¦ §¨¦
Richmond
San Pablo
El Cerrito
Roosevelt Ave Rheem Ave Macdonald Ave Barrett Ave Maine Ave Dover Ave 0.5 0.25 Miles
Legend
Proposed Northbound Stops (Odd #) Proposed Southbound Stops (Even #) Transit Centers and Mobility Hubs 23rd St/Macdonald Ave Alignment I-80 Alignment Rumrill Blvd/Harbour Way Alignment % BART Stations BART Alignment CCJPA Alignment ±
Proposed Stop LocaƟons - Richmond | Final Report
South of Cutting Blvd route connects to I-80 via I-580 ® ®
WEST CONTRA COSTA COUNTY
EXPRESS BUS IMPLEMENTATION PLAN
Original PDF, page 110
% % Gilman St/Sixth St Sixth St/Virginia St University Ave/MLK Way Shattuck Ave/Center St Shattuck Ave/Dwight Way Shattuck Ave/Durant Ave University Ave/Sixth St University Ave/San Pablo Ave Stop #58 SB Stop #56 SB Stop #52 SB Stop #62 SB Stop #60 SB Stop #54 SB Stop #50 SB Stop #48 SB Stop #55 NB Stop #47 NB Stop #53 NB Stop #61 NB Stop #59 NB Stop #57 NB Stop #49 NB Stop #51 NB Cedar St 6th St Rose St Dwight Way University Ave San Pablo Ave Gilman St Virginia St 6th St Sacramento St Hopkins St 7th St Telegraph Ave Bancroft Way Durant Ave Dwight Way Shattuck Ave Martin Luther King Jr Way Monterey Ave Adeline St Spruce St Bancroft Way San Pablo Ave Shattuck Ave §¨¦
Berkeley
Universty of California Berkeley
Albany
0.25 0.5 0.125 Miles
Legend
Proposed Northbound Stops (Odd #) Proposed Southbound Stops (Even #) Berkeley Alignment I-80 Alignment CCJPA Alignment % BART Stations BART Alignment ±
Proposed Stop LocaƟons - Berkeley | Final Report
® ®
WEST CONTRA COSTA COUNTY
EXPRESS BUS IMPLEMENTATION PLAN
Original PDF, page 111
% % Hollis St/53rd St Hollis St/45th St Hollis St/59th St Hollis St/65th St 40th St/Hollis St 40th St/Adeline St Broadway/W MacArthur Blvd 40th St/MacArthur BART Access Rd Stop #76 SB Stop #74 SB Stop #72 SB Stop #78 SB Stop #88 SB Stop #84 SB Stop #82 SB Stop #80 SB Stop #75 NB Stop #73 NB Stop #83 NB Stop #81 NB Stop #79 NB Stop #71 NB Stop #77 NB Stop #87 NB Adeline St Market St Broadway Alcatraz Ave MacArthur Blvd 51st St Shattuck Ave College Ave Powell St Piedmont Ave Telegraph Ave 32nd St Martin Luther King Jr Way Mandela Pkwy Claremont Ave Chabot Rd Hollis St Ashby Ave 65th St Folger Ave 7th St Hollis St 59th St 53rd St 40th St Martin Luther King Jr. Way Telegraph Ave 40th St Grand Ave Peralta St Sacramento St 52nd St Broadway Ter Maritime St Frontage Rd 35th St 36th St Yerba Buena Ave Pleasant Valley Ave Grand Ave Stanford Ave San Pablo Ave §¨¦ §¨¦ §¨¦ §¨¦ §¨¦ ¬«
Oakland
Emeryville
Berkeley
0.25 0.5 0.125 Miles
Legend
Proposed Northbound Stops (Odd #) Proposed Southbound Stops (Even #) Emeryville/Oakland Alignment I-80 Alignment CCJPA Alignment % BART Stations BART Alignment ±
Proposed Stop LocaƟons - Emeryville/Oakland | Final Report
® ®
WEST CONTRA COSTA COUNTY
EXPRESS BUS IMPLEMENTATION PLAN
Original PDF, page 112
% % % Broadway/3rd St Broadway/7th St Broadway/20th St Broadway/13th St 2nd St/Washington St Stop #86 SB Stop #64 SB Stop #70 SB Stop #68 SB Stop #66 SB Stop #85 NB Stop #69 NB Stop #67 NB Stop #63 NB Stop #65 NB Broadway 14th St Harrison St Brush St Castro St 8th St Market St Webster St 5th St 2nd St 3rd St 4th St 7th St 13th St 14th St Adeline St Clay St Grand Ave 12th St Union St Embarcadero Telegraph Ave 1st Ave Lakeside Dr San Pablo Ave 7th St 20th St Mandela Pkwy Webster St Tube Oak St International Blvd Middle Harbor Rd Lakeshore Ave Foothill Blvd 18th St Fallon St 17th St 8th St 7th St 18th St §¨¦ §¨¦
Oakland
0.25 0.5 0.125 Miles
Legend
Proposed Northbound Stops (Odd #) Proposed Southbound Stops (Even #) Oakland Alignment CCJPA Alignment % BART Stations BART Alignment ±
Proposed Stop LocaƟons - Oakland | Final Report
Route connects to I-80 via Grand Ave ® ®
WEST CONTRA COSTA COUNTY
EXPRESS BUS IMPLEMENTATION PLAN
Original PDF, page 113
| Tier 1 Amenities Tier 2 Amenities StopID Project ID# Intersection Name Jurisdiction Direction Existing Stop Side Proposed Improvement ADA Landing Zone Shelter Bench Light Trash Receptacle System Map Bike Parking | |||||||||||||
|---|---|---|---|---|---|---|---|---|---|---|---|---|---|
| 9 BS1 San Pablo Ave/Crestview Dr Pinole NB Far Side - - X X X X X X | |||||||||||||
| 10 | BS1 | San Pablo Ave/Pinole Shores Dr | Pinole | SB | Near Side | - | - | X | X | X | X | X | X |
| 11 BS1 San Pablo Ave/Del Monte Dr Pinole NB Far Side - - X - X X X X | |||||||||||||
| 12 | BS1 | San Pablo Ave/Del Monte Dr | Pinole | SB | Near Side | - | - | X | X | X | X | X | X |
| 13 BS1 San Pablo Ave/Tara Hills Dr Unincorporated CC County NB Near Side - - X - X X X X | |||||||||||||
| 14 | BS1 | San Pablo Ave/Tara Hills Dr | Unincorporated CC County | SB | Far Side | - | - | X | - | X | X | X | X |
| 15 BS1 San Pablo Ave/Shamrock Dr Unincorporated CC County NB Near Side Relocate to Far Side X X X X X X X | |||||||||||||
| 16 | BS1 | San Pablo Ave/Shamrock Dr | Unincorporated CC County | SB | Far Side | - | - | - | - | X | X | X | X |
| 17 BS1 Richmond Pkwy/Bella Vista Apartments Richmond NB Far Side - - X X - X X X | |||||||||||||
| 18 | BS1 | Richmond Pkwy/Bella Vista Apartments | Richmond | SB | Far Side | - | - | X | - | X | X | X | X |
| 33 BS2 San Pablo Ave/Stone St San Pablo NB Midblock - - X X X X X X | |||||||||||||
| 34 | BS2 | San Pablo Ave/Stone St | San Pablo | SB | Midblock | - | - | - | - | X | - | - | X |
| 35 BS2 23rd St/Dover Ave San Pablo NB Near Side Relocate to Far Side - X X X X X X | |||||||||||||
| 36 | BS2 | 23rd St/Dover Ave | San Pablo | SB | Near Side | Relocate to Far Side | - | X | X | X | X | X | X |
| 37 BS2 23rd St/Rheem Ave Richmond NB Near Side - - X X X X X X | |||||||||||||
| 38 | BS2 | 23rd St/Rheem Ave | Richmond | SB | Near Side | - | - | X | X | X | X | X | X |
| 39 BS2 23rd St/Garvin Ave Richmond NB N/A New Stop - Far Side - X X X X X X | |||||||||||||
| 40 | BS2 | 23rd St/Garvin Ave | Richmond | SB | Near Side | - | - | X | - | X | X | X | X |
| 41 BS2 23rd St/Preble Ave Richmond NB Far Side - - X - X - X X | |||||||||||||
| 42 | BS2 | 22nd St/Nevin Ave | Richmond | SB | Far Side | - | - | X | X | X | X | X | X |
| 43 BS2 Macdonald Ave/27th St/Broadway Richmond NB Far Side - - X - X - X X | |||||||||||||
| 44 | BS2 | Macdonald Ave/27th St/Broadway | Richmond | SB | Far Side | - | - | X | - | X | - | X | X |
| 45 BS2 Macdonald Ave/37th St Richmond NB Far Side - - X X X - X X | |||||||||||||
| 46 | BS2 | Macdonald Ave/37th St | Richmond | SB | Near Side | Relocate to Far Side | - | X | X | X | X | X | X |
| 19 BS3 Broadway/Rumrill Blvd San Pablo NB N/A New Stop - Far Side X X X X X X X | |||||||||||||
| 20 | BS3 | Broadway/Rumrill Blvd | San Pablo | SB | N/A | New Stop - Far Side | X | X | X | X | X | X | X |
| 21 BS3 Rumrill Blvd/Rd 20 San Pablo NB Near Side - - X X X X X X | |||||||||||||
| 22 | BS3 | Rumrill Blvd/Rd 20 | San Pablo | SB | Far Side | - | - | X | X | X | X | X | X |
| 23 BS3 Rumrill Blvd/Market Ave San Pablo NB Far Side - - X X X X X X | |||||||||||||
| 24 | BS3 | Rumrill Blvd/Market Ave | San Pablo | SB | Far Side | - | - | X | X | X | X | X | X |
| 25 BS3 13th St/Rheem Ave Richmond NB Far Side - - X X X X X X | |||||||||||||
| 26 | BS3 | 13th St/Rheem Ave | Richmond | SB | Far Side | - | - | X | X | X | X | X | X |
| 27 BS3 Harbour Way/Roosevelt Ave Richmond NB Near Side Relocate to Far Side - X X X X X X | |||||||||||||
| 28 | BS3 | Harbour Way/Roosevelt Ave | Richmond | SB | Near Side | - | X | X | X | X | X | X | X |
| 29 BS3 Harbour Way/Macdonald Ave Richmond NB N/A New Stop - Far Side - X X X X X X | |||||||||||||
| 30 | BS3 | Harbour Way/Macdonald Ave | Richmond | SB | Far Side | - | - | X | X | X | X | X | X |
| 31 BS3 Harbour Way/Maine Ave Richmond NB N/A New Stop - Far Side - X X X X X X | |||||||||||||
| 32 | BS3 | Harbour Way/Maine Ave | Richmond | SB | Near Side | - | - | X | X | X | - | X | X |
Bus Stop LocaƟons - Proposed Amenity Improvements| Final Report
® ®
WEST CONTRA COSTA COUNTY
EXPRESS BUS IMPLEMENTATION PLAN
| Tier 1 Amenities Tier 2 Amenities StopID Project ID# Intersection Name Jurisdiction Direction Existing Stop Side Proposed Improvement ADA Landing Zone Shelter Bench Light Trash Receptacle System Map Bike Parking | |||||||||||||
|---|---|---|---|---|---|---|---|---|---|---|---|---|---|
| 47 BS4 Gilman St/Sixth St Berkeley NB Far Side - - X X X X X - | |||||||||||||
| 48 | BS4 | Gilman St/Sixth St | Berkeley | SB | Far Side | - | X | X | X | X | X | X | X |
| 49 BS4 Sixth St/Virginia St Berkeley NB Near Side - - X X X X X X | |||||||||||||
| 50 | BS4 | Sixth St/Virginia St | Berkeley | SB | Far Side | - | - | X | X | X | X | X | X |
| 51 BS4 University Ave/Sixth St Berkeley NB Far Side - - X X X - X X | |||||||||||||
| 52 | BS4 | University Ave/Sixth St | Berkeley | SB | Far Side | - | - | X | - | X | - | X | - |
| 53 BS4 University Ave/San Pablo Ave Berkeley NB Far Side - - X X X X X X | |||||||||||||
| 54 | BS4 | University Ave/San Pablo Ave | Berkeley | SB | Far Side | - | - | X | X | X | - | X | X |
| 55 BS4 University Ave/MLK Way Berkeley NB Near Side Relocate to Far Side - X X X X X X | |||||||||||||
| 56 | BS4 | University Ave/MLK Way | Berkeley | SB | Far Side | - | - | X | - | X | X | X | X |
| 57 BS4 Shattuck Ave/Center St Berkeley NB Near Side - - - - - - - X | |||||||||||||
| 58 | BS4 | Shattuck Ave/Center St | Berkeley | SB | Near Side | - | - | - | - | - | - | X | - |
| 59 BS4 Shattuck Ave/Durant Ave Berkeley NB Near Side - - X - X - X - | |||||||||||||
| 60 | BS4 | Shattuck Ave/Durant Ave | Berkeley | SB | Far Side | - | - | X | - | X | - | X | - |
| 61 BS4 Shattuck Ave/Dwight Way Berkeley NB Near Side - - X - X - X X | |||||||||||||
| 62 | BS4 | Shattuck Ave/Dwight Way | Berkeley | SB | Far Side | - | - | - | - | X | - | - | X |
| 71 BS5 Hollis St/65th St Emeryville NB Far Side - - X - X - X - | |||||||||||||
| 72 | BS5 | Hollis St/65th St | Emeryville | SB | Far Side | - | - | X | X | X | - | X | - |
| 73 BS5 Hollis St/59th St Emeryville NB Far Side - - X X X - X X | |||||||||||||
| 74 | BS5 | Hollis St/59th St | Emeryville | SB | Far Side | - | - | X | - | - | - | X | X |
| 75 BS5 Hollis St/53rd St Emeryville NB Far Side - - X X X - X X | |||||||||||||
| 76 | BS5 | Hollis St/53rd St | Emeryville | SB | Far Side | - | - | - | X | X | - | X | X |
| 87 BS5 Hollis St/45th St Emeryville NB Far Side - - X X X - X X | |||||||||||||
| 88 | BS5 | Hollis St/45th St | Emeryville | SB | Near Side | - | - | X | X | X | - | X | X |
| 77 BS5 40th St/Hollis St Emeryville NB Near Side - - X X X - X X | |||||||||||||
| 78 | BS5 | 40th St/Hollis St | Emeryville | SB | Far Side | - | - | X | X | X | - | X | X |
| 79 BS5 40th St/Adeline St Emeryville NB Near Side - - X - - - X X | |||||||||||||
| 80 | BS5 | 40th St/Adeline St | Emeryville | SB | Far Side | - | - | X | - | - | - | X | X |
| 81 BS5 40th St/MacArthur BART Access Rd Oakland NB Far Side - - X - X X X X | |||||||||||||
| 82 | BS5 | 40th St/MacArthur BART Access Rd | Oakland | SB | Near Side | - | - | - | - | - | - | X | - |
| 83 BS5 Broadway/W MacArthur Blvd Oakland NB Far Side - - X - X X X X | |||||||||||||
| 84 | BS5 | Broadway/W MacArthur Blvd | Oakland | SB | Far Side | - | - | - | - | X | - | X | X |
| 63 BS6 Broadway/20th St Oakland NB Far Side - - X - - - X X | |||||||||||||
| 64 | BS6 | Broadway/20th St | Oakland | SB | Far Side | - | - | X | - | X | - | X | - |
| 65 BS6 Broadway/13th St Oakland NB Far Side - - - - - - X X | |||||||||||||
| 66 | BS6 | Broadway/13th St | Oakland | SB | Near Side | - | - | - | - | - | - | - | - |
| 67 BS6 Broadway/7th St Oakland NB Far Side - - - - - - X X | |||||||||||||
| 68 | BS6 | Broadway/7th St | Oakland | SB | Far Side | - | - | X | X | - | X | X | X |
| 69 BS6 Broadway/3rd St Oakland NB Near Side - - X X X X X X | |||||||||||||
| 70 | BS6 | Broadway/3rd St | Oakland | SB | Near Side | - | - | X | X | - | X | X | X |
| 85 BS6 2nd St/Washington St Oakland NB Near Side - - X X X X X X | |||||||||||||
| 86 | BS6 | 2nd St/Washington St | Oakland | SB | Near Side | - | - | X | X | X | X | X | X |
Bus Stop LocaƟons - Proposed Amenity Improvements| Final Report
® ®
WEST CONTRA COSTA COUNTY
EXPRESS BUS IMPLEMENTATION PLAN
| Project ID# Routes Intersection Jurisdiction County | ||||
|---|---|---|---|---|
| TSP1 6, 7 23rd St/Dover Ave San Pablo Contra Costa | ||||
| TSP1 | 6, 7 | 23rd St/Market Ave | San Pablo | Contra Costa |
| TSP1 6, 7 23rd St/Rheem Ave Richmond Contra Costa | ||||
| TSP1 | 6, 7 | 23rd St/Lincoln Ave | Richmond | Contra Costa |
| TSP1 6, 7 23rd St/Garvin Ave Richmond Contra Costa | ||||
| TSP1 | 6, 7 | 23rd St//23rd St | Richmond | Contra Costa |
| TSP1 6, 7 23rd St/Barrett Ave Richmond Contra Costa | ||||
| TSP1 | 6, 7 | 23rd St/Nevin Ave | Richmond | Contra Costa |
| TSP1 6, 7 Macdonald Ave/23rd St Richmond Contra Costa | ||||
| TSP1 | 6, 7 | 22nd St/Roosevelt Ave | Richmond | Contra Costa |
| TSP1 6, 7 Barrett Ave/22nd St Richmond Contra Costa | ||||
| TSP1 | 6, 7 | 22nd St/Nevin Ave | Richmond | Contra Costa |
| TSP1 6, 7 Macdonald Ave/22nd St Richmond Contra Costa | ||||
| TSP1 | 6, 7 | Macdonald Ave/27th St/Broadway | Richmond | Contra Costa |
| TSP1 6, 7 Macdonald Ave/33rd St Richmond Contra Costa | ||||
| TSP1 | 6, 7 | Macdonald Ave/37th St | Richmond | Contra Costa |
| TSP1 6, 7 Macdonald Ave/42nd St Richmond Contra Costa | ||||
| TSP1 | 6, 7 | Macdonald Ave/44th St | Richmond | Contra Costa |
| TSP2 8 Broadway/Rumrill Blvd San Pablo Contra Costa | ||||
| TSP2 | 8 | Rumrill Blvd/Brookside Dr | San Pablo | Contra Costa |
| TSP2 8 Rumrill Blvd/Market Ave San Pablo Contra Costa | ||||
| TSP2 | 8 | Rumrill Blvd/Pine Ave | San Pablo | Contra Costa |
| TSP2 8 Rumrill Blvd/Pine Ave San Pablo Contra Costa | ||||
| TSP2 | 8 | Rumrill Blvd/Sanford Ave | San Pablo | Contra Costa |
| TSP2 8 13th St/Rheem Ave Richmond Contra Costa | ||||
| TSP2 | 8 | Harbour Way/Pennsylvania Ave/10th St | Richmond | Contra Costa |
| TSP2 8 Harbour Way/Roosevelt Ave Richmond Contra Costa | ||||
| TSP2 | 8 | Harbour Way/Barrett Ave | Richmond | Contra Costa |
| TSP2 8 Harbour Way/Nevin Ave Richmond Contra Costa | ||||
| TSP2 | 8 | Harbour Way/Macdonald Ave | Richmond | Contra Costa |
| TSP2 8 Harbour Way/Bissell Ave Richmond Contra Costa | ||||
| TSP2 | 8 | Harbour Way/Chanslor Ave | Richmond | Contra Costa |
| TSP2 8 Harbour Way/Ohio Ave Richmond Contra Costa | ||||
| TSP2 | 8 | Harbour Way/Maine Ave | Richmond | Contra Costa |
| TSP2 8 Harbour Way/Cutting Blvd Richmond Contra Costa | ||||
| TSP2 | 8 | Harbour Way/Hoffman Blvd/I-580 SB On | Richmond | Contra Costa |
| TSP2 8 Marina Way S/Wright Ave Richmond Contra Costa | ||||
| TSP2 | 8 | Marina Bay Pkwy/Meeker Ave | Richmond | Contra Costa |
| TSP3 5 San Pablo Dam Rd/Morrow Dr San Pablo Contra Costa | ||||
| TSP3 | 5 | El Portal Dr/I-80 SB On/I-80 SB On | Contra Costa County | Contra Costa |
| TSP3 5 El Portal Dr/I-80 NB Off/I-80 NB On Contra Costa County Contra Costa | ||||
| TSP3 5 El Portal Dr/San Pablo Dam Rd Contra Costa County Contra Costa |
| Project ID# Routes Intersection Jurisdiction County | ||||
|---|---|---|---|---|
| TSP4 1, 7 Gilman St/Sixth St Berkeley Alameda | ||||
| TSP4 | 1, 7 | Sixth St/Cedar St | Berkeley | Alameda |
| TSP4 1, 7 Sixth St/Virginia St Berkeley Alameda | ||||
| TSP4 | 1, 7 | Sixth St/Hearst St | Berkeley | Alameda |
| TSP4 1, 7 Shattuck Ave/Addison St Berkeley Alameda | ||||
| TSP4 | 1, 7 | Shattuck Ave/Center St | Berkeley | Alameda |
| TSP4 1, 7 Shattuck Ave/Allston Way Berkeley Alameda | ||||
| TSP4 | 1, 7 | Shattuck Ave/Kittredge St | Berkeley | Alameda |
| TSP4 1, 7 Shattuck Ave/Bancroft Way Berkeley Alameda | ||||
| TSP4 | 1, 7 | Shattuck Ave/Durant Ave | Berkeley | Alameda |
| TSP4 1, 7 Shattuck Ave/Channing Way Berkeley Alameda | ||||
| TSP4 | 1, 7 | Shattuck Ave/Haste St | Berkeley | Alameda |
| TSP4 1, 7 Shattuck Ave/Dwight Way Berkeley Alameda | ||||
| TSP5 | 2, 2A, 6 | Hollis St/65th St | Emeryville | Alameda |
| TSP5 2, 2A, 6 Hollis St/64th St Emeryville Alameda | ||||
| TSP5 | 2, 2A, 6 | Hollis St/59th St | Emeryville | Alameda |
| TSP5 2, 2A, 6 Powell St/Hollis St Emeryville Alameda | ||||
| TSP5 | 2, 2A, 6 | Hollis St/Stanford Ave | Emeryville | Alameda |
| TSP5 2, 2A, 6 Hollis St/53rd St Emeryville Alameda | ||||
| TSP5 | 2, 2A, 6 | Hollis St/Park Ave | Emeryville | Alameda |
| TSP5 2, 2A, 6 40th St/Hollis St Emeryville Alameda | ||||
| TSP5 | 2, 2A, 6 | 40th St/Emery St | Emeryville | Alameda |
| TSP5 2, 2A, 6 40th St/Adeline St Emeryville Alameda | ||||
| TSP5 | 2, 2A, 6 | 40th St/Market St | Oakland | Alameda |
| TSP5 2, 2A, 6 40th St/West St Oakland Alameda | ||||
| TSP5 | 2, 2A, 6 | 40th St/MLK Way | Oakland | Alameda |
| TSP5 2, 2A, 6 40th St/MacArthur BART Access Rd Oakland Alameda | ||||
| TSP5 | 2, 2A, 6 | 40th St/Telegraph Ave | Oakland | Alameda |
| TSP5 2, 2A, 6 40th St/Webster St Oakland Alameda | ||||
| TSP5 | 2, 2A, 6 | 40th St/Shafter Ave | Oakland | Alameda |
| TSP5 2, 2A, 6 Ashby Ave/7th St Berkeley Alameda | ||||
| TSP6 | 2B, 3, 8 | W Grand Ave/Mandela Pkwy | Oakland | Alameda |
| TSP6 2B, 3, 8 W Grand Ave/Poplar St Oakland Alameda | ||||
| TSP6 | 2B, 3, 8 | W Grand Ave/Adeline St | Oakland | Alameda |
| TSP6 2B, 3, 8 W Grand Ave/Market St Oakland Alameda | ||||
| TSP6 | 2B, 3, 8 | W Grand Ave/Brush St | Oakland | Alameda |
| TSP6 2B, 3, 8 W Grand Ave/Martin Luther King Jr. Way Oakland Alameda | ||||
| TSP6 | 2B, 3, 8 | W Grand Ave/Northgate Ave | Oakland | Alameda |
| TSP6 2B, 3, 8 W Grand Ave/Telegraph Ave Oakland Alameda | ||||
| TSP6 | 2B, 3, 8 | W Grand Ave/Frontage Rd | Oakland | Alameda |
Transit Signal Priority - Proposed IntersecƟon LocaƟons | Final Report
® ®
WEST CONTRA COSTA COUNTY
EXPRESS BUS IMPLEMENTATION PLAN
® ®
WEST CONTRA COSTA COUNTY
EXPRESS BUS IMPLEMENTATION PLAN E.
CONCEPTUAL LAYOUTS
AND COST ESTIMATES
Final Plan | February 2020
| Location: | Project Number | Transit Center Items | Contingency | Soft Costs | Total |
|---|---|---|---|---|---|
| Hercules Transit Center Addition | TC1 | $ 13,000,000 | $2,600,000 | $ 3,900,000 | $ 19,500,000 |
| Richmond Parkway Transit Center Reconfiguration | TC2/TC2-I | $ 30,980,000 | $6,196,000 | $ 9,300,000 | $ 46,476,000 |
| Location: | Project Number | Roadway | Structural | Electrical | EVCS | ROW | Support Costs | Total |
|---|---|---|---|---|---|---|---|---|
| Hercules Access Improvement | FA1 | $ 2,460,000 | $ 60,000 | $ 220,000 | $ 860,000 | $ 3,600,000 | ||
| Richmond Parkway Access Improvement | FA2 | $ 590,000 | $ 30,000 | $ 210,000 | $ 900,000 | |||
| San Pablo Dam Road Freeway Access Improvement | FA3 | $ 2,200,000 | $1,250,000 | $ 20,000 | $ 1,150,000 | $ 4,600,000 | ||
| I-80 Part-Time Transit Lanes | TL1 | $ 4,540,000 | $ 1,500,000 | $ 6,000,000 | ||||
| Tara Hills Drive Mobility Hub Option 1 | MH1 | $ 1,840,000 | $ 80,000 | $ 200,000 | $ 700,000 | $ 780,000 | $ 3,600,000 | |
| Tara Hills Drive Mobility Hub Option 2 | MH2 | $ 7,370,000 | $ 300,000 | $ 425,000 | $ 2,320,000 | $ 2,910,000 | $ 13,300,000 | |
| San Pablo Dam Road Mobility Hub | MH3 | $ 7,100,000 | $ 350,000 | $ 2,460,000 | $ 9,900,000 | |||
| Bissell Avenue (Richmond East) Park and Ride | MH4 | $ 2,200,000 | $ 19,500 | $ 275,000 | $ 830,000 | $ 3,300,000 | ||
| Wright Avenue (Richmond West) Mobility Hub | MH5 | $ 7,170,000 | $1,700,000 | $ 300,000 | $ 450,000 | $ 3,180,000 | $ 12,800,000 |
General Notes for all estimates within this package: Unit costs were obtained from Caltrans Cost Database (2017-2019 Year) ROW costs were determined from average $/SF within the project area All values are in 2019 dollars Engineer's opinion of probable cost are for programmatic purposes only.
Estimates are based on current available information and do not include field verification and survey. Utility verification and coordination not included in cost.
Date of Estimates: 8/2019 WCCTAC - Transit Freeway Access Improvements PLANNING COST ESTIMATE SUMMARY
Original PDF, page 118
Description Transit Center Items: Quantity Unit Unit Cost Item Total Total Mobilization (10%) 1 LS 1,210,000 $ 1,210,000 $ WPC / Treatment / SWPPP (2%) 1 LS 242,000 $ 242,000 $ Site Preparation 74,080 SF $ 741,000 $ Remove concrete (Curb & Gutter) 750 LF $ 12,000 $ Landscape & Irrigation/MS4 Requirements 50 SF $ 2,000 $ Concrete Pavement 700 SF $ 14,000 $ Striping 150 LF $ 1,000 $ Parking Structure (Includes Ramp) 109,100 SF $ 9,819,000 $ Class I Bike Parking (Double Bike Lockers) 18 EA 5,000 $ 90,000 $ Real-Time Arrival Displays 2 EA 3,500 $ 7,000 $ Electric Vehicle Charging Stations (EVCS) 1 LS 860,000 $ 860,000 $ Power Stations 44 EA
- $
- $
Power Infrastructure 44 EA 15,000 $ 660,000 $ Additional PG&E Power Distribution and Service Infra. 1 LS 200,000 $ 200,000 $ SUBTOTAL 13,000,000 $ CONTINGENCY (20%) 2,600,000 $ TOTAL CAPITAL OUTLAY COSTS (2019 YEAR) 15,600,000 $ Soft Costs Quantity Unit Unit Cost Item Total Total Preliminary Eng/Envir (3%) LS 468,000 $ 468,000 $ Final Design (12%) LS 1,872,000 $ 1,872,000 $ Construction Administration (10%) LS 1,560,000 $ 1,560,000 $ Subtotal "Soft Costs" 3,900,000 $ Grand Total 19,500,000 $ Project TC1 Date of Estimate: 8/2019
WCCTAC - Transit Freeway Access Improvements
PLANNING COST ESTIMATE SUMMARY
- Hercules
Transit Center Addition
Original PDF, page 119
Description
Transit Center Items: Quantity Unit Unit Cost Item Total Total Mobilization (10%) 1 LS 3,030,000 $ 3,030,000 $ Traffic Control (5%) 1 LS 1,515,000 $ 1,515,000 $ WPC / Treatment / SWPPP (2%) 1 LS 606,000 $ 606,000 $ Site Preparation 167,200 SF $ 1,672,000 $ Pavement Excavation 11,250 CY $ 900,000 $ Remove concrete (Curb & Gutter) 5,850 LF $ 88,000 $ Remove concrete (Sidewalk, Bus Bays) 2,000 CY $ 70,000 $ Asphalt Pavement 44,150 SF $ 795,000 $ Curb & Gutter 5,000 LF $ 325,000 $ Concrete Pavement 65,200 SF $ 1,304,000 $ Striping 3,150 LF $ 8,000 $ Standard Shelter (lighting, solar, bench, trash can) 9 EA 55,000 $ 495,000 $ Landscape & Irrigation/MS4 Requirements 5,500 SF $ 220,000 $ Parking Structure 169,350 SF $ 18,629,000 $ Bridge to Parking Structure 1,200 SF $ 480,000 $ Class I Bike Parking (Double Bike Lockers) 16 EA 5,000 $ 80,000 $ Real-Time Arrival Display 2 EA 3,500 $ 7,000 $ Electric Vehicle Charging Stations (EVCS) 1 LS 755,000 $ 755,000 $ Power Stations 37 EA
- $
- $
Power Infrastructure 37 EA 15,000 $ 555,000 $ Additional PG&E Power Distribution and Service Infra. 1 LS 200,000 $ 200,000 $ SUBTOTAL 30,980,000 $ CONTINGENCY (20%) 6,196,000 $ TOTAL CAPITAL OUTLAY COSTS 37,176,000 $ Soft Costs Quantity Unit Unit Cost Item Total Total Preliminary Eng/Envir (3%) LS 1,116,000 $ 1,116,000 $ Final Design (12%) LS 4,462,000 $ 4,462,000 $ Construction Administration (10%) LS 3,718,000 $ 3,718,000 $ Subtotal "Soft Costs" 9,300,000 $ Grand Total 46,476,000 $ Date of Estimate: 8/2019
WCCTAC - Transit Freeway Access Improvements
PLANNING COST ESTIMATE SUMMARY
- Richmond Parkway
Transit Center Reconfiguration/Retrofit
Project TC2
Original PDF, page 120
Description Transit Center Items: Quantity Unit Unit Cost Item Total Total Mobilization (10%) 1 LS 252,000 $ 252,000 $ WPC / Treatment / SWPPP (2%) 1 LS 50,400 $ 50,400 $ Site Preparation 8,400 SF $ 84,000 $ Pavement Excavation 2,100 CY $ 168,000 $ Remove concrete (Curb & Gutter) 200 LF $ 3,000 $ Asphalt Pavement 1,200 SF $ 21,600 $ Curb & Gutter 450 LF $ 29,300 $ Landscape & Irrigation/MS4 Requirements 400 SF $ 16,000 $ Concrete Pavement (Bus Pad) 2,600 SF $ 156,000 $ Concrete Pavement (Sidewalk) 1,300 SF $ 52,000 $ 6" Paint Stripe 150 LF $ $ Paint Pavement Marking 40 SF $ $ Soldier Pile Retaining Wall, 5 to 21 feet 2,850 SF $ 1,140,000 $ Ramp and Stairs 950 SF $ 33,300 $ Type 1 Retaining Wall, 3 to 10 feet 1,350 SF $ 337,500 $ Standard Shelter (lighting, solar, bench, trash can) 3 EA 55,000 $ 165,000 $ Real-Time Arrival Displays 2 EA 3,500 $ 7,000 $ SUBTOTAL 2,520,000 $ CONTINGENCY (20%) 504,000 $ TOTAL CAPITAL OUTLAY COSTS (2019 YEAR) 3,024,000 $ Soft Costs Quantity Unit Unit Cost Item Total Total Preliminary Eng/Envir (3%) LS 91,000 $ 91,000 $ Final Design (12%) LS 363,000 $ 363,000 $ Construction Administration (10%) LS 303,000 $ 303,000 $ Subtotal "Soft Costs" 760,000 $ Grand Total 3,784,000 $ Date of Estimate: 8/2019
WCCTAC - Transit Freeway Access Improvements
PLANNING COST ESTIMATE SUMMARY
- Richmond Transit Center
Bus Pullout and Interin Pedestrian Access - Project TC2-I
Original PDF, page 121
Description Roadway Items: Quantity Unit Unit Cost Item Total Total Clearing and Grubbing 1 LS 15,000 $ 15,000 $ Roadway Excavation 5,900 CY $ 472,000 $ Remove Concrete Sidewalk 250 SY $ 9,000 $ Pavement 15,500 SF $ 279,000 $ Curb & Gutter 600 LF $ 39,000 $ Remove striping 1,650 SF $ 7,000 $ Striping 3,250 LF $ 9,000 $ Wayfinding/Signage 1 LS 30,000 $ 30,000 $ Security/Communications 1 LS 200,000 $ 200,000 $ Concrete Sidewalk 1,300 SF $ 20,000 $ Traffic Signal Modification 1 LS 50,000 $ 50,000 $ Utility Relocation 2 EA 10,000 $ 20,000 $ Drainage 1 LS 230,000 $ 230,000 $ WPC / Treatment / SWPPP (10%) 1 LS 108,000 $ 108,000 $ Roadway Additions (10%) 1 LS 108,000 $ 108,000 $ Mobilization (10%) 1 LS 159,600 $ 160,000 $ Contingency (40%) 1 LS 702,400 $ 703,000 $ Roadway Subtotal 2,460,000 $ Electrical Items:
Relocate Lighting 2 EA 20,000 $ 40,000 $ Mobilization (10%) 1 LS 4,000 $ 4,000 $ Contingency (40%) 1 LS 16,000 $ 16,000 $ Electrical Subtotal 60,000 $ Right of way Items:
Quantity Unit Unit Cost Item Total Total Acquisition costs 3,900 SF $ 215,000 $ Right of way Subtotal 220,000 $ SUBTOTAL CONSTRUCTION COSTS (2019 YEAR) 2,520,000 $ TOTAL RIGHT OF WAY COST 220,000 $ TOTAL CAPITAL OUTLAY COSTS (2019 YEAR) 2,740,000 $ Support Costs Quantity Unit Unit Cost Item Total Total Preliminary Eng/Envir (6%) 1 LS 152,000 $ 152,000 $ Final Design (15%) 1 LS 378,000 $ 378,000 $ Construction Administration (12%) 1 LS 303,000 $ 303,000 $ R/W Engineering/Acquisition (10% of ROW Costs) 1 LS 22,000 $ 22,000 $ Subtotal "Support Costs" 860,000 $ GRAND TOTAL 3,600,000 $ Phasing Phasing Duration Preliminary Eng/Envir 9-12 months Final Design 12-15 months ROW Acquisition 6-9 months Construction 12-15 months TOTAL 33-42 months
- New Pavement cost includes base, subbase and roadway excavation cost for pavement section.
- Soft cost is percentage of Roadway and Structure Items except R/W Engineering which is 10% of R/W Items.
Date of Estimate: 8/2019
WCCTAC - Transit Freeway Access Improvements
PLANNING COST ESTIMATE SUMMARY Project FA1 Hercules HOV Lane Addition
Original PDF, page 122
Description
Roadway Items: Quantity Unit Unit Cost Item Total Total Clearing and Grubbing 1 LS 15,000 $ 15,000 $ Roadway Excavation 100 CY $ 8,000 $ Remove concrete (Curb & Gutter, Sidewalk) 150 CY $ 60,000 $ Pavement 1,700 SF $ 31,000 $ Curb & Gutter 450 LF $ 30,000 $ Remove striping 150 SF $ 1,000 $ Roadside Sign - One Post 6 EA $ 2,000 $ Traffic Signal 1 LS 25,000 $ 25,000 $ Striping 3,100 LF $ 8,000 $ Utility Relocation 2 EA 50,000 $ 100,000 $ Concrete Sidewalk 1,850 SF $ 37,000 $ WPC / Treatment / SWPPP (10%) 1 LS 31,700 $ 32,000 $ Roadway Additions (10%) 1 LS 31,700 $ 32,000 $ Mobilization (10%) 1 LS 38,100 $ 39,000 $ Contingency (40%) 1 LS 168,000 $ 168,000 $ Roadway Subtotal 590,000 $ Electrical Items:
Relocate Lighting 1 EA 20,000 $ 20,000 $ Mobilization (10%) 1 LS 2,000 $ 2,000 $ Contingency (40%) 1 LS 8,000 $ 8,000 $ Electrical Subtotal 30,000 $ SUBTOTAL CONSTRUCTION COSTS 620,000 $ TOTAL CAPITAL OUTLAY COSTS 620,000 $ Support Costs Quantity Unit Unit Cost Item Total Total Preliminary Eng/Envir (6%) LS 38,000 $ 38,000 $ Final Design (15%) LS 93,000 $ 93,000 $ Construction Administration (12%) LS 75,000 $ 75,000 $ Subtotal "Support Costs" 210,000 $ GRAND TOTAL 900,000 $ Phasing Phasing Duration Preliminary Eng/Envir 9-12 months Final Design 9-12 months Utility Coordination 12-15 months Construction 9-12 months TOTAL 27-36 months
- New Pavement cost includes base, subbase and roadway excavation cost for pavement section.
- Soft cost is percentage of Roadway and Structure Items except R/W Engineering which is 10% of R/W Items.
Date of Estimate: 7/31/2019
WCCTAC - Transit Freeway Access Improvements
PLANNING COST ESTIMATE SUMMARY
Project FA2
Richmond Parkway
HOV lane to I-80
Original PDF, page 123
Description
Roadway Items: Quantity Unit Unit Cost Item Total Total Clearing and Grubbing 1 LS 10,000 $ 10,000 $ Roadway Excavation 2,200 CY $ 176,000 $ Pavement 7,297 SF $ 132,000 $ Curb & Gutter 221 LF $ 15,000 $ Striping 1 LS 7,000 $ 7,000 $ Roadside Sign - One Post 5 EA $ 2,000 $ Lighting 2 EA 16,000 $ 32,000 $ Temporary Traffic Control System/Staging 1 LS 150,000 $ 150,000 $ Traffic Electrical 1 LS 450,000 $ 450,000 $ Concrete (Sidewalk, Island, Curb Ramp) 1,211 SF $ 19,000 $ Drainage 1 LS 198,600 $ 199,000 $ Removal 1 LS 10,000 $ 10,000 $ WPC / Treatment / SWPPP (10%) 1 LS 99,300 $ 100,000 $ Roadway Additions (10%) 1 LS 120,200 $ 121,000 $ Mobilization (10%) 1 LS 142,300 $ 143,000 $ Contingency (40%) 1 LS 626,400 $ 627,000 $ Roadway Subtotal 2,200,000 $ Structure items:
Quantity Unit Unit Cost Item Total Total Retaining wall 5,000 SF $ 750,000 $ Soundwall 1,920 SF $ 116,000 $ Mobilization (10%) 1 LS 75,000 $ 75,000 $ Contingency (40%) 1 LS 300,000 $ 300,000 $ Structure Subtotal 1,250,000 $ Right of way Items:
Quantity Unit Unit Cost Item Total Total Acquisition costs SF $ 13,000 $ Right of way Subtotal 20,000 $ SUBTOTAL CONSTRUCTION COSTS (2019 YEAR) 3,450,000 $ TOTAL RIGHT OF WAY COST 20,000 $ TOTAL CAPITAL OUTLAY COSTS (2019 YEAR) 3,470,000 $ Support Costs Quantity Unit Unit Cost Item Total Total Preliminary Eng/Envir (6%) LS 207,000 $ 207,000 $ Final Design (15%) LS 518,000 $ 518,000 $ Construction Administration (12%) LS 414,000 $ 414,000 $ R/W Engineering/Acquisition (10% of ROW Costs) LS 2,000 $ 2,000 $ Subtotal "Support Costs" 1,150,000 $ GRAND TOTAL 4,600,000 $ Phasing Phasing Duration Preliminary Eng/Envir 12-15 months Final Design 12-15 months ROW Acquisition 6-12 months Construction 15-24 months TOTAL 39-54 months
- New Pavement cost includes base, subbase and roadway excavation cost for pavement section.
- Soft cost is percentage of Roadway and Structure Items except R/W Engineering which is 10% of R/W Items.
Date of Estimate: 8/2019
WCCTAC - Transit Freeway Access Improvements
PLANNING COST ESTIMATE SUMMARY
Project FA3
San Pablo Dam Rd / WB I-80 On-Ramp Transit Lane
Original PDF, page 124
Description
Roadway Items: Quantity Unit Unit Cost Item Total Total Clearing and Grubbing 1 LS 50,000 $ 50,000 $ Roadway Excavation 5,738 CY $ 460,000 $ Pavement 51,644 SF $ 930,000 $ Cold Plane and Overlay 1 LS 270,000 $ 270,000 $ Dike 12,911 LF $ 65,000 $ Striping 1 LS 50,000 $ 50,000 $ Roadside Sign - One Post 50 EA $ 15,000 $ Guardrail 3,475 LF $ 209,000 $ Lighting Relocation 2 EA 5,000 $ 10,000 $ Temporary Traffic Control System/Staging 1 LS 200,000 $ 200,000 $ WPC / Treatment / SWPPP 1 LS 300,000 $ 300,000 $ Drainage 5 EA 23,200 $ 116,000 $ Roadway Additions (10%) 1 LS 267,500 $ 268,000 $ Mobilization (10%) 1 LS 294,300 $ 295,000 $ Contingency (40%) 1 LS 1,295,200 $ 1,296,000 $ Roadway Subtotal 4,540,000 $ SUBTOTAL CONSTRUCTION COSTS (2019 YEAR) 4,540,000 $ TOTAL CAPITAL OUTLAY COSTS (2019 YEAR) 4,540,000 $ Support Costs Quantity Unit Unit Cost Item Total Total Preliminary Eng/Envir (6%) LS 273,000 $ 273,000 $ Final Design (15%) LS 681,000 $ 681,000 $ Construction Administration (12%) LS 545,000 $ 545,000 $ Subtotal "Support Costs" 1,500,000 $ GRAND TOTAL 6,000,000 $ Phasing Phasing Duration Preliminary Eng/Envir 15-18 months months Final Design 6-9 months months ROW Acquisition N/A Construction 6-9 months TOTAL 27-36 months
- New Pavement cost includes base, subbase and roadway excavation cost for pavement section.
- Soft cost is percentage of Roadway and Structure Items except R/W Engineering which is 10% of R/W Items.
- This estimate does not include ramp metering or other communication technology.
Date of Estimate: 8/2019
WCCTAC - Transit Freeway Access Improvements
PLANNING COST ESTIMATE SUMMARY
Project TL1
I-80 Part-Time Transit Lanes
Original PDF, page 125
Description Roadway Items: Quantity Unit Unit Cost Item Total Total Remove AC Pavement 34,800 SF $ 70,000 $ Pavement 34,800 SF $ 627,000 $ Striping 1,850 LF $ 5,000 $ Chainlink Fence 750 LF $ 30,000 $ Secure Bike Lockers (includes concrete pedestal) 2 EA 5,000 $ 10,000 $ Wayfinding/Signage 1 LS 30,000 $ 30,000 $ Security/Communications 1 LS 200,000 $ 200,000 $ Drainage 1 LS 146,400 $ 147,000 $ Roadway Additions (10%) 1 LS 73,200 $ 74,000 $ Mobilization (10%) 1 LS 119,300 $ 120,000 $ Contingency (40%) 1 LS 525,200 $ 526,000 $ Roadway Subtotal 1,840,000 $ Electrical Items:
Lighting 1 LS 50,000 $ 50,000 $ Mobilization (10%) 1 LS 5,000 $ 5,000 $ Contingency (40%) 1 LS 20,000 $ 20,000 $ Electrical Subtotal 80,000 $ Electric Vehicle Charging Station (EVCS) Infrastructure (per space) 4 EA 25,000 $ 100,000 $ Utility Improvements (includes new transformer) 1 LS 100,000 $ 100,000 $ EVCS Subtotal 200,000 $ Right of way Items:
Quantity Unit Unit Cost Item Total Total Acquisition costs 34,800 SF $ 696,000 $ Right of way Subtotal 700,000 $ Total Right of Way Cost (Escalated Value)
- $
SUBTOTAL CONSTRUCTION COSTS (2019 YEAR) 2,120,000 $ TOTAL RIGHT OF WAY COST 700,000 $ TOTAL CAPITAL OUTLAY COSTS (2019 YEAR) 2,820,000 $ Support Costs Quantity Unit Unit Cost Item Total Total Preliminary Eng/Envir (6%) LS 128,000 $ 128,000 $ Final Design (15%) LS 318,000 $ 318,000 $ Construction Administration (12%) LS 255,000 $ 255,000 $ R/W Engineering/Acquisition (10% of ROW Costs) LS 70,000 $ 70,000 $ Subtotal "Support Costs" 780,000 $ GRAND TOTAL 3,600,000 $ Phasing Phasing Duration Preliminary Eng/Envir 3-6 months Final Design 6-9 months ROW Acquisition 3-6 months Construction 3-6 months TOTAL 12-21 months
- New Pavement cost includes base, subbase and roadway excavation cost for pavement section.
- Soft cost is percentage of Roadway and Structure Items except R/W Engineering which is 10% of R/W Items.
Infrastructure and utility improvements to be verified with utility agency
- EVCS costs do not include coordination efforts with local utility agency and are not reflective of all costs associated with EVCS installation and use.
WCCTAC - Transit Freeway Access Improvements
PLANNING COST ESTIMATE SUMMARY Project MH1 Tara Hills Mobility Hub Option 1 located southwest of Tara Hills Drive and San Pablo Avenue Date of Estimate: 8/2019
Original PDF, page 126
Description Roadway Items: Quantity Unit Unit Cost Item Total Total Clearing and Grubbing 1 LS 50,000 $ 50,000 $ Earthwork Excavation 8,600 CY $ 731,000 $ Pavement 115,900 SF $ 2,087,000 $ Curb & Gutter 750 LF $ 49,000 $ Striping 6,650 LF $ 17,000 $ Concrete (Sidewalk, Curb Ramp) 4,700 SF $ 71,000 $ Remove Concrete (Curb & Gutter, Sidewalk) 300 CY $ 120,000 $ Wayfinding/Signage 1 LS 30,000 $ 30,000 $ Security/Communications 1 LS 200,000 $ 200,000 $ Chainlink Fence 1,000 LF $ 40,000 $ Secure Bike Lockers (includes concrete pedestal) 6 EA 5,000 $ 30,000 $ Drainage 1 LS 679,000 $ 679,000 $ WPC / Treatment / SWPPP (10%) 1 LS 339,500 $ 340,000 $ Roadway Additions (10%) 1 LS 339,500 $ 340,000 $ Mobilization (10%) 1 LS 478,400 $ 479,000 $ Contingency (40%) 1 LS 2,105,200 $ 2,106,000 $ Roadway Subtotal 7,370,000 $ Electrical Items:
Lighting 1 LS 200,000 $ 200,000 $ Mobilization (10%) 1 LS 20,000 $ 20,000 $ Contingency (40%) 1 LS 80,000 $ 80,000 $ Electrical Subtotal 300,000 $ Electric Vehicle Charging Station (EVCS) Infrastructure (per space) 13 EA 25,000 $ 325,000 $ Utility Improvements (includes new transformer) 1 LS 100,000 $ 100,000 $ EVCS Subtotal 425,000 $ Right of way Items:
Quantity Unit Unit Cost Item Total Total Acquisition costs 115,900 SF $ 2,318,000 $ Right of way Subtotal 2,320,000 $ Total Right of Way Cost (Escalated Value)
- $
SUBTOTAL CONSTRUCTION COSTS (2019 YEAR) 8,100,000 $ TOTAL RIGHT OF WAY COST 2,320,000 $ TOTAL CAPITAL OUTLAY COSTS (2019 YEAR) 10,420,000 $ Support Costs Quantity Unit Unit Cost Item Total Total Preliminary Eng/Envir (6%) LS 486,000 $ 486,000 $ Final Design (15%) LS 1,215,000 $ 1,215,000 $ Construction Administration (12%) LS 972,000 $ 972,000 $ R/W Engineering/Acquisition (10% of ROW Costs) LS 232,000 $ 232,000 $ Subtotal "Support Costs" 2,910,000 $ GRAND TOTAL 13,300,000 $ Phasing Phasing Duration Preliminary Eng/Envir 12-15 months Final Design 6-9 months ROW Acquisition 6-9 months Construction 6-9 months TOTAL 24-33 months
- New Pavement cost includes base, subbase and roadway excavation cost for pavement section.
- Soft cost is percentage of Roadway and Structure Items except R/W Engineering which is 10% of R/W Items.
Infrastructure and utility improvements to be verified with utility agency
- EVCS costs do not include coordination efforts with local utility agency and are not reflective of all costs associated with EVCS installation and use.
Date of Estimate: 8/2019
WCCTAC - Transit Freeway Access Improvements
PLANNING COST ESTIMATE SUMMARY Project MH2 Tara Hills Mobility Hub Option 2 located northeast of Tara Hills Drive and San Pablo Avenue
Original PDF, page 127
Description
Roadway Items: Quantity Unit Unit Cost Item Total Total Clearing and Grubbing 1 LS 10,000 $ 10,000 $ Roadway Excavation 7,500 CY $ 600,000 $ Pavement 67,000 SF $ 1,206,000 $ Curb & Gutter 600 LF $ 39,000 $ Secure Bike Lockers (includes concrete pedestal) 8 EA 5,000 $ 40,000 $ Striping 460 LF $ 2,000 $ Wayfinding/Signage 1 LS 30,000 $ 30,000 $ Security/Communications 1 LS 200,000 $ 200,000 $ Lighting 23 EA 16,000 $ 368,000 $ Temporary Traffic Control System/Staging 1 LS 150,000 $ 150,000 $ Traffic Electrical 1 LS 500,000 $ 500,000 $ Chain Link Fence 1,500 LF $ 60,000 $ Concrete (Sidewalk, Island, Curb Ramp) 1,875 SF $ 29,000 $ Drainage 1 LS 646,800 $ 647,000 $ Removal 1 LS 10,000 $ 10,000 $ WPC / Treatment / SWPPP (10%) 1 LS 323,400 $ 324,000 $ Roadway Additions (10%) 1 LS 389,100 $ 390,000 $ Mobilization (10%) 1 LS 460,500 $ 461,000 $ Contingency (40%) 1 LS 2,026,400 $ 2,027,000 $ Roadway Subtotal 7,100,000 $ Electric Vehicle Charging Station (EVCS) Infrastructure (per space) 10 EA 25,000 $ 250,000 $ Utility Improvements (includes new transformer) 1 LS 100,000 $ 100,000 $ EVCS Subtotal 350,000 $ SUBTOTAL CONSTRUCTION COSTS (2019 YEAR) 7,450,000 $ TOTAL CAPITAL OUTLAY COSTS (2019 YEAR) 7,450,000 $ Support Costs Quantity Unit Unit Cost Item Total Total Preliminary Eng/Envir (6%) LS 447,000 $ 447,000 $ Final Design (15%) LS 1,118,000 $ 1,118,000 $ Construction Administration (12%) LS 894,000 $ 894,000 $ Subtotal "Support Costs" 2,460,000 $ GRAND TOTAL 9,900,000 $ Phasing Phasing Duration Preliminary Eng/Envir 12-15 months Final Design 9-12 months ROW Acquisition 9-12 months Construction 12-15 months TOTAL 33-42 months
- New Pavement cost includes base, subbase and roadway excavation cost for pavement section.
- Soft cost is percentage of Roadway and Structure Items except R/W Engineering which is 10% of R/W Items.
Infrastructure and utility improvements to be verified with utility agency
- EVCS costs do not include coordination efforts with local utility agency and are not reflective of all costs associated with EVCS installation and use.
WCCTAC - Transit Freeway Access Improvements
PLANNING COST ESTIMATE SUMMARY
Project MH3
San Pablo Dam Rd Mobility Hub
Date of Estimate: 8/2019
Original PDF, page 128
Description
Roadway Items: Quantity Unit Unit Cost Item Total Total Clearing and Grubbing 1 LS 10,000 $ 10,000 $ Remove AC Pavement 39,900 SF $ 80,000 $ Pavement 39,900 SF $ 719,000 $ Secure Bike Lockers (includes concrete pedestal) 6 EA 5,000 $ 30,000 $ Curb & Gutter 100 LF $ 7,000 $ Striping 2,950 LF $ 8,000 $ Remove striping 1,500 SF $ 6,000 $ Wayfinding/Signage 1 LS 30,000 $ 30,000 $ Security/Communications 1 LS 200,000 $ 200,000 $ Concrete (Sidewalk, Island, Curb Ramp) 2,800 SF $ 56,000 $ Remove concrete (Curb & Gutter, Sidewalk) 100 CY $ 40,000 $ WPC / Treatment / SWPPP (10%) 1 LS 118,600 $ 119,000 $ Roadway Additions (10%) 1 LS 118,600 $ 119,000 $ Mobilization (10%) 1 LS 142,400 $ 143,000 $ Contingency (40%) 1 LS 626,800 $ 627,000 $ Roadway Subtotal 2,200,000 $ Electrical Items:
Light Pole and Foundation 1 EA 12,500 $ 12,500 $ Mobilization (10%) 1 LS 2,000 $ 2,000 $ Contingency (40%) 1 LS 5,000 $ 5,000 $ Electrical Subtotal 19,500 $ Electric Vehicle Charging Station (EVCS) Infrastructure (per space) 7 EA 25,000 $ 175,000 $ Utility Improvements (includes new transformer) 1 LS 100,000 $ 100,000 $ EVCS Subtotal 275,000 $ SUBTOTAL CONSTRUCTION COSTS 2019 YEAR) 2,500,000 $ TOTAL CAPITAL OUTLAY COSTS (2019 YEAR) 2,500,000 $ Support Costs Quantity Unit Unit Cost Item Total Total Preliminary Eng/Envir (6%) LS 150,000 $ 150,000 $ Final Design (15%) LS 375,000 $ 375,000 $ Construction Administration (12%) LS 300,000 $ 300,000 $ Subtotal "Support Costs" 830,000 $ GRAND TOTAL 3,300,000 $ Phasing Phasing Duration Preliminary Eng/Envir 3-6 months Final Design 6-9 months ROW Acquisition 3-6 months Construction 3-6 months TOTAL 12-21 months
- New Pavement cost includes base, subbase and roadway excavation cost for pavement section.
- Soft cost is percentage of Roadway and Structure Items except R/W Engineering which is 10% of R/W Items.
- R/W costs are not included in this estimate. Assumed County will release property at no cost. Further coordination required.
Infrastructure and utility improvements to be verified with utility agency
- EVCS costs do not include coordination efforts with local utility agency and are not reflective of all costs associated with EVCS installation and use.
Date of Estimate: 8/2019
WCCTAC - Transit Freeway Access Improvements
PLANNING COST ESTIMATE SUMMARY
Project MH4
Bissell Avenue (Richmond East) Mobility Hub
at Bissell Avenue and 39th Street
Original PDF, page 129
Description Roadway Items: Quantity Unit Unit Cost Item Total Total Clearing and Grubbing 1 LS 50,000 $ 50,000 $ Earthwork Excavation 8,500 CY $ 723,000 $ Pavement 114,700 SF $ 2,065,000 $ Curb & Gutter 1,650 LF $ 108,000 $ Striping 7,950 LF $ 20,000 $ Concrete (Sidewalk, Curb Ramp) 14,400 SF $ 216,000 $ Remove Concrete (Curb & Gutter, Sidewalk) 300 CY $ 120,000 $ Roadside Sign - One Post 4 EA $ 2,000 $ Chainlink Fence 1,850 LF $ 74,000 $ Secure Bike Lockers (includes concrete pedestal) 6 EA 5,000 $ 30,000 $ Wayfinding/Signage 1 LS 30,000 $ 30,000 $ Security/Communications 1 LS 200,000 $ 200,000 $ Drainage 1 LS 337,800 $ 338,000 $ WPC / Treatment / SWPPP (10%) 1 LS 337,800 $ 338,000 $ Roadway Additions (10%) 1 LS 337,800 $ 338,000 $ Mobilization (10%) 1 LS 465,200 $ 466,000 $ Contingency (40%) 1 LS 2,047,200 $ 2,048,000 $ Roadway Subtotal 7,170,000 $ Electrical Items:
Lighting 1 EA 200,000 $ 200,000 $ Mobilization (10%) 1 LS 20,000 $ 20,000 $ Contingency (40%) 1 LS 80,000 $ 80,000 $ Electrical Subtotal 300,000 $ Electric Vehicle Charging Station (EVCS) Infrastructure (per space) 14 EA 25,000 $ 350,000 $ Utility Improvements (includes new transformer) 1 LS 100,000 $ 100,000 $ EVCS Subtotal 450,000 $ Structure items:
Quantity Unit Unit Cost Item Total Total Retaining wall 9,400 SF $ 1,128,000 $ Mobilization (10%) 1 LS 113,000 $ 113,000 $ Contingency (40%) 1 LS 452,000 $ 452,000 $ Structure Subtotal 1,700,000 $ SUBTOTAL CONSTRUCTION COSTS (2019 YEAR) 9,620,000 $ TOTAL CAPITAL OUTLAY COSTS (2019 YEAR) 9,620,000 $ Support Costs Quantity Unit Unit Cost Item Total Total Preliminary Eng/Envir (6%) LS 578,000 $ 578,000 $ Final Design (15%) LS 1,443,000 $ 1,443,000 $ Construction Administration (12%) LS 1,155,000 $ 1,155,000 $ Subtotal "Support Costs" 3,180,000 $ GRAND TOTAL 12,800,000 $ Phasing Phasing Duration Preliminary Eng/Envir 12-15 months Final Design 9-12 months ROW Acquisition 6-9 months Construction 9-12 months TOTAL 30-39 months
- New Pavement cost includes base, subbase and roadway excavation cost for pavement section.
- Soft cost is percentage of Roadway and Structure Items except R/W Engineering which is 10% of R/W Items.
Infrastructure and utility improvements to be verified with utility agency
- EVCS costs do not include coordination efforts with local utility agency and are not reflective of all costs associated with EVCS installation and use.
Date of Estimate: 8/2019
WCCTAC - Transit Freeway Access Improvements
PLANNING COST ESTIMATE SUMMARY Project MH5 Wright Avenue (Richmond West) Mobility Hub located on Wright Avenue east of Marina Way South
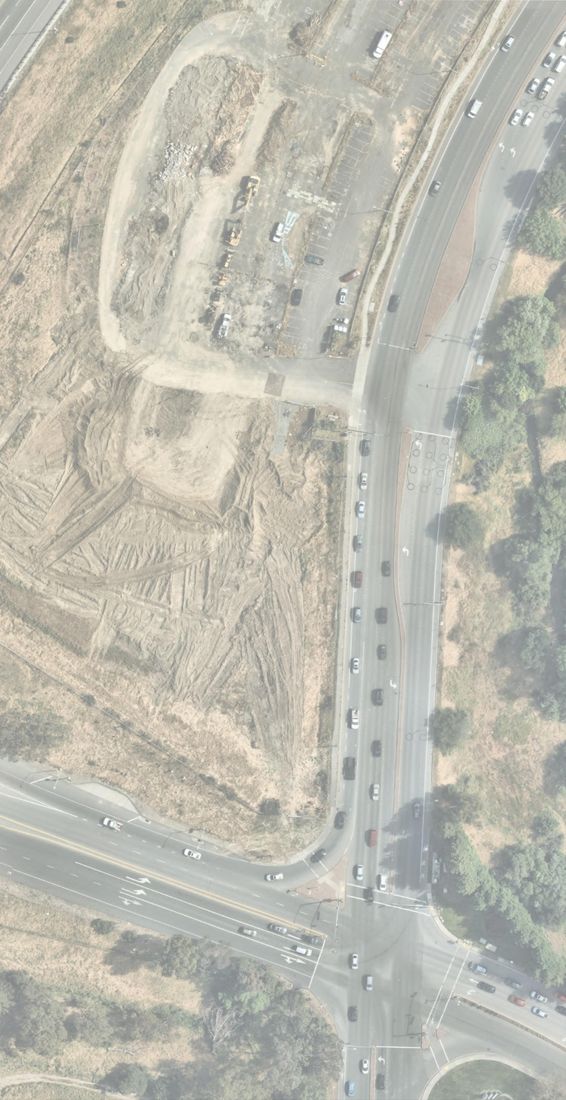
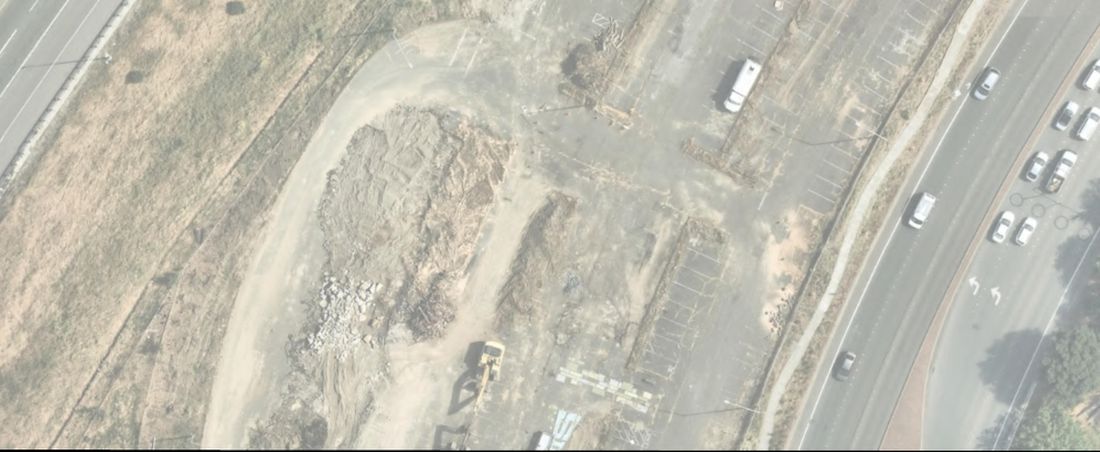
Original PDF, page 130
WCCTAC EXPRESS BUS IMPLEMENTATION PLAN
HERCULES RIGHT TURN HOV LANE - PROJECT FA1
JANUARY 2020
MATCH LINE - SEE NEXT SHEET
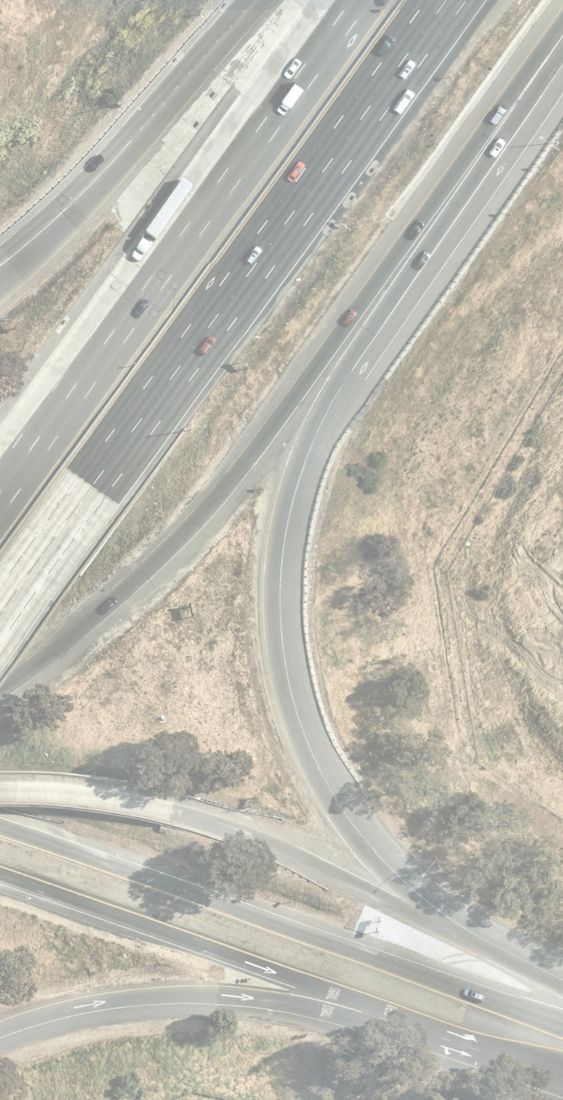
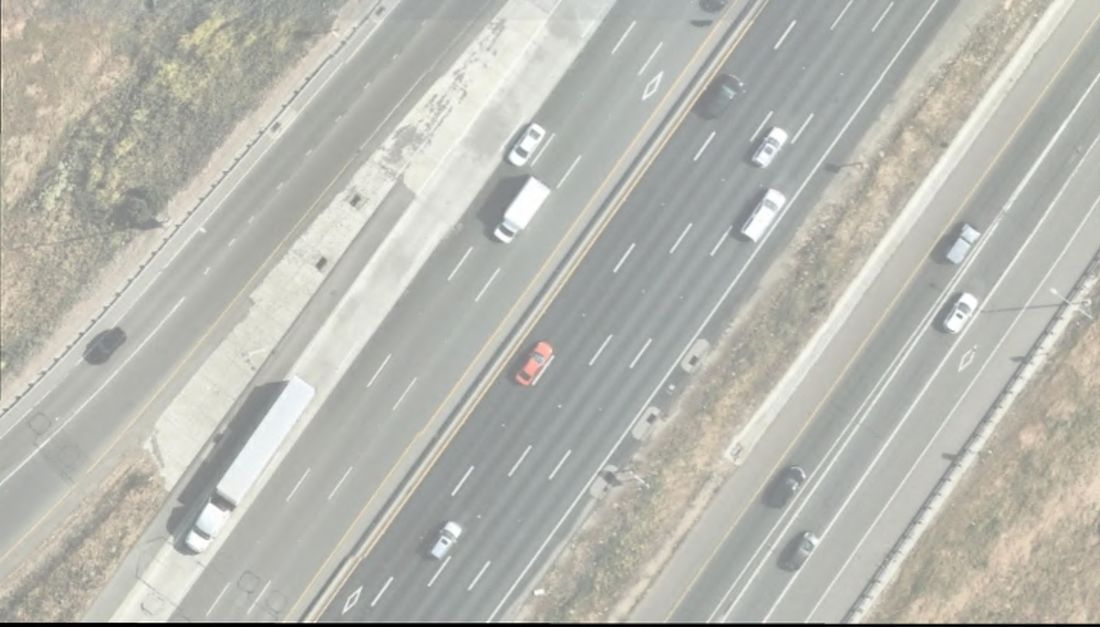
INTERSTATE
MATCH LINE - SEE PREVIOUS SHEET
WCCTAC EXPRESS BUS IMPLEMENTATION PLAN
HERCULES RIGHT TURN HOV LANE - PROJECT FA1
JANUARY 2020
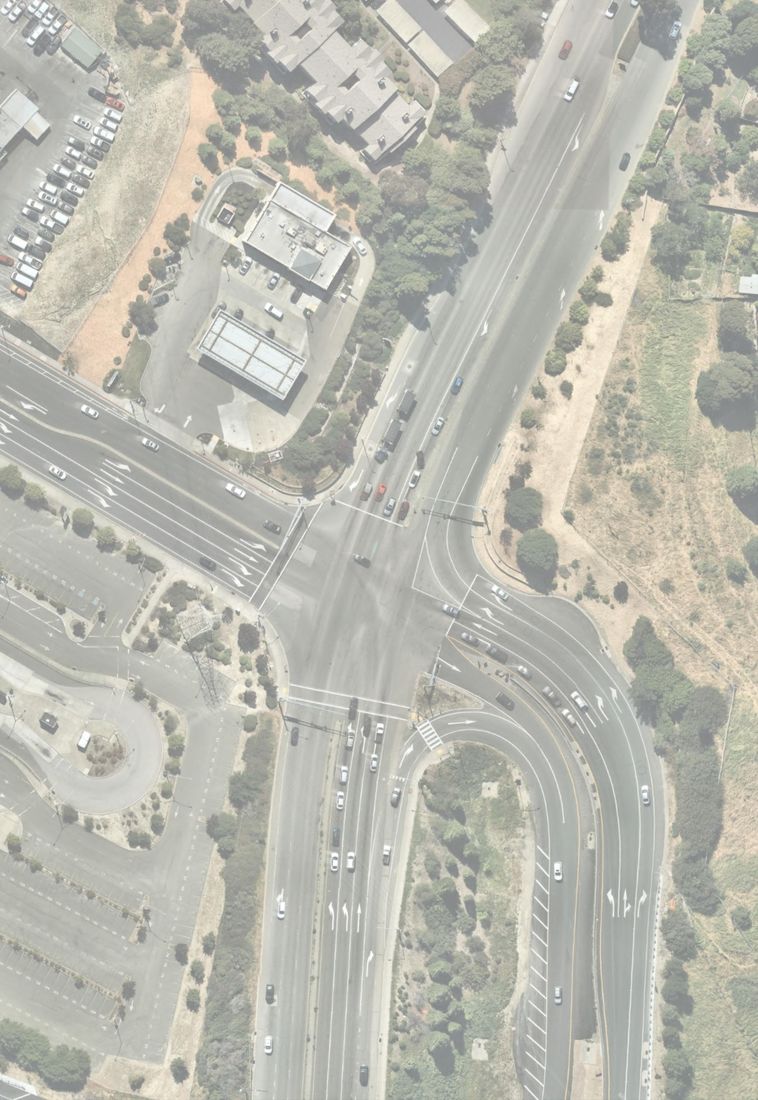
WCCTAC EXPRESS BUS IMPLEMENTATION PLAN
RICHMOND PARKWAY FREEWAY ACCESS - PROJECT FA2
JANUARY 2020
MATCH LINE - SEE NEXT SHEET
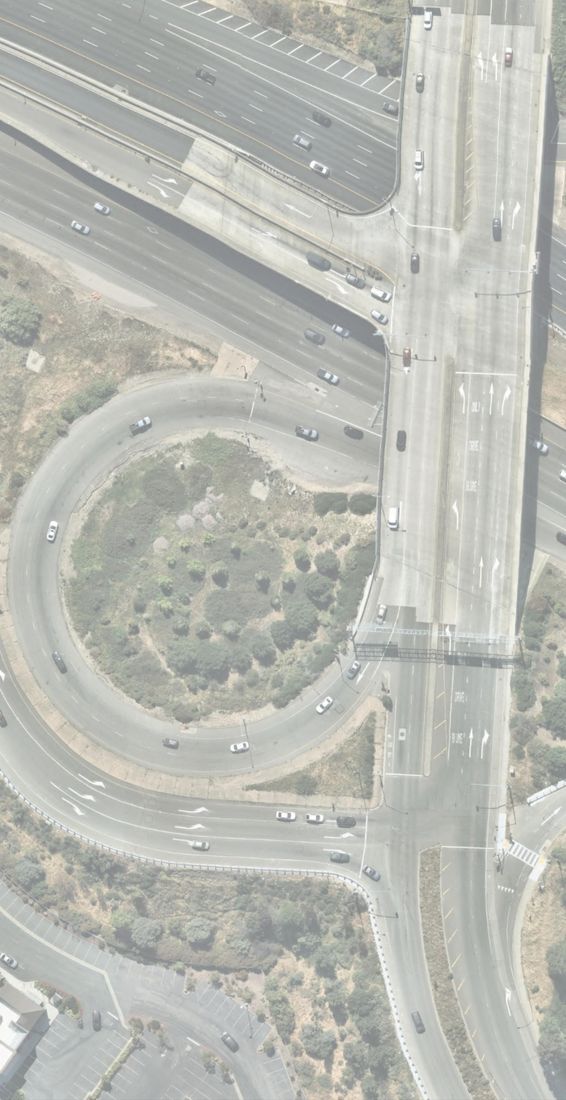
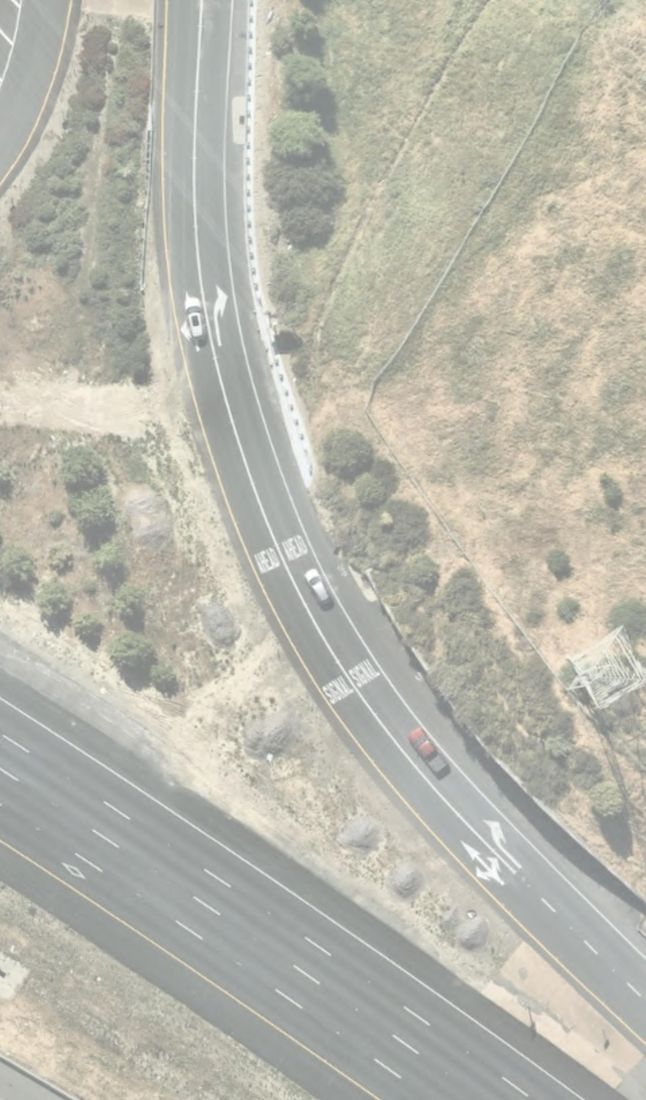
INTERSTATE INTERSTATE
WCCTAC EXPRESS BUS IMPLEMENTATION PLAN
RICHMOND PARKWAY FREEWAY ACCESS - PROJECT FA2
JANUARY 2020
MATCH LINE - SEE PREVIOUS SHEET
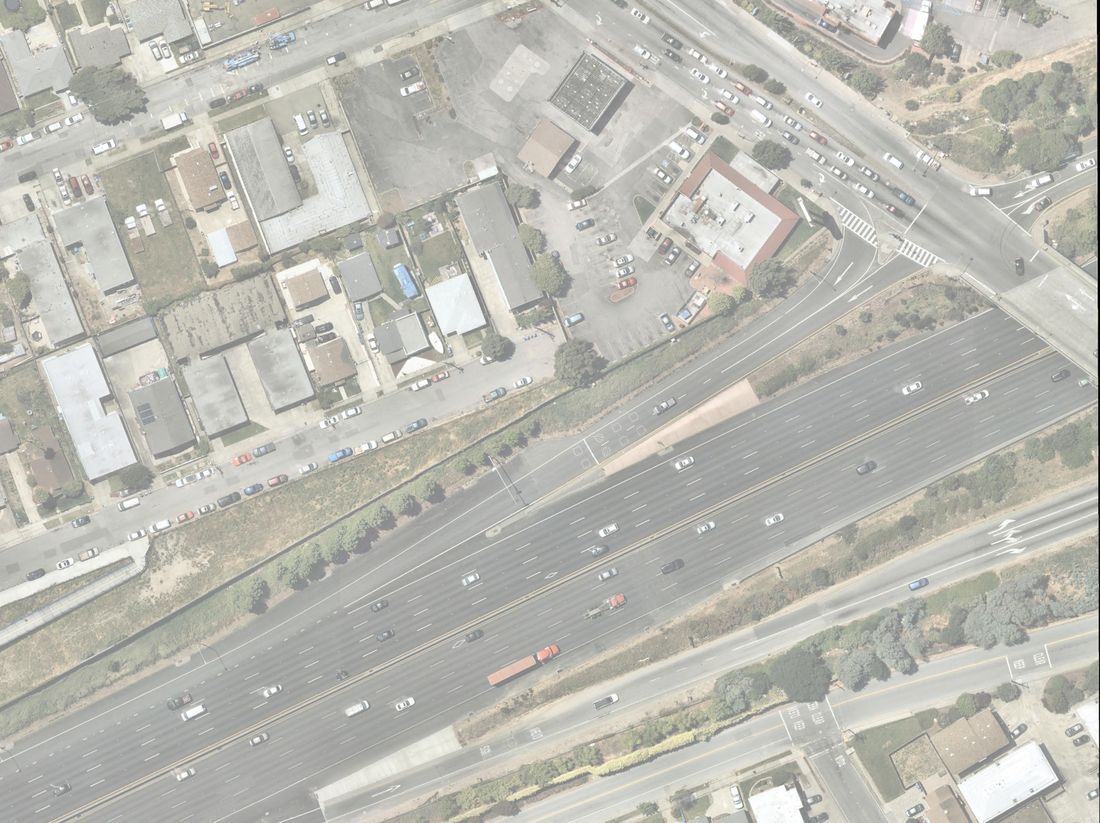
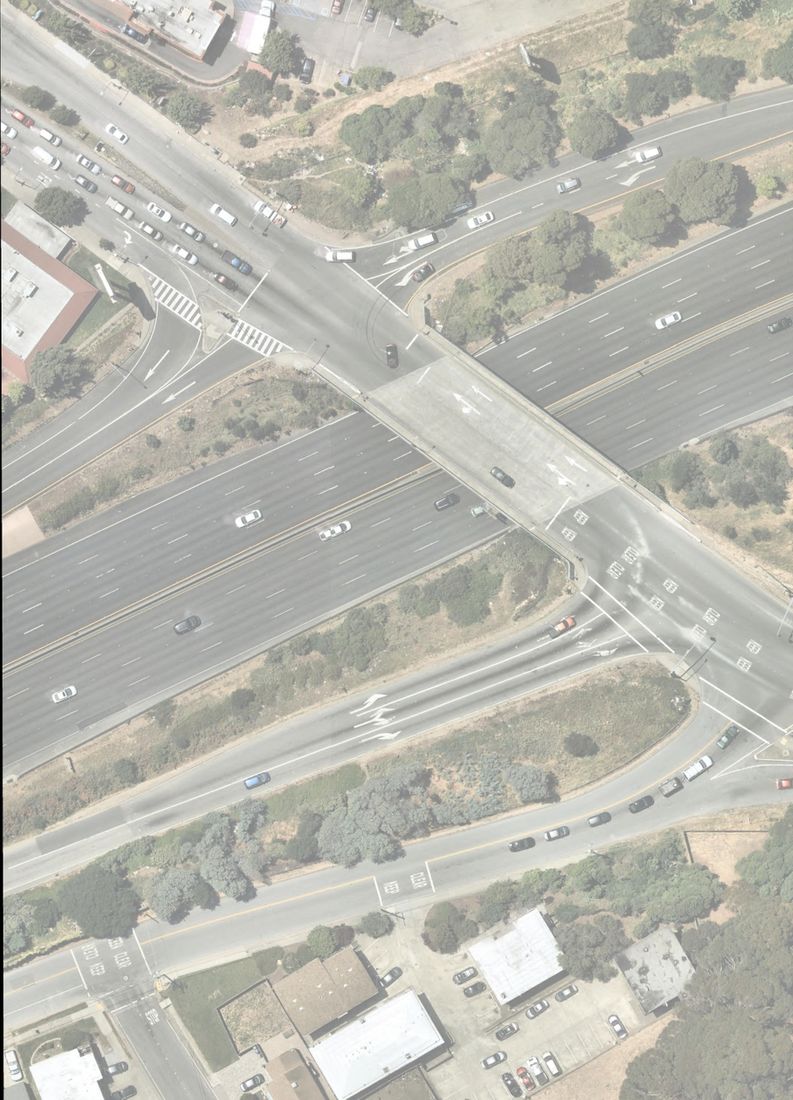
INTERSTATE
WWCTAC EXPRESS BUS IMPLEMENTATION PLAN
SAN PABLO DAM ROAD FREEWAY ACCESS - PROJECT FA3
JANUARY 2020
MATCH LINE - SEE NEXT SHEET
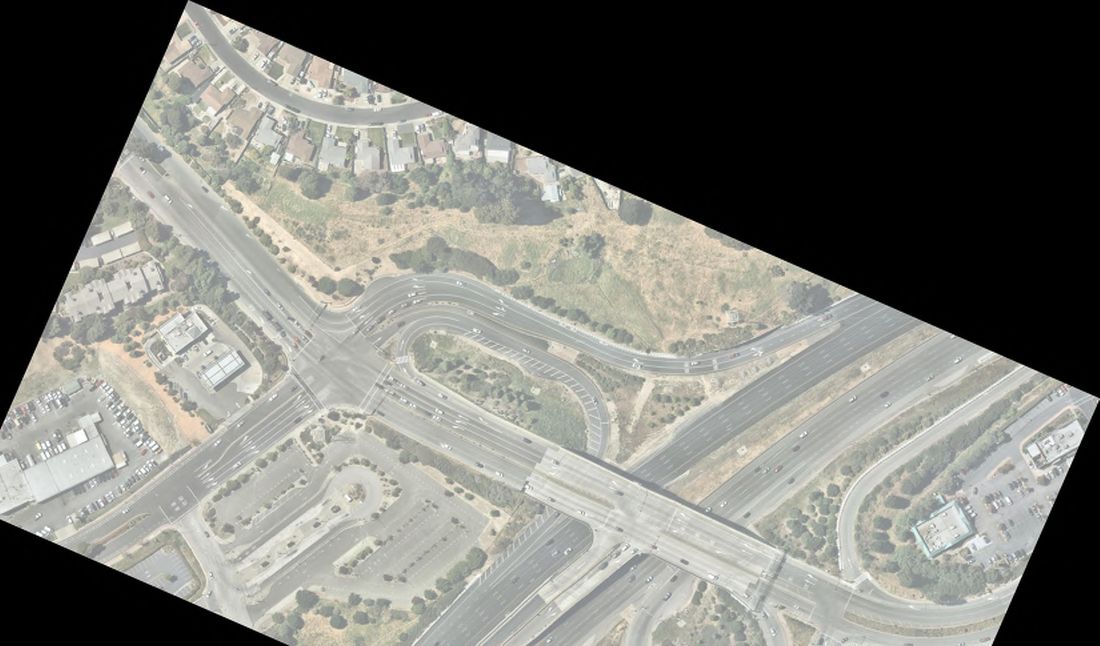
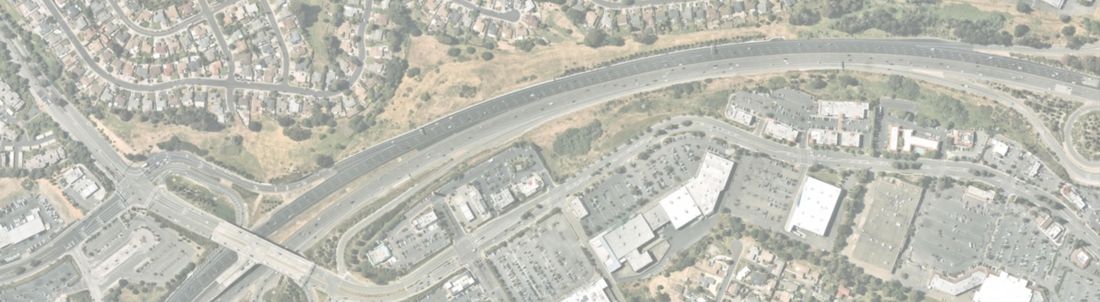

INTERSTATE INTERSTATE MATCHLINE SEE BELOW MATCHLINE SEE ABOVE MATCHLINE SEE NEXT SHEET
WWCTAC EXPRESS BUS IMPLEMENTATION PLAN
1-80 BUS ON SHOULDER - PROJECT TL1
JANUARY 2020
BUS USES AUXILIARY LANE
BUS ON SHOULDER
LEGEND:
1 EXISTING 10' SHOULDER MAY NEED TO BE WIDENED WITHIN
LIMITS OF BUS ON SHOULDER OPERATION.
2 POTENTIAL RESTRIPING AND LANE WIDTH REDUCTION ON
BRIDGE STRUCTURE TO BE REQUIRED.
NOTE:
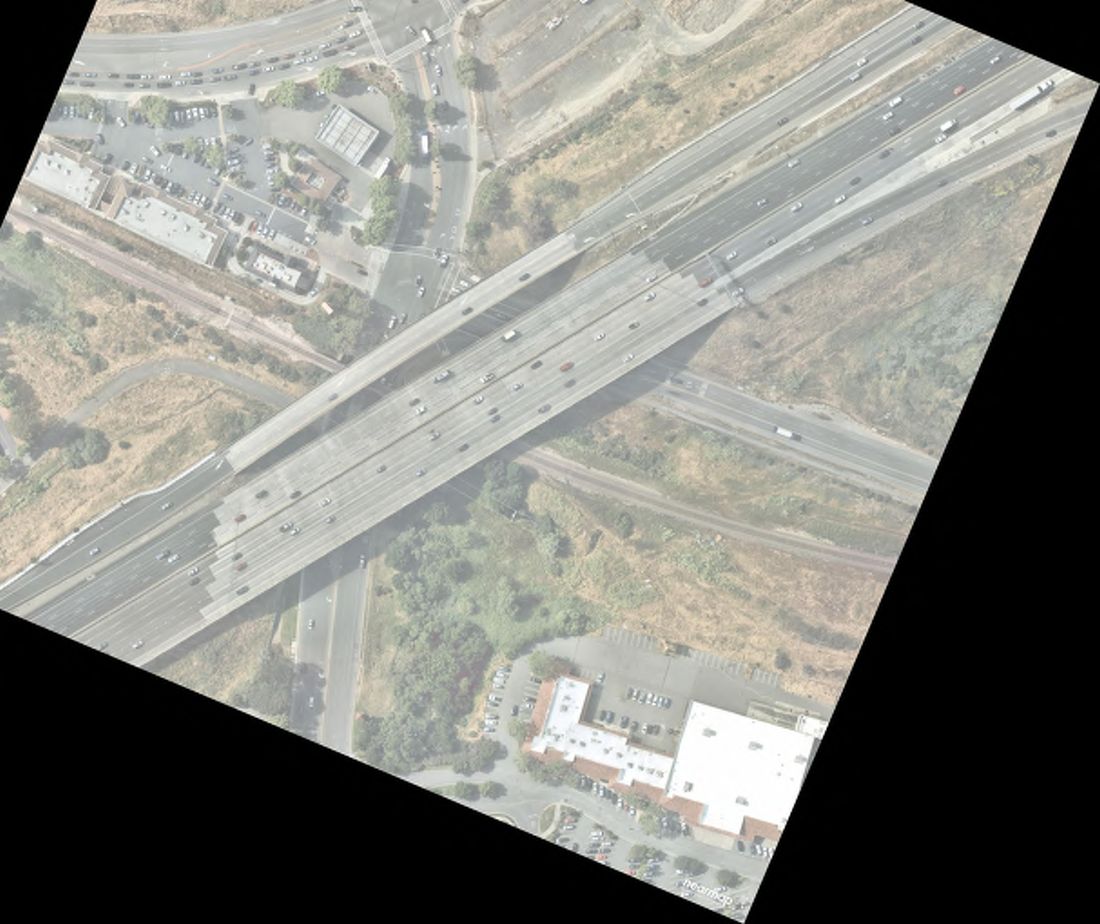
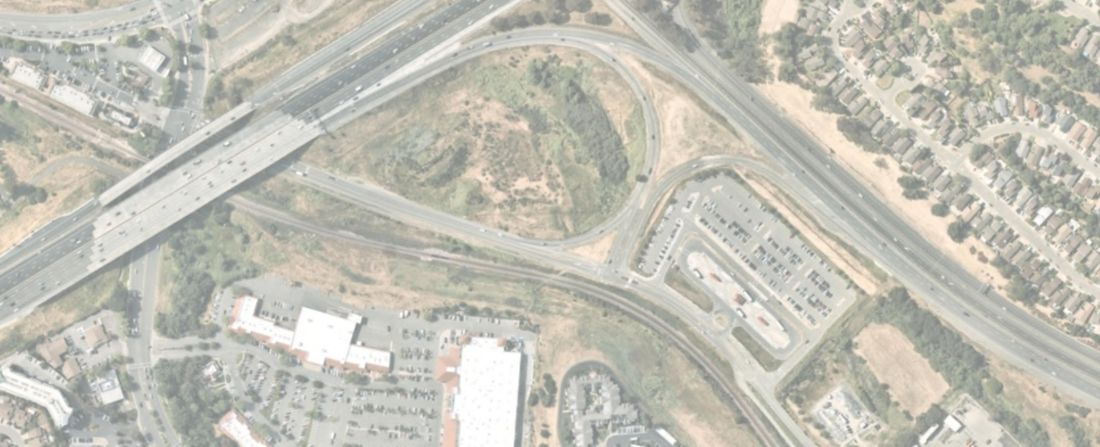
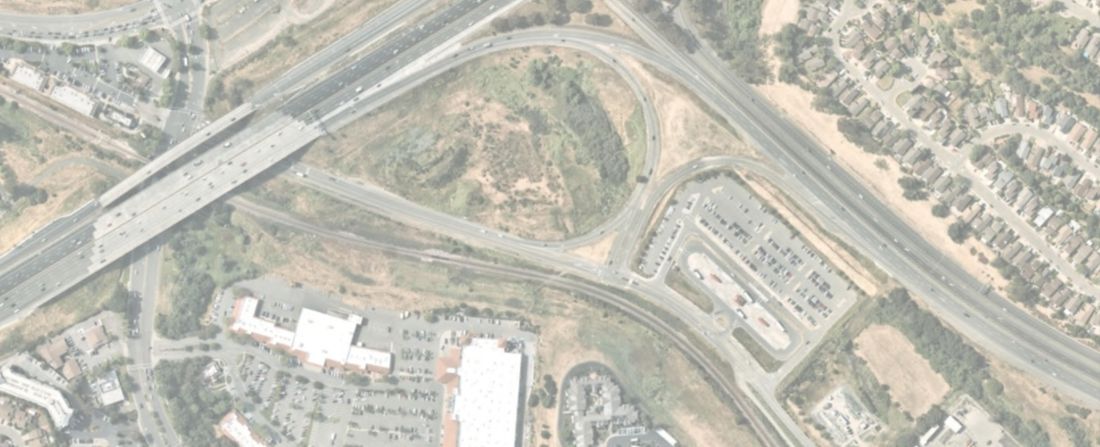


INTERSTATE MATCHLINE SEE PREVIOUS SHEET
WCCTAC EXPRESS BUS IMPLEMENTATION PLAN
1-80 BUS ON SHOULDER - PROJECT TL1
JANUARY 2020
MATCHLINE SEE BELOW MATCHLINE SEE ABOVE
BUS USES AUXILIARY LANE
BUS ON SHOULDER
LEGEND:
TYPICAL TRANSITION DETAILS AT ON/OFF-RAMP
TYPE 1: SHOULDER TO ON-RAMP TO SHOULDER
TYPE 2:SHOULDER TO AUXILIARY LANE / AUXILIARY LANE TO SHOULDER
1 EXISTING 10' SHOULDER MAY NEED TO BE WIDENED WITHIN
LIMITS OF BUS ON SHOULDER OPERATION.
2 POTENTIAL RESTRIPING AND LANE WIDTH REDUCTION ON
BRIDGE STRUCTURES TO BE REQUIRED.
NOTE:
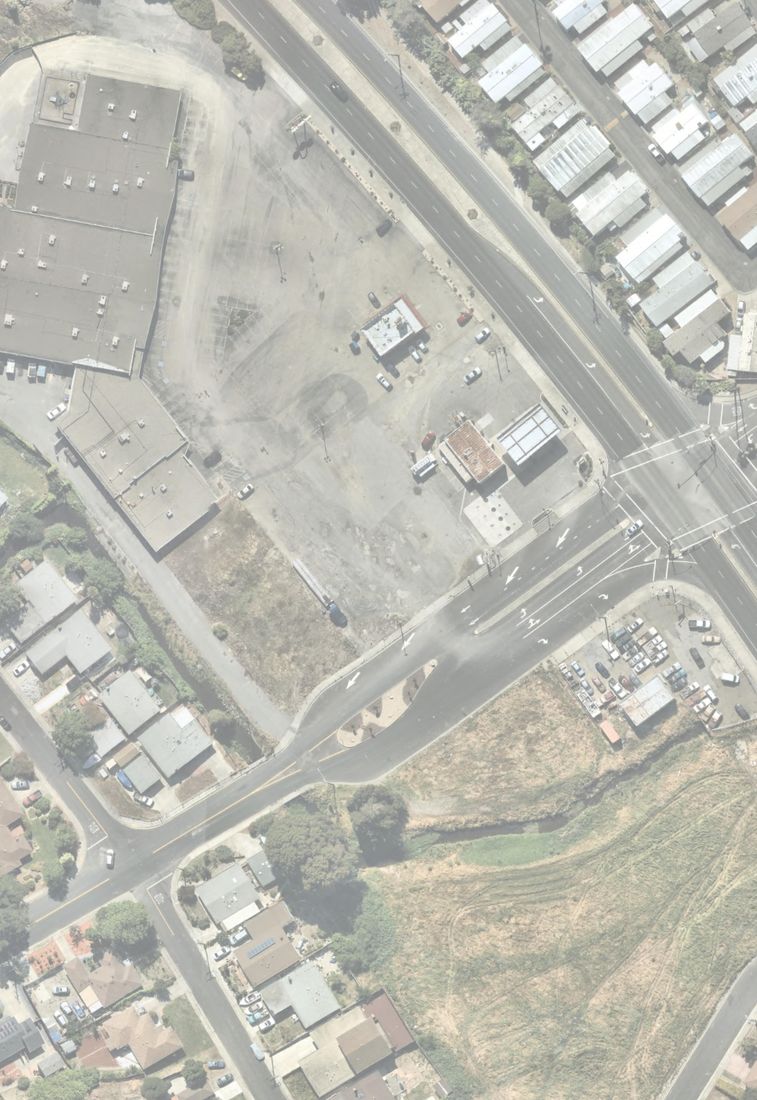
WWCTAC EXPRESS BUS IMPLEMENTATION PLAN
TARA HILLS DRIVE MOBILITY HUB OPTION 1 - PROJECT MH1
JANUARY 2020
WWCTAC EXPRESS BUS IMPLEMENTATION PLAN
TARA HILLS DRIVE MOBILITY HUB OPTION 2 - PROJECT MH2
JANUARY 2020
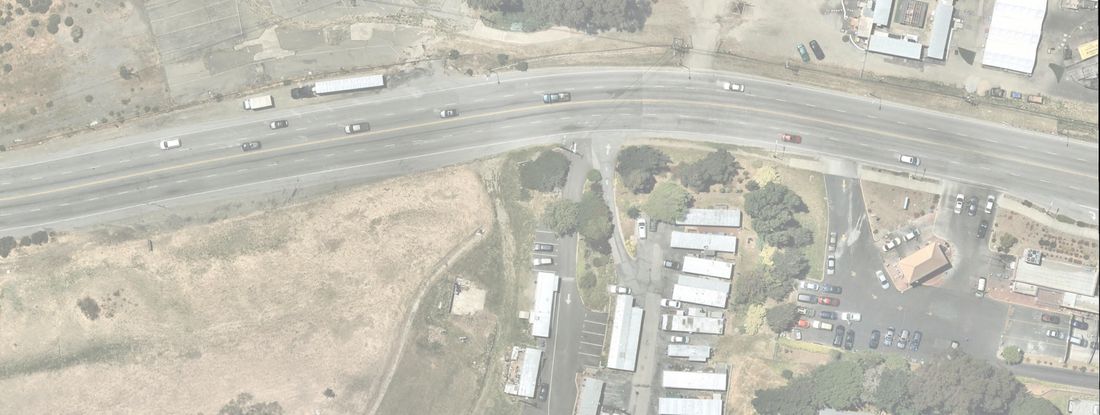
INTERSTATE
WWCTAC EXPRESS BUS IMPLEMENTATION PLAN
SAN PABLO DAM ROAD MOBILITY HUB - PROJECT MH3
JANUARY 2020
WCCTAC EXPRESS BUS IMPLEMENTATION PLAN
BISSELL AVENUE MOBILITY HUB - PROJECT MH4
JANUARY 2020
INTERSTATE
WCCTAC EXPRESS BUS IMPLEMENTATION PLAN
WRIGHT AVENUE MOBILITY HUB - PROJECT MH5
JANUARY 2020
MATCH LINE - SEE NEXT SHEET
INTERSTATE
WCCTAC EXPRESS BUS IMPLEMENTATION PLAN
WRIGHT AVENUE MOBILITY HUB - PROJECT MH5
JANUARY 2020
MATCH LINE - SEE PREVIOUS SHEET
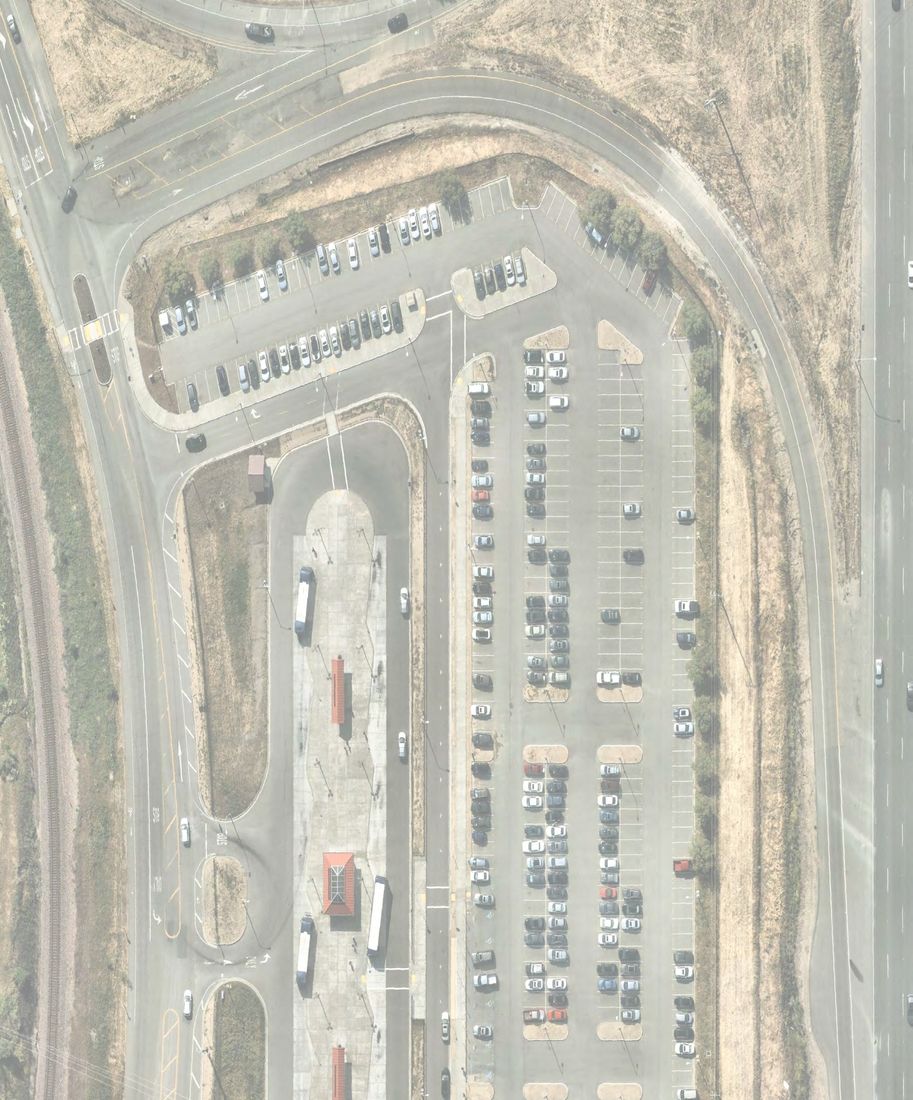

File Path: K:\OAK_TPTO\097091001 - WCCTAC Express Bus Implementation Plan - AJD\Design\sheets\HTC-1.dwg Plot Date: 10/15/2019 3:43 PM
WCCTAC EXPRESS BUS IMPLEMENTATION
HERCULES TRANSIT CENTER
PROJECT TC1
10/15/2019 - Rev

Original PDF, page 144
File Path: K:\OAK_TPTO\097091001 - WCCTAC Express Bus Implementation Plan - AJD\Design\sheets\RPTC-1.dwg Plot Date: 12/20/2019 10:04 AM
WCCTAC EXPRESS BUS IMPLEMENTATION
RICHMOND PARKWAY TRANSIT CENTER
PROJECT TC2
10/15/2019 - Rev
RICHMOND PARKWAY
PARKING STRUCTURE
File Path: K:\OAK_TPTO\097091001 - WCCTAC Express Bus Implementation Plan - AJD\Design\sheets\RPTC-1.dwg Plot Date: 12/20/2019 10:45 AM
WCCTAC EXPRESS BUS IMPLEMENTATION
RICHMOND PARKWAY TRANSIT CENTER
CONCEPT NO.
WCCTAC EXPRESS BUS IMPLEMENTATION
RICHMOND PARKWAY TRANSIT CENTER
RICHMOND PKWY BUS STOP DETAIL
® ®
WEST CONTRA COSTA COUNTY
EXPRESS BUS IMPLEMENTATION PLAN F.
BICYCLE/PEDESTRIAN
GAPS ANALYSIS
Final Plan | February 2020
® ®
WEST CONTRA COSTA COUNTY
EXPRESS BUS IMPLEMENTATION PLAN Final Plan | February 2020
F. BICYCLE/PEDESTRIAN GAPS ANALYSIS
Existing pedestrian and bicycle facilities within 0.25 miles of all proposed stops were analyzed to determine whether there were infrastructure gaps that would prevent easy and safe access by foot for by bicycle. To address all existing gaps recommendations were made that either prioritize already-planned improvements or suggest improvements not already planned.
Pedestrian Access Gaps and Proposed Improvements
Every transit user begins and end her trip as a pedestrian. For this reason, it is particularly important to ensure that transit users are not met with unnecessary challenges when traveling between home or work and their bus stop. Common barriers to pedestrian travel fall roughly into two groups: (1) gaps in the sidewalk network and (2) challenges to crossing streets.
Sidewalk network gaps can include discontinuities in the sidewalk, missing curb ramps, concrete damaged by lack of maintenance or tree roots, or physical infrastructure (such as signposts or utility poles) obstructing the path of travel. Street crossing gaps can include unsignalized crosswalks across more than two lanes of traffic, auto slip lanes, and long distances between signalized crossings. Graphics of all identified pedestrian access gaps are included in this appendix.
Hercules
- Several roadway segments on San Pablo Avenue or near it lack a sidewalk on one or both sides of the street, specifically near Hercules
Transit Center.
Pinole
- Several roadway segments on San Pablo Avenue or near it lack a sidewalk on one or both sides of the street.
- The segment of San Pablo Avenue that passes through Pinole has a number of unprotected crosswalks, requiring pedestrians to cross an
80’, four-lane roadway.
Unincorporated Contra Costa County
- Several roadway segments on San Pablo Avenue or near it lack a sidewalk on one or both sides of the street.
San Pablo
- Many of the intersections of major streets within the bus stop walksheds (e.g. Broadway, San Pablo Avenue, Rumrill Boulevard, Brookside
Drive) feature right-turn slip lanes.
- A number of the intersections between 23rd Street and cross streets south of Market Avenue feature unprotected crosswalks, requiring pedestrians to cross a 64’, four-lane roadway.
Richmond
- Numerous sidewalks in Richmond lack curb ramps at intersection, hindering the ability of wheelchair users or other mobility-impaired individuals to travel between home and bus stops
- Macdonald Avenue, 23rd Street, and Barrett Avenue all have many striped but unprotected crosswalks across wide expanses of roadway (four lanes in the case of Macdonald Avenue and 23rd Street, and three lanes in the case of Barrett Avenue)
Berkeley
- There are a number of striped but unprotected crosswalks across wide arterials in the bus stop walkshed on University Avenue, Martin
Luther King Way, and Shattuck Avenue.
Emeryville
- Several streets within the bus stop walkshed lack sidewalks, forcing pedestrians to either walk in the roadway or cross the street.
Oakland
- There are a number of striped but unprotected crosswalks across wide arterials in the service walkshed on San Pablo Avenue, Telegraph
Avenue, and Piedmont Avenue.
- Several right-turn slip lanes exist between surface street and I-880 ramps, presenting an impediment to pedestrian safety.
Bicycle Access Gaps and Proposed Improvements
Bicycles can be a crucial part of first/last mile connections between home or work and a transit connection. By using a bicycle, riders who do not have a bus stop directly outside their home or office can turn what would have been a 20-minute walk into a 5-minute bike ride, making a transit and bike ride competitive with driving a car.
However, much of the time there is insufficient bicycle infrastructure to assure potential riders of their safety during that short trip. At best, riders must travel adjacent to fast-moving traffic with only a lane delineated by paint. At worst, riders are expected to travel in mixed traveling, contending directly with drivers for space on the roadway. In situations like this, only the most confident riders will opt to travel by bicycle.
By providing physical separation on high-volume or high-speed streets and traffic calming treatments on lower-volume streets, traveling by bicycle can be a viable mode for a much wider range of potential transit riders.
As part of this project, existing and currently planned bicycle infrastructure were analyzed to recommend new projects and prioritize currently- planned projects that would be particularly supportive of the proposed express bus service. It should be noted that, given the lack of either bikeshare or secure bicycle parking facilities in the West County portion of the proposed service area, it is more likely that express bus riders will employ a bike on the destination end of their trip than on the origin end. It is encouraged that shared micro-mobility services and bike parking be expanded in West County. These features are included in mobility hubs proposed as part of this project, but a complete network of bicycle services and facilities is needed in order for them to be effective. Graphics of all identified bicycle access gaps are included in this appendix.
Original PDF, page 148
Richmond Parkway Transit Center Proposed Tara Hills Dr Mobility Hub - Option 2 Proposed Tara Hills Dr Mobility Hub - Option 1 Hercules Transit Center San Pablo Ave/Shamrock Dr San Pablo Ave/Del Monte Dr San Pablo Ave/Pinole Shores Dr San Pablo Ave/Tara Hills Dr Richmond Pkwy/Bella Vista Apartments Pinole Valley Rd Richmond Pkwy Blume Dr San Pablo Ave Manor Rd Appian Way Tsushima St Hilltop Dr Tara Hills Dr Salida Way Hilltop Dr San Pablo Ave Appian Way Pinole Valley Rd Shawn Dr Fitzgerald Dr Willow Ave Sycamore Ave Refugio Valley Rd Shamrock Dr Redwood Rd Tara Hills Dr Willow Ave Atlas Rd Richmond Pkwy §¨¦ ¬« Pinole Richmond Hercules Sycamore Ave John Muir Pkwy Hercules Ave Tennent Ave Oak Ridge Rd Pinon Ave Sunnyview Dr Nob Hill Ave Marlesta Rd Belmont Way O’Connor Dr Denise Dr Limerick Rd Christine Dr Park Central St Rachel Rd Del Monte Dr Pinole Shores Dr Bay View Farm Ave Pinole Creek Trail Bay Trail Upgrade Planned Class II to Class IV Upgrade Planned Class II to Class IV Upgrade Existing/Planned Class II to Class IV Provide bike/ped connection between Flannery Rd and Richmond Pkwy Provide Class II Upgrade Existing Class II to Class IV Provide Class IV to close gap Provide Class II Provide Class II Provide Class III bike route Provide Class III bike route Provide Class IV with Class III over narrow bridge Provide Class I with connection to Bay Trail Provide Class I to close gap Provide Class III Provide Class III bike boulevard Provide connection for bikes between Belmont Way and San Pablo Ave Provide Class III 0.5 0.25
Miles±
Legend
Existing Bikeways Proposed Stops Planned Bikeways Recommendations Class I Path Class II Bike Lane Northbound Stop BART Alignment BART Station Southbound Stop Class III Boulevard Class III Bike Route Class IV Protected Bike Lane Class I Path Class II Lane Class III Blvd Class III Route Class IV Protected Bike Lane Bikeways Supportive of Express Service Class I Path Class II Lane Class III Blvd Class III Route Class IV Protected Bike Lane Transit Center/Mobility Hub CCJPA Alignment % New Connection New Bikeway Recommended class described in callout boxes
Bicycle Network Gaps - Hercules/Pinole/Richmond |
Sources: CCTA Countywide Bike Plan
Final Report
® ®
WEST CONTRA COSTA COUNTY
EXPRESS BUS IMPLEMENTATION PLAN
Original PDF, page 149
23rd St/Dover Ave
San Pablo Ave/Stone St
23rd St/Rheem Ave
13th St/Rheem Ave
23rd St/Garvin Ave
Rumrill Blvd/Rd
23rd St/Preble Ave
Broadway/Rumrill Blvd
Harbour Way/Maine Ave
Macdonald Ave/37th St
Rumrill Blvd/Market Ave
Harbour Way/Roosevelt Ave
Harbour Way/Macdonald Ave
Macdonald Ave/27th St/Broadway
Barrett Ave Cutting Blvd 7th St Harbour Way 37TH ST 18th St Shane Dr 2nd St Emeric Ave 17th St 24TH ST Maine Ave Garvin Ave Brookside Dr El Portal Dr San Pablo Ave Market Ave Costa Ave S 23Rd St 19TH ST Goodrick Ave South 2Nd St Wall Ave Lancaster Dr Kearney St Birmingham Dr Hoffman Blvd 38th St Amador St Mc Bryde Ave Garrard Blvd 6th St Solano Ave Marina Bay Pkwy Spring Street Parr Blvd Fred Jackson Way Cerrito Ave San Pablo Ave San Pablo Ave 24th St Garvin Ave 23rd St Barrett Ave Bissell Ave 34th St 2nd St 3rd St San Pablo Ave Ohio Ave Market Ave Marina Way Cutting Blvd 29th St Giant Rd 30th St Rumrill Blvd 37th St El Portal Dr Roosevelt Ave Macdonald Ave McBryde Ave Parr Blvd Center Ave Maricopa Ave Church Ln 22nd St Road 20 Chesley Ave Rivers St Esmond Ave Sanford Ave Vale Rd Broadway Ave Richmond Pkwy Wilson Ave Richmond Pkwy Esmond Ave Richmond Pkwy 39th St Carlson Blvd §¨¦ §¨¦
Richmond
San Pablo
0.25 0.5 0.125 Miles ± Contra Costa College 14th St 18th St Dover Ave Dunn Ave Coalinga Ave Ripley Ave 27th St Macdonlad Ave Maine Ave Potential Bissell Ave Mobility Hub Provide Class III and open connection for bikes at Rumrill Provide Class II Provide Class III Provide Class III Bike Route Upgrade Planned Class II/III to Class IV over train tracks Upgrade Planned Class III to Class IV over train tracks Upgrade Planned Class II to Class IV on overpass Upgrade Existing Class II to Class IV Upgrade Planned Class III to Class IV Upgrade Planned Class II to Class IV Upgrade Planned Class III to Class II Provide Class III Bike Boulevard Provide Class III Bike Boulevard Provide Class III Bike Boulevard Provide Class III Upgrade Planned Class III to Class IV under freeway Upgrade Planned Class III to Class II with road diet Planned Class I cut-through at school
Legend
Existing Bikeways Proposed Stops Planned Bikeways Recommendations Class I Path Class II Bike Lane Northbound Stop BART Alignment BART Station Southbound Stop Class III Boulevard Class III Bike Route Class IV Protected Bike Lane Class I Path Class II Lane Class III Blvd Class III Route Class IV Protected Bike Lane Bikeways Supportive of Express Service Class I Path Class II Lane Class III Blvd Class III Route Class IV Protected Bike Lane New Bikeway Recommended class described in callout boxes New Connection Transit Center/Mobility Hub CCJPA Alignment %
Bicycle Network Gaps - San Pablo/Richmond |
Sources: CCTA Countywide Bike Plan
Final Report
® ®
WEST CONTRA COSTA COUNTY
EXPRESS BUS IMPLEMENTATION PLAN
Original PDF, page 150
% % San Francisco Bay
Gilman St/Sixth St
Sixth St/Virginia St
University Ave/MLK Way
Shattuck Ave/Center St
Shattuck Ave/Dwight Way
Shattuck Ave/Durant Ave
University Ave/Sixth St
University Ave/San Pablo Ave
6th St Grant St Derby St San Pablo Ave Bay Trail Addison St Hopkins St Milvia St Channing Way Bancroft Way Spruce St Oxford St Kains Ave Euclid Ave Dana St Hearst Ave 4th St Gayley Rd Parker St Acton St Claremont Ave Peralta Ave Monterey Ave Fulton St Josephine St Santa Fe Ave Sonoma Ave Piedmont Ave Cedar St Curtis St Bolivar Dr Delaware St The Alameda Ohlone Greenway Cedar St 6th St Rose St Dwight Way University Ave Gilman St Sacramento St 7th St Hopkins St College Ave Telegraph Ave Bancroft Way Ashby Ave Martin Luther King Jr Way Spruce St Adeline St College Ext Bancroft Way San Pablo Ave Shattuck Ave §¨¦ §¨¦
Berkeley
Albany
Camelia St 4th St 6th St Blake St 0.25 0.5 0.125
Miles±
Provide Class III Bike Boulevard Provide Class III Bike Boulevard Provide Class III Bike Boulevard
Legend
Existing Bikeways Proposed Stops Planned Bikeways Recommendations Class I Path Class II Bike Lane Northbound Stop BART Alignment BART Station Southbound Stop Class III Boulevard Class III Bike Route Class IV Protected Bike Lane Class I Path Class II Lane Class III Blvd Class III Route Class IV Protected Bike Lane Bikeways Supportive of Express Service Class I Path Class II Lane Class III Blvd Class III Route Class IV Protected Bike Lane New Bikeway Recommended class described in callout boxes New Connection Transit Center/Mobility Hub CCJPA Alignment %
Bicycle Network Gaps - Berkeley |
Sources: Berkeley Bicycle Plan
Final Report
® ®
WEST CONTRA COSTA COUNTY
EXPRESS BUS IMPLEMENTATION PLAN
Original PDF, page 151
% %
Hollis St/53rd St
Hollis St/59th St
Hollis St/65th St
40th St/Hollis St
45th St/Hollis St
40th St/Adeline St
Broadway/W MacArthur Blvd
40th St/MacArthur BART Access Rd
West St Telegraph Ave 40th St 55th St Webster St Shattuck Ave 51st St 32nd St College Ave Claremont Ave 41st St Alcatraz Ave Piedmont Ave Howe St Shafter Ave Genoa St Chabot Rd Adeline St Colby St Grand Ave 65th St 48th St Hollis St Keith Ave 54th St Beach St Forest St California St Pleasant Valley Ave Martin Luther King Jr Wy Burma Rd Bay Bridge Connector Path Harrison St Lawton Ave Oakland Ave Mandela Pkwy Moss Ave Linda Ave San Pablo Ave Maritime St Path Cavour St Miles Ave 53rd St Admiral Toney Wy Wood St 52nd St Shellmound St Golden Gate Ave 66th St Horton St 61st St Bayo Vista Ave Gaskill St Vicente Wy Adeline St Adeline St 32nd St Grand Ave 40th St Adeline St Market St Alcatraz Ave Broadway MacArthur Blvd 51st St College Ave Shattuck Ave Claremont Ave Piedmont Ave Telegraph Ave Chabot Rd Grand Ave Mandela Pkwy Ashby Ave 32nd St Martin Luther King Jr Way Broadway Ter Moraga Ave Pleasant Valley Ave Peralta St Sacramento St Lower Grand Ave Frontage Rd 35th St 36th St Patton St Stanford Ave San Pablo Ave Powell St §¨¦ §¨¦ §¨¦ §¨¦ §¨¦ ¬«
Oakland
Emeryville
Berkeley
Piedmont
Upgrade Existing Class II/III to Class IV Upgrade Existing Class II to Class IV Upgrade Existing Class II to Class IV Upgrade Existing Class II to Class IV Provide Class III Bike Boulevard Provide planned connection to Bay Trail Upgrade Existing Class II to Class IV Upgrade Existing Class II to Class IV Provide Class II with road diet Upgrade Planned Class II to Class IV and close gap to Christie Ave Upgrade Existing Class II to Class IV Upgrade Planned Class II to Class IV Upgrade Existing Class II to Class IV past hospital and under freeway Provide Class II to close gap Upgrade Existing Class II to Class IV under freeway 65th St Overland Ave Hollis St 59th St San Francisco Bay 0.25 0.5 0.125
Miles±
Legend
Existing Bikeways Proposed Stops Planned Bikeways* Recommendations Class I Path Class II Bike Lane Northbound Stop BART Alignment BART Station Southbound Stop Class III Boulevard Class III Bike Route Class IV Protected Bike Lane Class I Path Class II Lane Class III Blvd Class III Route Class IV Protected Bike Lane Bikeways Supportive of Express Service Class I Path Class II Lane Class III Blvd Class III Route Class IV Protected Bike Lane New Bikeway Recommended class described in callout boxes New Connection Transit Center/Mobility Hub CCJPA Alignment %
Bicycle Network Gaps - Emeryville/Oakland |
Sources: Berkeley Bicycle Plan, Emeryville Pedestrian and Bicycle Plan, Let’s Bike Oakland 2019 Bike Plan
Final Report
® ®
WEST CONTRA COSTA COUNTY
EXPRESS BUS IMPLEMENTATION PLAN
Original PDF, page 152
% % % %
Broadway/3rd St
2nd St/Washington St
Broadway/7th St
Broadway/20th St
Broadway/13th St
14th St 14th St 7th St Grand Ave Grand Ave 9th St 2nd St Oak St 3rd St Peralta St Madison St E 12th St Franklin St Franklin St E 15th St 20th St 4th Ave 10th St 11th St 27th St E 10th St Lakeshore Ave Lake Merritt Path Harrison St 5th Ave 7th Ave 17th St Martin Luther King Jr Wy Athol Ave 4th St Jackson St Posey Tube Path Bellevue Ave Washington St West St E 18th St 3rd Ave Park Blvd Lake Merritt Blvd Santa Clara Ave E 19th St 16th St Fallon St Bay Place Wayne Ave Brush St El Embarcadero Martin Luther King Jr Wy 8th St Adeline St Lake Merritt Path Broadway Broadway 14th St Adeline St Harrison St Brush St Castro St E 8th St Market St Webster St Webster St 5th St Peralta St Clay St 12th St 13th St Union St Mandela Pkwy Telegraph Ave Foothill Blvd Embarcadero San Pablo Ave e A e r o h s e k a International Blvd 7th St Webster St Tube 1st Ave MacArthur Blvd Lakeside Dr 20th St 24th St Middle Harbor Rd Northgate Ave Oak St 18th St 8th St 8th St §¨¦ §¨¦ §¨¦ §¨¦
Oakland
Alameda
3rd St 5th St Oakland Estuary Lake Merritt 0.25 0.5 0.125
Miles±
Legend
Existing Bikeways Proposed Stops Planned Bikeways* Recommendations Class I Path Class II Bike Lane Northbound Stop BART Alignment BART Station Southbound Stop Class III Boulevard Class III Bike Route Class IV Protected Bike Lane Class I Path Class II Lane Class III Blvd Class III Route Class IV Protected Bike Lane Bikeways Supportive of Express Service Class I Path Class II Lane Class III Blvd Class III Route Class IV Protected Bike Lane Transit Center/Mobility Hub CCJPA Alignment % New Connection New Bikeway Recommended class described in callout boxes
Bicycle Network Gaps - Oakland |
Sources: Let’s Bike Oakland 2019 Bike Plan
Final Report
® ®
WEST CONTRA COSTA COUNTY
EXPRESS BUS IMPLEMENTATION PLAN
Original PDF, page 153
Proposed Wright Avenue Mobility Hub Cutting Blvd Marina Way Harbour Way Marina Way Marina Bay Pkwy Harbour Way Wright Ave Portrero Ave Hoffman Blvd Hoffman Blvd Regatta Blvd Meeker Ave S 19th St 23rd St §¨¦
Richmond
0.1 0.2 0.05
Miles±
Provide Class II to Class IV over bridge Provide Class II to Class IV over bridge Provide Class II to Class IV over bridge Provide improved crossing at freeway on/off-ramps Provide improved crossing at freeway on-ramp Provide improved crossing at freeway on/off-ramps Upgrade planned Class II to Class IV with parking removal Upgrade planned Class II to Class IV with parking removal
Legend
Existing Bikeways Proposed Stops Planned Bikeways Recommendations Class I Path Class II Bike Lane Northbound Stop BART Alignment BART Station Southbound Stop Class III Boulevard Class III Bike Route Class IV Protected Bike Lane Class I Path Class II Lane Class III Blvd Class III Route Class IV Protected Bike Lane Bikeways Supportive of Express Service Class I Path Class II Lane Class III Blvd Class III Route Class IV Protected Bike Lane New Bikeway Recommended class described in callout boxes New Connection Transit Center/Mobility Hub CCJPA Alignment %
Bicycle Network Gaps - Wright Avenue Park & Ride | Final Report
Sources: CCTA Countywide Bike Plan ® ®
WEST CONTRA COSTA COUNTY
EXPRESS BUS IMPLEMENTATION PLAN
Original PDF, page 154
San Pablo Ave/Shamrock Dr San Pablo Ave/Del Monte Dr San Pablo Ave/Pinole Shores Dr San Pablo Ave/Tara Hills Dr Richmond Pkwy/Bella Vista Apartments Stop #16 SB Stop #14 SB Stop #12 SB Stop #10 SB Stop #18 SB Stop #9 NB Stop #15 NB Stop #11 NB Stop #13 NB Stop #17 NB Richmond Pkwy Shawn Dr Blume Dr Appian Way Atlas Rd Shamrock Dr Pinole Valley Rd Manor Rd Hilltop Dr Tara Hills Dr Richmond Pkwy Hilltop Dr Hilltop Dr SAN PABLO AVE TARA HILLS SHAWN SARAH MARLESTA KELVIN SHEA SHAMROCK BLUME FITZGERALD KEVIN HENRY CYPRESS MANOR PINOLE VALLEY DOLAN RIM ALLVIEW ATLAS TENNENT KENNEY LIMERICK MAHAN RANCHO FLANNERY 4TH KAY MADELINE BRIAN CANYON MITCHELL PINON LETTIA LAKESIDE KILDARE SUNNYVIEW DENISE MONTALVIN O HARTE HILLTOP LINDA MANN CHRISTINE SHERYL HOKE KILLARNEY 5TH CORNELIUS BONNIE GALWAY DEL MONTE RACHEL DRAPER KILKENNY SALIDA LYNN HEATHER MICHELE 3RD OAK RIDGE AMEND BELFAIR 2ND KAREN AVIS BALMORE HIGHLANDS JOVITA ST ANDREWS NOB HILL JOHN FRANCES QUINAN RIDGECREST SARGENT SKY LINE ROSEDALE ODONNELL SMITH HILLVIEW LOMA LINDA PARKRIDGE LINDELL BANTRY KITTERY BAY VIEW FARM DUBLIN BAY FERN HILLTOP MALL ALVAREZ GREENWICH JENNIFER REBECCA ROBLE PACIFIC TESORO NANCY MARIONOLA MEADOWLARK PATRICK MAGEE STALLION PRIMROSE ARDMORE WILDFLOWER MC DONALD PINE LAUREL RINCON ANDREW HANLEY ROCK ROSE KAVANAUGH DOWNER DURSEY KLOSE SELMI GROVE JONES SUMMIT AUTO PLAZA PINOLE SHORES ROGERS FULTON CLUB EL TORO PARK CENTRAL DELMORE McMORROW SHANNON FOOTHILL MICHAEL RATON BELMONT IDLEWOOD BETTY BANION ADAMS SOUTHWARD RESEARCH GALBRETH LEWIS OWENS SPENCER BROADMORE GLEN BLACKWOOD EBSEN PAGE SAMUEL WALTER DOHRMAN DANNY BUENA VISTA PEACH CRESTVIEW RISING GLEN PARK ALBERDAN BIRCH SULLIVAN FAIRWAY DUNCAN O CONNER ENCINA BARKLEY HACIENDA JASMINE JUANITA HEMLEB NORTH RIDGE RANCHO VISTA FRANCISCA EIRE CORTE CRUZ LEA BLUE JAY NEAL KILCREASE DOOLIN BLACKBERRY STONEGLEN DALESSI OAK HILL BLACK OAK BUCKEYE TRALEE GREENFIELD SIERRA RIDGE CRESTWOOD APPIAN KNOLL ANTONIA WILDE KELLEY ONEIL BRANDT BOYLE TECHNOLOGY ROSE SALEM ASHBROOK KENMARE ZANDRA REGENTS WILLOW OAK BRENDA MAYO BAYSIDE BLUE OAK KERRY VALERIE OAKMONT SARAH SAN PABLO NOB HILL HENRY HILLTOP MARLESTA OVERLOOK Richmond Pkwy Transit Center Proposed Tara Hills Dr Mobility Hub (Option 2) Proposed Tara Hills Dr Mobility Hub (Option 1) §¨¦
Pinole
Richmond
0.25 0.5 0.125
Miles±
Legend
Proposed Stops Proposed Northbound Stops (Odd #) Proposed Southbound Stops (Even #) Transit Centers and Mobility Hubs 1/4 Mile Walkshed Pedestrian Gaps Unprotected Crossing Missing Curb Ramp Slip Lane Crossing Missing Sidewalk
Pedestrian Access Gaps - Pinole/Richmond | Final Report
® ®
WEST CONTRA COSTA COUNTY
EXPRESS BUS IMPLEMENTATION PLAN
Original PDF, page 155
23rd St/Dover Ave 23rd St/Rheem Ave 13th St/Rheem Ave Rumrill Blvd/Rd 20 Broadway/Rumrill Blvd San Pablo Ave/Stone St Rumrill Blvd/Market Ave Stop #20 SB Stop #36 SB Stop #34 SB Stop #22 SB Stop #24 SB Stop #38 SB Stop #26 SB Stop #19 NB Stop #35 NB Stop #33 NB Stop #21 NB Stop #23 NB Stop #37 NB Stop #25 NB 23rd St 3rd St San Pablo Ave Market Ave Richmond Pkwy Rumrill Blvd El Portal Dr Giant Rd McBryde Ave Parr Blvd 29th St Maricopa Ave Church Ln Chesley Ave 1st St Road 20 San Pablo Dam Rd Sanford Ave Rivers St 34th St Broadway Ave Vale Rd 13th St Brookside Dr McBryde Ave Road 20 Richmond Pkwy I 80 Parr 3Rd Market 23Rd El Portal Dover Brookside Lowell 21St Vale Giant Pine 1St 6Th Andrade Dunn Emeric 5Th 4Th Amador Mc Bryde Costa Chesley Maricopa Sutter Alamo Moyers Rheem 29Th Rumrill Gertrude Silver Humphrey 14Th Shane 28Th Tulare San Pablo 34Th Sanford Hellings Duboce Rivers York 32Nd Willard Bush Coalinga San Pablo Dam 17Th Brook Pittsburg Ridge Lake Rollingwood Jo Ann Willow California Broadway 22Nd Alpine Church Road 20 Hillcrest Truman Richmond 15Th Tyler Filbert Castro Moran Yuba 18Th Marin 24Th Oxford 25Th Verde Arundel Devon Garden Tract Hensley 26Th Barnard Vernon Kern Wilcox Hayes Goodrick 36Th Chevy Manor Parker Kelsey Duke Powell 20Th Kelley Da Villa Van Ness Loyola Radiant Mission Bell 12Th 13Th Arlington Mason Wilart Jade Stone Mills Avon Kirk Folsom 11Th Cherry Fordham 19Th Bayo Vista Battery Del Camino Trenton Greenwood Morrow Leo 7Th Merritt 2Nd Gonzaga Pullman Bowhill Iola Villa Mac Arthur Central Barkley Brentz Manchester Alfreda Colette 16Th Giarmita Douglas Post Colin Standard Wiswall Glenn Joel Glenlock Ventura Ruby Hull Gerald Soto Montoya Ohare Fillmore Birmingham Moraga O Brien Lovegrove Canterbury Esmond Evens Mc Laughlin Bancroft Harrold Bank Factory Annapolis Casino Lassen Howard Phillip Amstan Martin Regina Niemeyer Beau Rivage Triangle Wyman Contra Costa Humboldt Riverside Malcolm Marelia Marcus Clare Valencia Victoria Clement Braga University Grove 27Th 9Th Shirley Chattleton Shasta Baywood De Carlo Esther Barbara Evergreen Joy Giaramita Miflin Natalie Coalport Alan West Ruby Winifred Frieda Alvarado Westgate Baker Sutro St Josephs Cemetery Drake Judith Regello Muir Warren Dodson Sheffield Austin Contra Costa College Golden Gate Maria Vega Grace Leeds Essex Cherrywood Bristol Pinewood Clarendon Campo Verde Marquette Marin San Pablo Post 21St 16Th 14Th Lake 27Th 26Th Gertrude 19Th 15Th 22Nd Shasta 20Th 21St Ventura Castro 17Th 18Th 13Th San Pablo 19Th Richmond 24Th Church 19Th Radiant Humboldt Bush Glenn Brookside Glenn 19Th Rheem Bush Merritt 2Nd Casino 18Th Castro Grove Niemeyer Mc Bryde Ridge Humboldt 15Th 18Th 7Th 1St 17Th San Pablo 16Th Yuba 18Th Sanford Sanford 22Nd 15Th 20Th Garden Tract 17Th 17Th 20Th Yuba 7Th Contra Costa College Proposed San Pablo Dam Rd Mobility Hub §¨¦
San Pablo
Richmond
0.25 0.5 0.125
Miles±
Legend
Proposed Stops Proposed Northbound Stops (Odd #) Proposed Southbound Stops (Even #) Transit Centers and Mobility Hubs 1/4 Mile Walkshed Pedestrian Gaps Unprotected Crossing Missing Curb Ramp Slip Lane Crossing Missing Sidewalk
Pedestrian Access Gaps - San Pablo/Richmond | Final Report
® ®
WEST CONTRA COSTA COUNTY
EXPRESS BUS IMPLEMENTATION PLAN
Original PDF, page 156
% 23rd St/Garvin Ave 23rd St/Preble Ave Harbour Way/Maine Ave Macdonald Ave/37th St Harbour Way/Roosevelt Ave Harbour Way/Macdonald Ave Macdonald Ave/27th St/Broadway Stop #46 SB Stop #32 SB Stop #44 SB Stop #28 SB Stop #30 SB Stop #40 SB Stop #42 SB Stop #39 NB Stop #27 NB Stop #29 NB Stop #31 NB Stop #43 NB Stop #45 NB Stop #41 NB Ohio Ave 2nd St 34th St Harbour Way Marina Way Garvin Ave Carlson Blvd 30th St 37th St Roosevelt Ave San Pablo Ave McBryde Ave 23rd St Center Ave Cutting Blvd 22nd St MacDonald Ave Esmond Ave Potrero Ave Barrett Ave 29th St Solano Ave Wilson Ave Wright Ave 13th St Castro St Richmond Pkwy 39th St Cutting Barrett 8Th Ohio Macdonald Nevin 33Rd 3Rd 34Th Marina Carlson 7Th 32Nd Garrard A Harbour 9Th 1St 39Th 31St 35Th 24Th 25Th 40Th Berk B 41St 28Th 22Nd 21St Canal 6Th 42Nd 5Th 27Th Wright 23Rd Clinton Ripley I 80 Wall 43Rd 20Th Lincoln 4Th Gaynor 37Th Lassen Esmond Taft Potrero Downer 2Nd Bell 18Th Ventura 11Th 26Th 12Th Bissell 10Th Espee Hensley Hoffman Fall 17Th Burbeck Turpin 16Th 47Th 45Th 30Th Spring Erlandson Overend 29Th Curry Visalia 36Th Portola 38Th Maine Stege Key 31Th South 13Th Humboldt Kearney Waller Broadway Ortho San Pablo Wendell Mathieu 15Th Chanslor Beck Pullman Marina Bay Collins Pennsylvania Lucas Grove Hinkley 19Th Amador Cerrito Virginia Mc Laughlin Murdock Civic Center 14Th 44Th Brooks 46Th Foothill Hayes Follett Euclid Hill Factory Elm Preble Triangle Richmond Boyd National Rheem Castilla Machinist Mesa Elgin Bissel Maple Presco Johnson Hershey Acacia Escuela Welcome Last Leona Cirlcle Corto Square Chesson Enterprise 17Th Clinton Pennsylvania 44Th 18Th 9Th 28Th Garvin 29Th 35Th Nevin 47Th I 580 24Th 14Th 15Th Civic Center 20Th Mc Laughlin Cutting 12Th 19Th Chanslor 8Th Clinton Virginia 13Th 31St 29Th 18Th Clinton 5Th Lassen Murdock 17Th 19Th 32Nd 1St Wendell Wright 41St Florida 13Th Esmond 20Th Potrero Wall 36Th Clinton 28Th 40Th 1St 7Th 15Th Hoffman Foothill 12Th 30Th 39Th 4Th 34Th Maine 4Th I 80 39Th 25Th I 580 11Th Ohio 9Th Spring Gaynor Bissell I 80 41St 42Nd Bissell 6Th 37Th Curry 36Th 6Th 46Th Garvin Florida 41St 45Th I 580 26Th Visalia 36Th I 80 29Th 38Th Mc Bryde 22Nd 2Nd 16Th 41St Solano 35Th Wilson Nevin 16Th 33Rd 33Rd 21St 11Th 39Th 19Th 27Th 45Th Stege 21St Cutting Hoffman 15Th 1St Bissell 34Th 12Th 37Th 43Rd 42Nd 4Th Nevin 29Th Lincoln 26Th 21St 18Th 45Th 3Rd 26Th Virginia 37Th 44Th Potrero 45Th Lucas 28Th 22Nd 35Th 15Th 31St Chanslor Pennsylvania 24Th 27Th 16Th Harbour 7Th Grant Lincoln 29Th 5Th 43Rd 13Th 3Rd 24Th 5Th 11Th Esmond 31St 25Th Proposed Bissell Ave Mobility Hub §¨¦ §¨¦
Richmond
0.25 0.5 0.125
Miles±
Legend
Proposed Stops Proposed Northbound Stops (Odd #) Proposed Southbound Stops (Even #) Transit Centers and Mobility Hubs 1/4 Mile Walkshed Pedestrian Gaps Unprotected Crossing Missing Curb Ramp Slip Lane Crossing Missing Sidewalk
Pedestrian Access Gaps - Richmond | Final Report
® ®
WEST CONTRA COSTA COUNTY
EXPRESS BUS IMPLEMENTATION PLAN
Original PDF, page 157
Proposed Wright Avenue Mobility Hub Cutting Blvd Marina Way Harbour Way Wright Ave 23rd St I 580 Cutting 8Th Potrero Marina Wright Marina Bay Regatta Hoffman 22Nd 13Th Harbour Pearson Meeker 24Th 12Th 26Th 18Th 21St 16Th 19Th 17Th 20Th 15Th 9Th Hinkley 11Th Foothill Bayfront 14Th 27Th 25Th 23Rd Beach Head Dolphin Sand Dollar Schooner Sea Shell Pierson Seadrift Baywood Corto Square 7Th 17Th I 580 27Th I 580 13Th Foothill 21St 16Th 19Th Hoffman 8Th Regatta 20Th Regatta Wright 19Th Harbour Harbour I 580 Potrero 17Th 15Th §¨¦
Richmond
0.1 0.2 0.05 Miles
Legend
Proposed Stops Proposed Northbound Stops (Odd #) Proposed Southbound Stops (Even #) Transit Centers and Mobility Hubs 1/4 Mile Walkshed Pedestrian Gaps Unsignalized Crosswalk Missing Curb Ramp Slip Lane Crossing Missing Sidewalks ±
Pedestrian Access Gaps - Wright Avenue Park & Ride | Final Report
® ®
WEST CONTRA COSTA COUNTY
EXPRESS BUS IMPLEMENTATION PLAN
Original PDF, page 158
| 0.125 0.25 S tu a rt S t elin tuck | 0.5 Miles O re g o n S t |
|---|---|
| Ad A | O re |
% % Gilman St/Sixth St Sixth St/Virginia St University Ave/MLK Way Shattuck Ave/Center St Shattuck Ave/Dwight Way Shattuck Ave/Durant Ave University Ave/Sixth St University Ave/San Pablo Ave Stop #58 SB Stop #56 SB Stop #52 SB Stop #62 SB Stop #60 SB Stop #54 SB Stop #50 SB Stop #48 SB Stop #55 NB Stop #47 NB Stop #53 NB Stop #61 NB Stop #59 NB Stop #57 NB Stop #49 NB Stop #51 NB Cedar St 6th St Rose St Dwight Way University Ave San Pablo Ave Gilman St Sacramento St 7th St Hopkins St Shattuck Ave Bancroft Way Martin Luther King Jr Way Adeline St Monterey Ave Spruce St Bancroft Way Shattuck Ave Rrx Cedar St 9Th St 7Th St 7Th St 10Th St 4Th St 6Th St 5Th St 8Th St Parker St Grant St Blake St Rose St Dwight Wy Curtis St Allston Wy Derby St 2Nd St Channing Wy San Pablo Av Ward St Delaware St Carleton St Gilman St California St Vine St Hearst Av Addison St Mc Gee Av Sacramento St Oxford St Milvia St Hopkins St Page St Arch St Jones St Alley Haste St Cornell Av Martin Luther King Jr Wy Walnut St Kains Av Spruce St Euclid Av Camelia St Bonar St Ada St Ellsworth St Stannage Av Bonita Av Durant Av Eastshore Hw Harrison St Dana St Ordway St Josephine St Peralta Av Edith St Bancroft Wy Virginia St Chestnut St Center St Browning St Talbot Av Santa Fe Av Mc Kinley Av Roosevelt Av Francisco St Spaulding Av Marina Bl Bolivar Dr 8Th West St Jefferson Av Franklin St Mabel St Scenic Av Evelyn Av Byron St Henry St Berkeley Wy Berryman St Valley St Carlotta Av Buena Av Eastshore Bl Buchanan St Acton St Hilgard Av Holly St Le Conte Av Edwards St Posen Av University Av Mathews St Jaynes St Kittredge St Neilson St Cutter Wy Masonic Av Dara Ct Albina Av Hawthorne Te Belvedere Av Dartmouth St Red Oak Av Jefferson Fulton St Ridge Rd Shattuck Av University Dr Lincoln St Northside Av Unnamed Colusa Av Mulford House Short St Hill Ct Keoncrest Dr Chaucer St Tevlin St Jackson St Eola St Juanita Wy W Crescent Dr West End Wy Shattuck Pl Evans Dimond Dr Dwight Ci Acton Cres Cowper St Mcgee Av Rose Wk Hopkins Ct Bay View Pl Walker St Bataan Av Acroft Ct Watkins Wickson Rd Cypress St Virginia Gardens Catherine Dr Poe St Comstock Ct Spring Wy Hopkins Acton St Lincoln St Ward St West St Neilson St Unnamed Shattuck Av Bonita Av Scenic Av Alley Fulton St Rose St Short St Alley Tevlin St Virginia St Acton St Lincoln St Hearst Av Kains Av Virginia St West St Henry St Shattuck Av Bancroft Wy Addison St Berkeley Wy Byron St Mc Gee Av Milvia St 8Th St Virginia St Valley St Henry St University Dr Alley Walnut St Francisco St §¨¦
Berkeley
Albany
0.25 0.5 0.125
Miles±
Legend
Proposed Stops Proposed Northbound Stops (Odd #) Proposed Southbound Stops (Even #) Transit Centers and Mobility Hubs 1/4 Mile Walkshed Pedestrian Gaps Unprotected Crossing Missing Curb Ramp Slip Lane Crossing Missing Sidewalk
Pedestrian Access Gaps - Berkeley | Final Report
® ®
WEST CONTRA COSTA COUNTY
EXPRESS BUS IMPLEMENTATION PLAN
Original PDF, page 159
% % Hollis St/53rd St Hollis St/59th St Hollis St/65th St 40th St/Hollis St 45th St/Hollis St 40th St/Adeline St Broadway/W MacArthur Blvd 40th St/MacArthur BART Stop #76 SB Stop #74 SB Stop #72 SB Stop #78 SB Stop #88 SB Stop #84 SB Stop #82 SB Stop #80 SB Stop #75 NB Stop #73 NB Stop #83 NB Stop #81 NB Stop #79 NB Stop #71 NB Stop #77 NB Stop #87 NB Adeline St San Pablo Ave Broadway Alcatraz Ave 51st St Shattuck Ave College Ave Piedmont Ave Stanford Ave Telegraph Ave Market St 32nd St Mandela Pkwy Martin Luther King Jr Way Chabot Rd Claremont Ave Hollis St Ashby Ave Pleasant Valley Ave Broadway Ter Peralta St Sacramento St Frontage Rd 35th St 36th St Yerba Buena Ave 52nd St Powell St MacArthur Blvd San Pablo Ave 40Th St I580 Wb Sr24 Eb Sr24 Wb Hollis St I580 Eb Adeline St Market St Broadway 45Th St San Pablo Av Telegraph Av West St 42Nd St Shafter Av Alcatraz Av Aileen St 34Th St 41St St Powell St Webster St Horton St Shattuck Av Stanford Av Shellmound St Howe St 51St St College Av 56Th St Piedmont Av 65Th St Park Av Claremont Av Genoa St 49Th St 59Th St Peralta St 46Th St 67Th St Vallejo St 66Th St I80 Wb Harmon St 47Th St Apgar St 64Th St Christie Av 57Th St Wood St 33Rd St 28Th St Marshall St 31St St Boyd Av 60Th St 44Th St 55Th St 32Nd St Doyle St Frontage Rd I580 Wb To I80 Wb Conn 43Rd St Chabot Rd 39Th St Gilbert St 54Th St Colby St Arlington Av Ettie St 35Th St Manila Av Baker St Magnolia St Opal St Burma Rd Taft Av Racine St Union St King St 52Nd St I80 Eb To I580 Eb Conn 53Rd St Folger Av Fairview St Forest St Cavour St Chestnut St Linda Av Bay St Fremont St Miles Av Keith Av Lowell Linden St W Grand Ocean Av Locksley Av Lowell St Helen St Hannah St Martin Luther King Jr Wy Wake Av Gaskill St I880 Nb To I80 Wb Conn Lusk St James Av I80 Eb To I880 Sb Conn Kales Av Monte Vista Av Beaudry St John St Ayala Av Mather St Brockhurst St Terrace St Lawton Av Filbert St Oakland Av Engineer Rd Emery St Herzog St Hudson St 37Th St Harrison St Watts St Thomas Av 36Th St Montgomery St Canning St California St I880 Nb Idaho St Louise St 58Th St 61St St 62Nd St Florio St Echo Av I580 Eb To Sr24 Eb Conn North St 63Rd St I80 Wb To I580 Eb Conn Harwood Av I980 Wb Ridgeway Av Fairmount Av Poplar St Rich St Glen Av Holden St 30Th St 50Th St Desmond St Kingston Av Bryant Av West On I580 Eb Maccall St Mandela Pw Martin Luther King Off Sr24 Eb 48Th St Ocean View Dr Ellis St I580 Wb To I980 Wb Conn Alaska St Carlton St Poirier St Sr24 Wb To I580 Wb Conn 52Nd Off Sr24 Eb Hillegass Av Moss Av Peladeau St 52Nd On Sr24 Wb Birch Ct Ruby St Elm St Halleck St Lacoste St Presley Wy Ukraine St Telegraph Off Sr24 Wb I980 Eb To I580 Wb Conn Oak Grove Av Access Carberry Av Clarke St Montell St Howell St Olive Av Richmond Bl View St Broadway Webster Off I580 Eb Myrtle St Rose Av Lake Av Vicente St 61St Pl Hawthorne Av Willow St Ross St Essex St Entrada Av Yosemite Av W Grand Off I580 Wb W Macarthur Bl Salem St El Dorado Av Haven St Clifton St Avon St Dana St Moss Wy I580 Wb To Sr24 Eb Conn Grace Av Rio Vista Av Sherwin St Bataan St Claremont Off Sr24 Eb Doyle 40Th Street Wy Cerrito Av 38Th St 26Th St Whitmore St Overland Av Redondo Av View Pl Beach St Harlan St Vicente Wy Africa St Dover St Whitney St Latimer Pl Ada St Covent Ln Garnet St Occidental St Kempton Wy Hardy St Randwick Av Croxton Av Access Road Admiral Dr Haruff St Hemphill Pl Armanino Ct Shellmound Wy Helen Ct Captain Dr City Limits Ci 61St St Lawton Av 62Nd St Lowell 36Th St 55Th St 61St St 66Th St Harlan St 54Th St 39Th St 62Nd St 65Th St 54Th St 58Th St Manila Av Linden St 59Th St 40Th St 32Nd St 43Rd St 33Rd St 61St St 50Th St Manila Av 51St St Dover St 53Rd St 67Th St 53Rd St 45Th St 63Rd St Hawthorne Av 57Th St 36Th St Linden St Manila Av 63Rd St 62Nd St 63Rd St 47Th St Wake Av 58Th St 48Th St 30Th St 37Th St Miles Av 63Rd St 41St St 56Th St 62Nd St 46Th St Herzog St 63Rd St 32Nd St 59Th St 62Nd St 65Th St 64Th St 55Th St 41St St 62Nd St Clifton St 47Th St Occidental St 61St St 32Nd St Essex St 60Th St Apgar St 37Th St 45Th St 63Rd St Herzog St 53Rd St Clarke St 44Th St Ruby St Doyle St 58Th St 34Th St 62Nd St Frontage Rd 61St St 61St St Market St Frontage Rd 60Th St Salem St 31St St Access 60Th St 54Th St 61St St 59Th St Manila Av Bay St 62Nd St 39Th St 52Nd St 50Th St 41St St §¨¦ §¨¦ §¨¦
Oakland
Emeryville
Berkeley
0.25 0.5 0.125
Miles±
Legend
Proposed Stops Proposed Northbound Stops (Odd #) Proposed Southbound Stops (Even #) Transit Centers and Mobility Hubs 1/4 Mile Walkshed Pedestrian Gaps Unprotected Crossing Missing Curb Ramp Slip Lane Crossing Missing Sidewalk
Pedestrian Access Gaps - Emeryville/Oakland | Final Report
® ®
WEST CONTRA COSTA COUNTY
EXPRESS BUS IMPLEMENTATION PLAN
Original PDF, page 160
% % % % Broadway/3rd St Broadway/7th St Broadway/20th St Broadway/13th St 2nd St/Washington St Stop #86 SB Stop #64 SB Stop #70 SB Stop #66 SB Stop #68 SB Stop #69 NB Stop #85 NB Stop #67 NB Stop #63 NB Stop #65 NB 14th St Harrison St Market St Brush St Castro St Webster St Adeline St 5th St 8th St Clay St Peralta St 12th St Broadway Grand Ave Union St Mandela Pkwy Telegraph Ave Lakeshore Ave 7th St San Pablo Ave 1st Ave Webster St Tube 18th St Foothill Blvd Lakeside Dr International Blvd 20th St Posey Tube Loop Middle Harbor Rd Oak St Northgate Ave Fallon St 5th St San Pablo Ave 8th St Embarcadero 18th St 8th St 14Th St 3Rd St 7Th St 12Th St Broadway 16Th St 17Th St 8Th St Brush St 2Nd St 18Th St 6Th St 5Th St Market St Webster St Oak St 5Th Av Grand Av 10Th St Jackson St Adeline St Franklin St 21St St Jefferson St Madison St Peralta St Harrison St Embarcadero W Clay St 4Th Av Mandela Pw Union St West St 3Rd Av 6Th Av 2Nd Av Alice St 7Th Av W Grand Av E 10Th St Lee St E 15Th St Chester St Telegraph Av Campbell St Perkins St Myrtle St 13Th St Martin Luther King Jr Wy San Pablo Av Filbert St 8Th Av Euclid Av Willow St 1St Av Linden St 20Th St Posey Tube Poplar St Washington St Foothill Bl Henry St Middle Harbor Rd Bellevue Av 9Th St Staten Av International Bl Chestnut St Van Buren Av 23Rd St 9Th Av 19Th St Magnolia St 22Nd St Water St Lakeshore Av Webster Tube 11Th St E 18Th St Lakeside Dr Lenox Av Valdez St Wood St Palm Av Fallon St Valley St Jayne Av Athol Av Vernon St 15Th St Bay Pl 4Th St E 12Th St William St Curtis St Wayne Av E 11Th St Montecito Av Warwick Av Hanover Av 24Th St Victory Ct E 16Th St Poplar Wy Center St Adams St Kirkham Ct Park View Te Kirkham St Embarcadero Ellita Av Thomas L Berkley Wy Belmont St E 8Th St Waverly St Village Ci Park Wy E 17Th St 10Th Av Burk St Jack London Sq Frank H Ogawa Pz Orin Dr Preservation Park Wy Chestnut St Harrison St 11Th St 6Th St 15Th St Filbert St 9Th St 13Th St Poplar St E 11Th St Alice St Clay St 12Th St 20Th St 21St St Filbert St West St 22Nd St 4Th St 5Th St 15Th St 23Rd St Castro St 15Th St Kirkham St Chestnut St Linden St Magnolia St 19Th St 19Th St 18Th St 13Th St 8Th St 16Th St 19Th St 20Th St Franklin St 19Th St Fallon St 14Th St Kirkham St Fallon St 23Rd St 23Rd St 3Rd St 24Th St 6Th St 17Th St 22Nd St 15Th St Myrtle St Alice St Center St 4Th St Union St Wayne Av Myrtle St Magnolia St 10Th St 10Th St 18Th St 7Th St 22Nd St 13Th St 15Th St 18Th St 6Th St 21St St Alice St Linden St 11Th St 10Th St §¨¦
Oakland
Alameda
0.25 0.5 0.125
Miles±
Legend
Proposed Stops Proposed Northbound Stops (Odd #) Proposed Southbound Stops (Even #) Transit Centers and Mobility Hubs 1/4 Mile Walkshed Pedestrian Gaps Unprotected Crossing Missing Curb Ramp Slip Lane Crossing Missing Sidewalk
Pedestrian Access Gaps - Oakland | Final Report
® ®
WEST CONTRA COSTA COUNTY
EXPRESS BUS IMPLEMENTATION PLAN
Original PDF, page 161
® ®
WEST CONTRA COSTA COUNTY
EXPRESS BUS IMPLEMENTATION PLAN G.
OPERATIONS AND
MAINTENANCE
MEMORANDUM
Final Plan | February 2020

PROPOSED SERVICE PLANS
(FINAL)
December | 2019
Connetics Transportation Group
Proposed Service Plans | November 2019
INTRODUCTION
This Technical Memorandum presents methodology, assumptions and results with developed schedules, service plans, O&M costs and fare revenue projections for express bus routes being considered by West Contra Costa Transportation Advisory Committee (WCCTAC). Potential express routes that have been analyzed are as follows:
Route 1: Hercules Transit Center and Richmond Transit Center to Berkeley
Route 2: Hercules Transit Center and Richmond Parkway Transit Center to Oakland/Jack London Square via Emeryville
Route 3: Pinole and Richmond Parkway Transit Center via San Pablo Avenue to Oakland/Jack London Square
Route 4: Pinole and Richmond Parkway Transit Center via San Pablo Avenue to Salesforce Transit Center in San Francisco
Route 5: San Pablo, El Sobrante, and potential San Pablo Dam Road P&R to Salesforce Transit Center
Route 6: San Pablo, Richmond, and potential Richmond East P&R to Oakland/Jack London Square via Emeryville
Route 7: San Pablo, Richmond, and potential Richmond East P&R to Berkeley
Route 8: San Pablo, Richmond, and potential Richmond West P&R to Oakland/Jack London Square Longer-term, Route 2 has been analyzed as two separate routes: Route 2A, which would terminate in Emeryville, and Route 2B, which would terminate at Jack London Square. Routes 1 through 4 are assumed to be operated by WestCAT and Routes 5 through 8 are assumed to be operated by AC Transit. Figure 1 presents route alignment map.
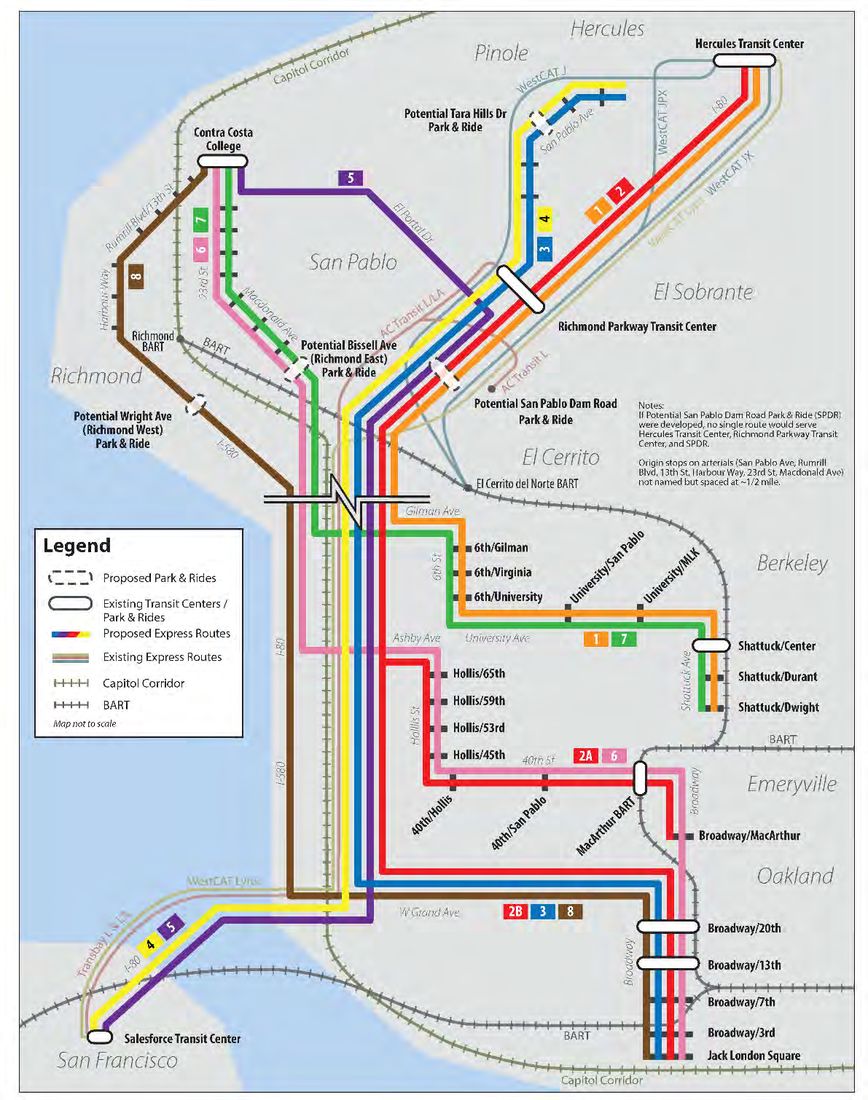
Original PDF, page 164
Proposed Service Plans | November 2019 Figure 1: Proposed Express Bus Routes – Long Term
| Route | AM Peak Dir. | Midday Time | PM Peak Dir. | ||||||
|---|---|---|---|---|---|---|---|---|---|
| Time | (Avg.) | Time | |||||||
| 1 | 44 min. | 40 min. | 45 min. | ||||||
| 2 | 61 min. | 56 min. | 63 min. | ||||||
| 2A* | 50 min. | 45 min. | 54 min. | ||||||
| 2B* | 47 min. | 45 min. | 50 min. | ||||||
| 3 | 49 min. | 47 min. | 50 min. | ||||||
| 4 | 57 min. | 54 min. | 50 min. | ||||||
| 5 | 48 min. | 45 min. | 45 min. | ||||||
| 6 | 54 min. | 52 min. | 52 min. | ||||||
| 7 | 43 min. | 42 min. | 44 min. | ||||||
| 8 | 46 min. | 48 min. | 54 min. |
Proposed Service Plans | November 2019
SCHEDULE ASSUMPTIONS
The first step to developing schedules is the estimate of route travel times. Primary express routes currently serving the I-80 corridor include WestCAT’s Lynx, Route JX/JPX (Hercules Transit Center to El Cerrito del Norte BART), and Route JR/JL (also Hercules Transit Center to El Cerrito del Norte BART) and AC Transit’s Route LA (Hilltop P&R to Salesforce Transit Center). Since these routes have limited applicability to the routes being considered for this project, travel time estimates were developed by compiling hourly Google traffic speed data by direction for 60 roadway segments that were defined for this project. The speed data was queried for results in the future (Google has predictive data on traffic speeds which feed into Google Maps directions) as opposed to current day data in order to avoid selecting speeds that might be impacted by a non-recurring traffic incident. This speed information was then used as inputs into travel time spreadsheet-based models that were developed for each route. Run times between stops take into consideration acceleration/deceleration (1.5 mphps acceleration /2.0 mphps deceleration) between assumed stops and stop dwell times (15 seconds to 1 minute, categorized depending on the estimated level of demand at the stop). Routes across the Bay Bridge include additional time to account for unexpected congestion.
Table 1 summarizes route travel time estimates by time period. Route travel time summaries by time period and by direction are provided in Appendix A. Travel times presented in Table 1 are slightly greater than those in Appendix A due to rounding of times between timepoints and consideration of additional congestion around the Bay Bridge toll plaza for Routes 4 and 5. Times shown below are consistent with those used in schedules presented in Appendix B.
Table 1: Route Travel Time Estimates by Time Period Schedules were then developed with these travel time estimates. Two schedules were developed for each route:
Peak period, peak direction-only service (15 to 30-minute frequencies between 5 am and 9 pm and between 3 pm and 7 pm). Proposed schedules result in 26 one-way trips each weekday for each route.
Peak period, peak direction service with limited midday service (both directions). Two-hour frequencies were achievable with one bus for all but Route 4, which required frequencies at 2 hours and 15 minutes with one bus. Proposed schedules result in 32 one-way trips each weekday for each route except Route 4, which has 30 one-way trips.
Original PDF, page 166
| Route | Peak | Fleet | Total Daily Hours | Total Daily Miles | ||||||||||||||
|---|---|---|---|---|---|---|---|---|---|---|---|---|---|---|---|---|---|---|
| Buses | Buses** | Peak Only | Peak w/ Midday | Peak Only | Peak w/ Midday | |||||||||||||
| 1 | 6 | 8 | 42.4 | 47.8 | 851 | 918 | ||||||||||||
| 2 | 8 | 10 | 51.4 | 57.8 | 1,086 | 1,203 | ||||||||||||
| 2A* | 7 | 9 | 47.8 | 53.3 | 994 | 1,071 | ||||||||||||
| 2B* | 7 | 9 | 47.9 | 47.9 | 1,047 | 1,047 | ||||||||||||
| 3 | 6 | 8 | 45.2 | 50.5 | 944 | 1,039 | ||||||||||||
| 4 | 7 | 9 | 47.0 | 53.0 | 1,057 | 1,143 | ||||||||||||
| 5 | 7 | 9 | 46.2 | 52.7 | 982 | 881 | ||||||||||||
| 6 | 6 | 8 | 44.9 | 50.3 | 791 | 856 | ||||||||||||
| 7 | 6 | 8 | 42.2 | 47.6 | 623 | 676 | ||||||||||||
| 8 | 7 | 9 | 46.4 | 51.6 | 810 | 881 |
Proposed Service Plans | November 2019 Appendix B presents proposed schedules for each route. These schedules identify bus block assignments, estimated pull-out and pull-In times from nearby WestCAT or AC Transit garage locations, end-of-line layover times and deadhead times for buses returning to make a second trip. Deadhead assignments include a 10-minute cushion when assigning buses to blocks. A summary of daily route-level service requirements is provided below in Table 2. Note that the below table presents estimated total hours and miles of service (i.e., total hours include pull-out, pull-in, layover and deadhead times).
Table 2: Daily Route Service Requirements
Original PDF, page 167
| Route | Operator | Peak Only | Peak & Midday | ||||||||
|---|---|---|---|---|---|---|---|---|---|---|---|
| 1 | WC | $972,000 | $1,097,000 | ||||||||
| 2 | WC | $1,180,000 | $1,326,000 | ||||||||
| 2A* | WC | $1,097,000 | $1,222,000 | ||||||||
| 2B* | WC | $1,098,000 | $1,098,000 | ||||||||
| 3 | WC | $1,037,000 | $1,159,000 | ||||||||
| 4 | WC | $1,078,000 | $1,216,000 | ||||||||
| 5 | AC | $1,650,000 | $1,881,000 | ||||||||
| 6 | AC | $1,603,000 | $1,796,000 | ||||||||
| 7 | AC | $1,508,000 | $1,701 ,000 | ||||||||
| 8 | AC | $1,655,000 | $1,842,000 |
Proposed Service Plans | November 2019
ANNUAL O&M COSTS
Service statistics presented in Table 2 were annualized (assuming 255 weekdays of service) and applied to unit costs to arrive at estimates of annual O&M costs. WestCAT O&M costs were estimated by using a rate of $90 for each total hour of bus service (revenue and deadhead). AC Transit O&M costs were estimated by using a rate of $140 for each total hour of bus service (revenue and deadhead). Both rates were provided by the operators.
Resulting O&M cost estimates using the service statistics presented in Table 2 and the unit costs presented above are summarized below in Table 3.
Table 3: Annual O&M Cost Estimates by Route (2019$)
Original PDF, page 168
Proposed Service Plans | November 2019
RIDERSHIP ASSUMPTIONS
Ridership estimates are based on travel markets served by the proposed routes with anticipated capture pivoted off of existing transit services in similar markets. Ridership estimates are approximate for the purposes of revenue projections only and are not based on an adopted travel demand model. Ridership estimates are provided as a range to account for uncertainty in future travel patterns. Ridership estimates are based on existing land use and congestion levels and do not reflect anticipated population growth and increase in congestion. The ridership estimates assume buildout of full park & ride capacity as indicated in the project’s Capital Improvements Technical Memorandum (October 2019).
FARE REVENUE AND SUBSIDY REQUIREMENTS
Potential fare revenues were determined by applying an average fare revenue to ridership estimates. Kimley-Horn and Associates provided a ridership estimate range for each route. Assumptions regarding fares are as follows:
WestCAT Fares
WestCAT’s Lynx Transbay route has a one-way fare of $5.00. Discounts are available for riders aged 65 and over, and disabled/Medicare riders. A discounted fare is also possible with a 31-day pass, depending on the amount of use.
For purposes of this analysis, a $5.00 fare has been assumed for Route 4 – a proposed WestCAT-operated Transbay route from Hercules. WestCAT’s cash fare for local fixed route bus service is $1.75. Since Routes 1, 2 and 3 are longer- distance East Bay routes, a fare of $3.50 has been assumed (between the local and Lynx fares). The average fare collected was assumed to be 85 percent of the full fare to account for impacts related to discounts.
AC Transit Fares
AC Transit’s Route LA (a Transbay route) currently has a fare of $5.50. Thus, this fare was also assumed for Route 5 (Contra Costa College to SF Transbay). For Routes 7, 8 and 9 (East Bay routes), a fare of $2.50 has been assumed.
This is AC Transit’s current local route cash fare, which is consistent with the fare currently charged on AC Transit’s Routes 72, 72M and 800 (corridor routes that are similar in length/market to Routes 6, 7 and 8). The average fare collected was assumed to be 85 percent of the full fare to account for impacts related to discounts. AC Transit currently provides fare discounts for youth (age 5-18), seniors and disabled riders. AC Transit also has a 31-day pass which can provide a discounted fare depending on amount of use.
Farebox Recovery/Subsidy Required
Table 4 presents estimated farebox recovery ratios and subsidy requirements by route for the low and high ridership projections. Higher subsidies are required for Routes 6 through 8 – AC Transit proposed routes where local fares are assumed. For comparison purposes, the 2017 NTD indicates that WestCAT’s farebox recovery ratio for commuter bus service is 62 percent and AC Transit’s is 34 percent.
Original PDF, page 169
| Route Operator 1 WC 2 WC 2A* WC 2B* WC 3 WC 4 WC 5 AC 6 AC 7 AC | Daily Ridership Low High 366 549 557 835 277 415 559 839 316 474 544 580 293 366 501 602 427 641 | Annual Ridership Low High 93,300 140,000 142,000 212,900 70,600 105,800 142,500 213,900 80,600 120,900 138,700 147,900 74,700 93,300 127,800 153,500 108,900 163,500 | Cash Net Fare Fare $3.50 $2.98 $3.50 $2.98 $3.50 $2.98 $3.50 $2.98 $3.50 $2.98 $5.00 $4.25 $5.50 $4.68 $2.50 $2.13 $2.50 $2.13 | Passenger Revenue Low High $278,000 $417,000 $422,000 $633,000 $210,000 $315,000 $424,000 $636,000 $240,000 $360,000 $589,000 $629,000 $349,000 $436,000 $272,000 $326,000 $231,000 $347,000 | Annual O&M Cost $972,000 $1,180,000 $1,097,000 $1,098,000 $1,037,000 $1,078,000 $1,650,000 $1,603,000 $1,508,000 | Farebox Recovery Low High 29% 43% 36% 54% 19% 29% 39% 58% 23% 35% 55% 58% 21% 26% 17% 20% 15% 23% | Subsidy Required Low High $694,000 $555,000 $758,000 $547,000 $887,000 $782,000 $674,000 $462,000 $797,000 $677,000 $489,000 $449,000 $1,301,000 $1,214,000 $1,331,000 $1,277,000 $1,277,000 $1,161,000 |
|---|---|---|---|---|---|---|---|
| 8 AC | 299 449 | 76,200 114,500 | $2.50 $2.13 | $162,000 $243,000 | $1,655,000 | 10% 15% | $1,493,000 $1,412,000 |
| Route Operator | Daily Ridership Low High | Annual Ridership Low High | Cash Net Fare Fare | Passenger Revenue Low High | Annual O&M Cost | Farebox Recovery Low High | Subsidy Required Low High |
|---|---|---|---|---|---|---|---|
| 1 WC | 393 589 | 100,200 150,200 | $3.50 $2.98 | $298,000 $447,000 | $1,097,000 | 27% 41% | $799,000 $650,000 |
| 2 WC 2A* WC | 597 896 297 446 | 152,200 228,500 75,700 113,700 | $3.50 $2.98 $3.50 $2.98 | $453,000 $680,000 $225,000 $338,000 | $1,326,000 $1,222,000 | 34% 51% 18% 28% | $873,000 $646,000 $997,000 $884,000 |
| 2B* WC | 600 900 | 153,000 229,500 | $3.50 $2.98 | $455,000 $683,000 | $1,098,000 | 41% 62% | $643,000 $415,000 |
| 3 WC 4 WC 5 AC 6 AC 7 AC 8 AC | 332 497 588 628 317 396 430 646 458 687 321 481 | 84,700 126,700 149,900 160,100 80,800 101,000 109,700 164,700 116,800 175,200 81,900 122,700 | $3.50 $2.98 $5.00 $4.25 $5.50 $4.68 $2.50 $2.13 $2.50 $2.13 $2.50 $2.13 | $252,000 $377,000 $637,000 $680,000 $378,000 $472,000 $233,000 $350,000 $248,000 $372,000 $174,000 $261,000 | $1,159,000 $1,216,000 $1,881,000 $1,796,000 $1,701,000 $1,842,000 | 22% 33% 52% 56% 20% 25% 13% 19% 15% 22% 9% 14% | $907,000 $782,000 $579,000 $536,000 $1,503,000 $1,409,000 $1,563,000 $1,446,000 $1,453,000 $1,329,000 $1,668,000 $1,581,000 |
Proposed Service Plans | November 2019 Table 4: Estimates of Farebox Revenues and Subsidy Requirements 1Daily ridership is provided in ranges to reflect uncertainty in future travel patterns. Daily ridership is based on existing land use and does not reflect future population and congestion growth. Daily ridership assumes buildout of proposed park & ride capacity.
2Net fare reflects the average per-rider fare yield accounting for various discounts and period-based pass programs 3Revenues and costs are reflected in 2019 dollars WC = WestCAT AC = AC Transit 15-30 Min. Peak Only Service 15-30 Min. Peak With Midday Service
Original PDF, page 170
Proposed Service Plans | November 2019
Appendix A
Route Travel Time Estimates
| AM Peak Midday PM Peak Route 1 Southbound Distance Time Speed Time Speed Time Speed | ||||||
|---|---|---|---|---|---|---|
| 1 Hercules Transit Center 4.30 0:11:23 22.7 0:09:54 26.1 0:10:59 23.5 2 Richmond Pkwy Transit Center 8.83 0:17:38 30.0 0:15:02 35.2 0:15:02 35.2 3 Gilman/6th 0.50 0:02:24 12.5 0:02:46 10.8 0:02:46 10.8 6th/Virginia 0.35 0:01:48 11.7 0:02:03 10.2 0:02:03 10.2 University/6th 0.32 0:01:31 12.7 0:01:41 11.4 0:01:54 10.1 University/San Pablo 1.05 0:04:01 15.7 0:04:36 13.7 0:05:25 11.6 University/MLK 0.35 0:01:52 11.3 0:02:03 10.2 0:02:18 9.1 4 Downtown Berkeley BART 0.27 0:01:21 12.0 0:01:29 10.9 0:01:40 9.7 Shattuck/Durant 0.20 0:01:12 10.0 0:01:20 9.0 0:01:20 9.0 5 Shattuck/Dwight Total 16.17 0:43:10 22.5 0:40:54 23.7 0:43:27 22.3 | 0:09:54 0:15:02 0:02:46 0:02:03 0:01:41 0:04:36 0:02:03 0:01:29 0:01:20 | 0:10:59 0:15:02 0:02:46 0:02:03 0:01:54 0:05:25 0:02:18 0:01:40 0:01:20 | ||||
| 22.7 | 26.1 | 23.5 | ||||
| 30.0 | 35.2 | 35.2 | ||||
| 12.5 | 10.8 | 10.8 | ||||
| 11.7 | 10.2 | 10.2 | ||||
| 12.7 | 11.4 | 10.1 | ||||
| 15.7 | 13.7 | 11.6 | ||||
| 11.3 | 10.2 | 9.1 | ||||
| 12.0 | 10.9 | 9.7 | ||||
| 10.0 | 9.0 | 9.0 | ||||
| Total 16.17 0:43:10 22.5 0:40:54 23.7 0:43:27 22.3 |
| AM Peak Midday PM Peak Route 1 Northbound Distance Time Speed Time Speed Time Speed | ||||||
|---|---|---|---|---|---|---|
| 1 Shattuck/Dwight 0.20 0:01:12 10.0 0:01:20 9.0 0:01:20 9.0 Shattuck/Durant 0.25 0:01:32 9.8 0:01:39 9.1 0:01:49 8.3 2 Downtown Berkeley BART 0.44 0:01:56 13.7 0:02:09 12.3 0:02:29 10.6 University/MLK 1.07 0:04:05 15.7 0:04:41 13.7 0:05:30 11.7 University/San Pablo 0.30 0:01:27 12.4 0:01:36 11.3 0:01:49 9.9 University/6th 0.28 0:01:31 11.1 0:01:43 9.8 0:01:43 9.8 6th/Virginia 0.54 0:02:33 12.7 0:02:58 10.9 0:02:58 10.9 3 Gilman/6th 8.69 0:21:34 24.2 0:13:20 39.1 0:18:09 28.7 4 Richmond Pkwy Transit Center 4.13 0:09:49 25.2 0:08:36 28.8 0:09:49 25.2 5 Hercules Transit Center Total 15.90 0:45:39 20.9 0:38:02 25.1 0:45:36 20.9 | 0:01:20 0:01:39 0:02:09 0:04:41 0:01:36 0:01:43 0:02:58 0:13:20 0:08:36 | 0:01:20 0:01:49 0:02:29 0:05:30 0:01:49 0:01:43 0:02:58 0:18:09 0:09:49 | ||||
| 10.0 | 9.0 | 9.0 | ||||
| 9.8 | 9.1 | 8.3 | ||||
| 13.7 | 12.3 | 10.6 | ||||
| 15.7 | 13.7 | 11.7 | ||||
| 12.4 | 11.3 | 9.9 | ||||
| 11.1 | 9.8 | 9.8 | ||||
| 12.7 | 10.9 | 10.9 | ||||
| 24.2 | 39.1 | 28.7 | ||||
| 25.2 | 28.8 | 25.2 | ||||
| Total 15.90 0:45:39 20.9 0:38:02 25.1 0:45:36 20.9 |
| AM Peak Midday PM Peak Route 2 Southbound Distance Time Speed Time Speed Time Speed | ||||||
|---|---|---|---|---|---|---|
| 1 Hercules Transit Center 4.3 0:11:23 22.7 0:09:54 26.1 0:10:59 23.5 2 Richmond Pkwy Transit Center 11.55 0:24:34 28.2 0:18:42 37.1 0:21:49 31.8 3 Hollis/65th 0.4 0:02:00 12.0 0:02:00 12.0 0:02:17 10.5 Hollis/59th 0.38 0:01:55 11.9 0:01:55 11.9 0:02:12 10.4 Hollis/53rd 0.22 0:01:17 10.3 0:01:17 10.3 0:01:25 9.3 Hollis/45th 0.21 0:01:14 10.2 0:01:23 9.1 0:01:23 9.1 40th/Hollis 0.38 0:01:43 13.3 0:01:55 11.9 0:01:55 11.9 40th/Adeline 0.66 0:02:56 13.5 0:03:17 12.1 0:03:17 12.1 4 MacArthur BART 0.83 0:03:16 15.2 0:03:43 13.4 0:03:43 13.4 MacArthur/Broadway 1.19 0:04:45 15.0 0:04:45 15.0 0:04:45 15.0 5 19th Street BART 0.4 0:02:15 10.7 0:02:15 10.7 0:02:15 10.7 6 12th Street BART 0.35 0:01:48 11.7 0:01:48 11.7 0:01:48 11.7 7th/Broadway 0.18 0:01:07 9.7 0:01:07 9.7 0:01:07 9.7 3rd/Broadway 0.15 0:01:15 7.2 0:01:15 7.2 0:01:15 7.2 7 2nd/Washington (J. London Sq.) Total 21.20 0:50:18 25.3 0:44:06 28.8 0:49:00 26.0 | 0:09:54 0:18:42 0:02:00 0:01:55 0:01:17 0:01:23 0:01:55 0:03:17 0:03:43 0:04:45 0:02:15 0:01:48 0:01:07 0:01:15 | 0:10:59 0:21:49 0:02:17 0:02:12 0:01:25 0:01:23 0:01:55 0:03:17 0:03:43 0:04:45 0:02:15 0:01:48 0:01:07 0:01:15 | ||||
| 22.7 | 26.1 | 23.5 | ||||
| 28.2 | 37.1 | 31.8 | ||||
| 12.0 | 12.0 | 10.5 | ||||
| 11.9 | 11.9 | 10.4 | ||||
| 10.3 | 10.3 | 9.3 | ||||
| 10.2 | 9.1 | 9.1 | ||||
| 13.3 | 11.9 | 11.9 | ||||
| 13.5 | 12.1 | 12.1 | ||||
| 15.2 | 13.4 | 13.4 | ||||
| 15.0 | 15.0 | 15.0 | ||||
| 10.7 | 10.7 | 10.7 | ||||
| 11.7 | 11.7 | 11.7 | ||||
| 9.7 | 9.7 | 9.7 | ||||
| 7.2 | 7.2 | 7.2 | ||||
| Total 21.20 0:50:18 25.3 0:44:06 28.8 0:49:00 26.0 |
Proposed Service Plans | November 2019 AM Peak Midday PM Peak AM Peak Midday PM Peak Route 1 Southbound Distance Time Speed Time Speed Time Speed Route 1 Northbound Distance Time Speed Time Speed Time Speed Hercules Transit Center Shattuck/Dwight 4.30 0:11:23 22.7 0:09:54 26.1 0:10:59 23.5 0.20 0:01:12 10.0 0:01:20 9.0 0:01:20 9.0 Richmond Pkwy Transit Center Shattuck/Durant 8.83 0:17:38 30.0 0:15:02 35.2 0:15:02 35.2 0.25 0:01:32 9.8 0:01:39 9.1 0:01:49 8.3 Gilman/6th Downtown Berkeley BART 0.50 0:02:24 12.5 0:02:46 10.8 0:02:46 10.8 0.44 0:01:56 13.7 0:02:09 12.3 0:02:29 10.6 6th/Virginia University/MLK 0.35 0:01:48 11.7 0:02:03 10.2 0:02:03 10.2 1.07 0:04:05 15.7 0:04:41 13.7 0:05:30 11.7 University/6th University/San Pablo 0.32 0:01:31 12.7 0:01:41 11.4 0:01:54 10.1 0.30 0:01:27 12.4 0:01:36 11.3 0:01:49 9.9 University/San Pablo University/6th 1.05 0:04:01 15.7 0:04:36 13.7 0:05:25 11.6 0.28 0:01:31 11.1 0:01:43 9.8 0:01:43 9.8 University/MLK 6th/Virginia 0.35 0:01:52 11.3 0:02:03 10.2 0:02:18 9.1 0.54 0:02:33 12.7 0:02:58 10.9 0:02:58 10.9 Downtown Berkeley BART Gilman/6th 0.27 0:01:21 12.0 0:01:29 10.9 0:01:40 9.7 8.69 0:21:34 24.2 0:13:20 39.1 0:18:09 28.7 Shattuck/Durant Richmond Pkwy Transit Center 0.20 0:01:12 10.0 0:01:20 9.0 0:01:20 9.0 4.13 0:09:49 25.2 0:08:36 28.8 0:09:49 25.2 Shattuck/Dwight Hercules Transit Center Total 16.17 0:43:10 22.5 0:40:54 23.7 0:43:27 22.3 Total 15.90 0:45:39 20.9 0:38:02 25.1 0:45:36 20.9 AM Peak Midday PM Peak AM Peak Midday PM Peak Route 2 Southbound Distance Time Speed Time Speed Time Speed Route 2 Northbound Distance Time Speed Time Speed Time Speed Hercules Transit Center 2nd/Washington (J. London Sq.)
4.3 0:11:23 22.7 0:09:54 26.1 0:10:59 23.5 0.16 0:01:08 8.5 0:01:08 8.5 0:01:08 8.5 Richmond Pkwy Transit Center 3rd/Broadway 11.55 0:24:34 28.2 0:18:42 37.1 0:21:49 31.8 0.23 0:01:28 9.4 0:01:28 9.4 0:01:28 9.4 Hollis/65th 7th/Broadway 0.4 0:02:00 12.0 0:02:00 12.0 0:02:17 10.5 0.35 0:02:18 9.1 0:02:18 9.1 0:02:18 9.1 Hollis/59th 12th Street BART 0.38 0:01:55 11.9 0:01:55 11.9 0:02:12 10.4 0.4 0:02:32 9.5 0:02:32 9.5 0:02:32 9.5 Hollis/53rd 19th Street BART 0.22 0:01:17 10.3 0:01:17 10.3 0:01:25 9.3 1.2 0:04:32 15.9 0:04:32 15.9 0:04:32 15.9 Hollis/45th MacArthur/Broadway 0.21 0:01:14 10.2 0:01:23 9.1 0:01:23 9.1 0.76 0:03:16 14.0 0:03:41 12.4 0:03:41 12.4 40th/Hollis MacArthur BART 0.38 0:01:43 13.3 0:01:55 11.9 0:01:55 11.9 0.68 0:02:45 14.8 0:03:07 13.1 0:03:07 13.1 40th/Adeline 40th/Adeline 0.66 0:02:56 13.5 0:03:17 12.1 0:03:17 12.1 0.23 0:01:19 10.5 0:01:19 10.5 0:01:28 9.4 MacArthur BART Hollis/45th 0.83 0:03:16 15.2 0:03:43 13.4 0:03:43 13.4 0.36 0:01:39 13.1 0:01:50 11.8 0:01:50 11.8 MacArthur/Broadway 40th/Hollis 1.19 0:04:45 15.0 0:04:45 15.0 0:04:45 15.0 0.22 0:01:17 10.3 0:01:25 9.3 0:01:25 9.3 19th Street BART Hollis/53rd 0.4 0:02:15 10.7 0:02:15 10.7 0:02:15 10.7 0.4 0:02:00 12.0 0:02:00 12.0 0:02:17 10.5 12th Street BART Hollis/59th 0.35 0:01:48 11.7 0:01:48 11.7 0:01:48 11.7 0.41 0:02:02 12.1 0:02:02 12.1 0:02:20 10.5 7th/Broadway Hollis/65th 0.18 0:01:07 9.7 0:01:07 9.7 0:01:07 9.7 11.25 0:26:20 25.6 0:19:39 34.4 0:24:01 28.1 3rd/Broadway Richmond Pkwy Transit Center 0.15 0:01:15 7.2 0:01:15 7.2 0:01:15 7.2 4.13 0:09:49 25.2 0:08:36 28.8 0:09:49 25.2 2nd/Washington (J. London Sq.)
Hercules Transit Center Total 21.20 0:50:18 25.3 0:44:06 28.8 0:49:00 26.0 Total 20.78 1:02:25 20.0 0:55:37 22.4 1:01:56 20.1
Original PDF, page 172
| AM Peak Midday PM Peak Route 2A Southbound Distance Time Speed Time Speed Time Speed | ||||||
|---|---|---|---|---|---|---|
| 1 Hercules Transit Center 4.3 0:11:23 22.7 0:09:54 26.1 0:10:59 23.5 2 Richmond Pkwy Transit Center 11.55 0:24:34 28.2 0:18:42 37.1 0:21:49 31.8 3 Hollis/65th 0.4 0:02:00 12.0 0:02:00 12.0 0:02:17 10.5 Hollis/59th 0.38 0:01:55 11.9 0:01:55 11.9 0:02:12 10.4 Hollis/53rd 0.22 0:01:17 10.3 0:01:17 10.3 0:01:25 9.3 Hollis/45th 0.21 0:01:05 11.6 0:01:23 9.1 0:01:23 9.1 40th/Hollis 0.38 0:01:43 13.3 0:01:55 11.9 0:01:55 11.9 40th/Adeline 0.66 0:02:56 13.5 0:03:17 12.1 0:03:17 12.1 4 MacArthur BART 0.83 0:03:16 15.2 0:03:43 13.4 0:03:43 13.4 5 MacArthur/Broadway Total 18.93 0:50:09 22.6 0:44:06 25.8 0:49:00 23.2 | 0:09:54 0:18:42 0:02:00 0:01:55 0:01:17 0:01:23 0:01:55 0:03:17 0:03:43 | 0:10:59 0:21:49 0:02:17 0:02:12 0:01:25 0:01:23 0:01:55 0:03:17 0:03:43 | ||||
| 22.7 | 26.1 | 23.5 | ||||
| 28.2 | 37.1 | 31.8 | ||||
| 12.0 | 12.0 | 10.5 | ||||
| 11.9 | 11.9 | 10.4 | ||||
| 10.3 | 10.3 | 9.3 | ||||
| 11.6 | 9.1 | 9.1 | ||||
| 13.3 | 11.9 | 11.9 | ||||
| 13.5 | 12.1 | 12.1 | ||||
| 15.2 | 13.4 | 13.4 | ||||
| Total 18.93 0:50:09 22.6 0:44:06 25.8 0:49:00 23.2 |
| AM Peak Midday PM Peak Route 2A Northbound Distance Time Speed Time Speed Time Speed | ||||||
|---|---|---|---|---|---|---|
| 5 MacArthur/Broadway 0.76 0:03:16 14.0 0:03:41 12.4 0:03:41 12.4 4 MacArthur BART 0.68 0:02:45 14.8 0:03:07 13.1 0:03:07 13.1 40th/Adeline 0.36 0:01:39 13.1 0:01:50 11.8 0:01:50 11.8 40th/Hollis 0.23 0:01:19 10.5 0:01:19 10.5 0:03:18 4.2 Hollis/45th 0.22 0:01:17 10.3 0:01:25 9.3 0:02:53 4.6 Hollis/53rd 0.4 0:02:00 12.0 0:02:00 12.0 0:02:17 10.5 Hollis/59th 0.41 0:02:02 12.1 0:02:02 12.1 0:02:20 10.5 3 Hollis/65th 11.25 0:26:20 25.6 0:19:39 34.4 0:24:01 28.1 2 Richmond Pkwy Transit Center 4.13 0:09:49 25.2 0:08:36 28.8 0:09:49 25.2 1 Hercules Transit Center Total 18.44 0:50:27 21.9 0:43:39 25.3 0:53:16 20.8 | 0:03:41 0:03:07 0:01:50 0:01:19 0:01:25 0:02:00 0:02:02 0:19:39 0:08:36 | 0:03:41 0:03:07 0:01:50 0:03:18 0:02:53 0:02:17 0:02:20 0:24:01 0:09:49 | ||||
| 14.0 | 12.4 | 12.4 | ||||
| 14.8 | 13.1 | 13.1 | ||||
| 13.1 | 11.8 | 11.8 | ||||
| 10.5 | 10.5 | 4.2 | ||||
| 10.3 | 9.3 | 4.6 | ||||
| 12.0 | 12.0 | 10.5 | ||||
| 12.1 | 12.1 | 10.5 | ||||
| 25.6 | 34.4 | 28.1 | ||||
| 25.2 | 28.8 | 25.2 | ||||
| Total 18.44 0:50:27 21.9 0:43:39 25.3 0:53:16 20.8 |
| AM Peak Midday PM Peak Route 2B Southbound Distance Time Speed Time Speed Time Speed | ||||||
|---|---|---|---|---|---|---|
| 1 Hercules Transit Center 4.3 0:11:23 22.7 0:09:54 26.1 0:10:59 23.5 2 Richmond Pkwy Transit Center 14.52 0:30:17 28.8 0:26:43 32.6 0:26:43 32.6 3 19th Street BART 0.4 0:02:15 10.7 0:02:32 9.5 0:02:32 9.5 4 12th Street BART 0.35 0:01:48 11.7 0:02:03 10.2 0:02:03 10.2 7th/Broadway 0.17 0:01:05 9.4 0:01:11 8.6 0:01:11 8.6 3rd/Broadway 0.13 0:01:10 6.7 0:01:15 6.2 0:01:15 6.2 4 2nd/Washington (J. London Sq.) Total 19.87 0:47:58 24.9 0:43:38 27.3 0:44:43 26.7 | 0:09:54 0:26:43 0:02:32 0:02:03 0:01:11 0:01:15 | 0:10:59 0:26:43 0:02:32 0:02:03 0:01:11 0:01:15 | ||||
| 22.7 | 26.1 | 23.5 | ||||
| 28.8 | 32.6 | 32.6 | ||||
| 10.7 | 9.5 | 9.5 | ||||
| 11.7 | 10.2 | 10.2 | ||||
| 9.4 | 8.6 | 8.6 | ||||
| 6.7 | 6.2 | 6.2 | ||||
| Total 19.87 0:47:58 24.9 0:43:38 27.3 0:44:43 26.7 |
| AM Peak Midday PM Peak Route 2B Northbound Distance Time Speed Time Speed Time Speed | ||||||
|---|---|---|---|---|---|---|
| 5 2nd/Washington (J. London Sq.) 0.16 0:01:08 8.5 0:01:08 8.5 0:01:18 7.4 3rd/Broadway 0.23 0:01:28 9.4 0:01:28 9.4 0:01:44 8.0 7th/Broadway 0.35 0:02:18 9.1 0:02:18 9.1 0:02:42 7.8 4 12th Street BART 0.4 0:02:32 9.5 0:02:32 9.5 0:03:00 8.0 3 19th Street BART 14.4 0:33:02 26.2 0:27:43 31.2 0:31:22 27.5 2 Richmond Pkwy Transit Center 4.13 0:09:49 25.2 0:08:36 28.8 0:09:49 25.2 1 Hercules Transit Center Total 19.67 0:50:17 23.5 0:43:45 27.0 0:49:55 23.6 | 0:01:08 0:01:28 0:02:18 0:02:32 0:27:43 0:08:36 | 0:01:18 0:01:44 0:02:42 0:03:00 0:31:22 0:09:49 | ||||
| 8.5 | 8.5 | 7.4 | ||||
| 9.4 | 9.4 | 8.0 | ||||
| 9.1 | 9.1 | 7.8 | ||||
| 9.5 | 9.5 | 8.0 | ||||
| 26.2 | 31.2 | 27.5 | ||||
| 25.2 | 28.8 | 25.2 | ||||
| Total 19.67 0:50:17 23.5 0:43:45 27.0 0:49:55 23.6 |
Proposed Service Plans | November 2019 AM Peak Midday PM Peak AM Peak Midday PM Peak Route 2A Southbound Distance Time Speed Time Speed Time Speed Route 2A Northbound Distance Time Speed Time Speed Time Speed Hercules Transit Center MacArthur/Broadway 4.3 0:11:23 22.7 0:09:54 26.1 0:10:59 23.5 0.76 0:03:16 14.0 0:03:41 12.4 0:03:41 12.4 Richmond Pkwy Transit Center MacArthur BART 11.55 0:24:34 28.2 0:18:42 37.1 0:21:49 31.8 0.68 0:02:45 14.8 0:03:07 13.1 0:03:07 13.1 Hollis/65th 40th/Adeline 0.4 0:02:00 12.0 0:02:00 12.0 0:02:17 10.5 0.36 0:01:39 13.1 0:01:50 11.8 0:01:50 11.8 Hollis/59th 40th/Hollis 0.38 0:01:55 11.9 0:01:55 11.9 0:02:12 10.4 0.23 0:01:19 10.5 0:01:19 10.5 0:03:18 4.2 Hollis/53rd Hollis/45th 0.22 0:01:17 10.3 0:01:17 10.3 0:01:25 9.3 0.22 0:01:17 10.3 0:01:25 9.3 0:02:53 4.6 Hollis/45th Hollis/53rd 0.21 0:01:05 11.6 0:01:23 9.1 0:01:23 9.1 0.4 0:02:00 12.0 0:02:00 12.0 0:02:17 10.5 40th/Hollis Hollis/59th 0.38 0:01:43 13.3 0:01:55 11.9 0:01:55 11.9 0.41 0:02:02 12.1 0:02:02 12.1 0:02:20 10.5 40th/Adeline Hollis/65th 0.66 0:02:56 13.5 0:03:17 12.1 0:03:17 12.1 11.25 0:26:20 25.6 0:19:39 34.4 0:24:01 28.1 MacArthur BART Richmond Pkwy Transit Center 0.83 0:03:16 15.2 0:03:43 13.4 0:03:43 13.4 4.13 0:09:49 25.2 0:08:36 28.8 0:09:49 25.2 MacArthur/Broadway Hercules Transit Center Total 18.93 0:50:09 22.6 0:44:06 25.8 0:49:00 23.2 Total 18.44 0:50:27 21.9 0:43:39 25.3 0:53:16 20.8 AM Peak Midday PM Peak AM Peak Midday PM Peak Route 2B Southbound Distance Time Speed Time Speed Time Speed Route 2B Northbound Distance Time Speed Time Speed Time Speed Hercules Transit Center 2nd/Washington (J. London Sq.)
4.3 0:11:23 22.7 0:09:54 26.1 0:10:59 23.5 0.16 0:01:08 8.5 0:01:08 8.5 0:01:18 7.4 Richmond Pkwy Transit Center 3rd/Broadway 14.52 0:30:17 28.8 0:26:43 32.6 0:26:43 32.6 0.23 0:01:28 9.4 0:01:28 9.4 0:01:44 8.0 19th Street BART 7th/Broadway 0.4 0:02:15 10.7 0:02:32 9.5 0:02:32 9.5 0.35 0:02:18 9.1 0:02:18 9.1 0:02:42 7.8 12th Street BART 12th Street BART 0.35 0:01:48 11.7 0:02:03 10.2 0:02:03 10.2 0.4 0:02:32 9.5 0:02:32 9.5 0:03:00 8.0 7th/Broadway 19th Street BART 0.17 0:01:05 9.4 0:01:11 8.6 0:01:11 8.6 14.4 0:33:02 26.2 0:27:43 31.2 0:31:22 27.5 3rd/Broadway Richmond Pkwy Transit Center 0.13 0:01:10 6.7 0:01:15 6.2 0:01:15 6.2 4.13 0:09:49 25.2 0:08:36 28.8 0:09:49 25.2 2nd/Washington (J. London Sq.)
Hercules Transit Center Total 19.87 0:47:58 24.9 0:43:38 27.3 0:44:43 26.7 Total 19.67 0:50:17 23.5 0:43:45 27.0 0:49:55 23.6
Original PDF, page 173
| AM Peak Midday PM Peak Route 3 Southbound Distance Time Speed Time Speed Time Speed | ||||||
|---|---|---|---|---|---|---|
| 1 San Pablo/Pinole Shores 0.4 0:01:47 13.5 0:02:00 12.0 0:02:00 12.0 Del Monte Dr 0.42 0:01:51 13.6 0:02:05 12.1 0:02:05 12.1 Tara Hills Dr 0.38 0:01:43 13.3 0:01:55 11.9 0:01:55 11.9 Shamrock Dr 1.08 0:04:07 15.7 0:04:43 13.7 0:04:43 13.7 Bella Vista Apts 0.45 0:03:17 8.2 0:03:17 8.2 0:03:17 8.2 2 Richmond Pkwy Transit Center 14.52 0:30:17 28.8 0:26:43 32.6 0:26:43 32.6 3 19th Street BART 0.4 0:02:15 10.7 0:02:32 9.5 0:02:32 9.5 4 12th Street BART 0.35 0:01:48 11.7 0:02:03 10.2 0:02:03 10.2 7th/Broadway 0.17 0:01:05 9.4 0:01:11 8.6 0:01:11 8.6 3rd/Broadway 0.13 0:01:10 6.7 0:01:15 6.2 0:01:15 6.2 5 2nd/Washington (J. London Sq.) Total 18.30 0:49:20 22.3 0:47:44 23.0 0:47:44 23.0 | 0:02:00 0:02:05 0:01:55 0:04:43 0:03:17 0:26:43 0:02:32 0:02:03 0:01:11 0:01:15 | 0:02:00 0:02:05 0:01:55 0:04:43 0:03:17 0:26:43 0:02:32 0:02:03 0:01:11 0:01:15 | ||||
| 13.5 | 12.0 | 12.0 | ||||
| 13.6 | 12.1 | 12.1 | ||||
| 13.3 | 11.9 | 11.9 | ||||
| 15.7 | 13.7 | 13.7 | ||||
| 8.2 | 8.2 | 8.2 | ||||
| 28.8 | 32.6 | 32.6 | ||||
| 10.7 | 9.5 | 9.5 | ||||
| 11.7 | 10.2 | 10.2 | ||||
| 9.4 | 8.6 | 8.6 | ||||
| 6.7 | 6.2 | 6.2 | ||||
| Total 18.30 0:49:20 22.3 0:47:44 23.0 0:47:44 23.0 |
| AM Peak Midday PM Peak Route 3 Northbound Distance Time Speed Time Speed Time Speed | ||||||
|---|---|---|---|---|---|---|
| 1 2nd/Washington (J. London Sq.) Station to station (arterial) 0.16 0:01:08 8.5 0:01:08 8.5 0:01:18 7.4 3rd/Broadway Station to station (arterial) 0.23 0:01:28 9.4 0:01:28 9.4 0:01:44 8.0 7th/Broadway Station to station (arterial) 0.35 0:02:18 9.1 0:02:18 9.1 0:02:42 7.8 2 12th Street BART Station to station (arterial) 0.4 0:02:32 9.5 0:02:32 9.5 0:03:00 8.0 3 19th Street BART I-80 ramp to TC 14.27 0:31:45 27.0 0:26:35 32.2 0:30:14 28.3 4 Richmond Pkwy Transit Center Station to station (arterial) 0.56 0:02:07 15.9 0:02:07 15.9 0:02:20 14.4 Bella Vista Apts Station to station (arterial) 1.02 0:03:30 17.5 0:03:30 17.5 0:03:55 15.6 Shamrock Dr Station to station (arterial) 0.38 0:01:35 14.4 0:01:35 14.4 0:01:43 13.3 Tara Hills Dr Station to station (arterial) 0.4 0:01:39 14.5 0:01:39 14.5 0:01:47 13.5 Del Monte Dr Station to station (arterial) 0.3 0:01:21 13.3 0:01:21 13.3 0:01:27 12.4 5 San Pablo/Crestview Total 18.07 0:49:23 22.0 0:44:13 24.5 0:50:10 21.6 | 0:01:08 0:01:28 0:02:18 0:02:32 0:26:35 0:02:07 0:03:30 0:01:35 0:01:39 0:01:21 | 0:01:18 0:01:44 0:02:42 0:03:00 0:30:14 0:02:20 0:03:55 0:01:43 0:01:47 0:01:27 | ||||
| 8.5 | 8.5 | 7.4 | ||||
| 9.4 | 9.4 | 8.0 | ||||
| 9.1 | 9.1 | 7.8 | ||||
| 9.5 | 9.5 | 8.0 | ||||
| 27.0 | 32.2 | 28.3 | ||||
| 15.9 | 15.9 | 14.4 | ||||
| 17.5 | 17.5 | 15.6 | ||||
| 14.4 | 14.4 | 13.3 | ||||
| 14.5 | 14.5 | 13.5 | ||||
| 13.3 | 13.3 | 12.4 | ||||
| Total 18.07 0:49:23 22.0 0:44:13 24.5 0:50:10 21.6 |
| AM Peak Midday PM Peak Route 4 Southbound Distance Time Speed Time Speed Time Speed | ||||||
|---|---|---|---|---|---|---|
| 1 San Pablo/Crestview 0.4 0:01:47 13.5 0:02:00 12.0 0:01:32 15.7 Del Monte Dr 0.42 0:01:51 13.6 0:02:05 12.1 0:01:35 15.9 Tara Hills Dr 0.38 0:01:43 13.3 0:01:55 11.9 0:01:29 15.4 Shamrock Dr 1.08 0:04:07 15.7 0:04:43 13.7 0:03:21 19.3 Bella Vista Apts 0.45 0:03:17 8.2 0:03:17 8.2 0:02:57 9.2 2 Richmond Pkwy Transit Center 18.75 0:39:10 28.7 0:35:10 32.0 0:41:32 27.1 3 SF Transbay Terminal Total 21.48 0:51:55 24.8 0:49:10 26.2 0:52:26 24.6 | 0:02:00 0:02:05 0:01:55 0:04:43 0:03:17 0:35:10 | 0:01:32 0:01:35 0:01:29 0:03:21 0:02:57 0:41:32 | ||||
| 13.5 | 12.0 | 15.7 | ||||
| 13.6 | 12.1 | 15.9 | ||||
| 13.3 | 11.9 | 15.4 | ||||
| 15.7 | 13.7 | 19.3 | ||||
| 8.2 | 8.2 | 9.2 | ||||
| 28.7 | 32.0 | 27.1 | ||||
| Total 21.48 0:51:55 24.8 0:49:10 26.2 0:52:26 24.6 |
| AM Peak Midday PM Peak Route 4 Northbound Distance Time Speed Time Speed Time Speed | ||||||
|---|---|---|---|---|---|---|
| 3 SF Transbay Terminal 18.72 0:51:27 21.8 0:35:06 32.0 0:39:07 28.7 2 Richmond Pkwy Transit Center 0.56 0:02:07 15.9 0:02:07 15.9 0:02:20 14.4 Bella Vista Apts 1.02 0:03:30 17.5 0:03:30 17.5 0:03:55 15.6 Shamrock Dr 0.38 0:01:35 14.4 0:01:35 14.4 0:01:43 13.3 Tara Hills Dr 0.4 0:01:39 14.5 0:01:39 14.5 0:01:47 13.5 Del Monte Dr 0.3 0:01:21 13.3 0:01:21 13.3 0:01:27 12.4 1 San Pablo/Crestview Total 21.38 1:01:39 20.8 0:45:18 28.3 0:50:19 25.5 | 0:35:06 0:02:07 0:03:30 0:01:35 0:01:39 0:01:21 | 0:39:07 0:02:20 0:03:55 0:01:43 0:01:47 0:01:27 | ||||
| 21.8 | 32.0 | 28.7 | ||||
| 15.9 | 15.9 | 14.4 | ||||
| 17.5 | 17.5 | 15.6 | ||||
| 14.4 | 14.4 | 13.3 | ||||
| 14.5 | 14.5 | 13.5 | ||||
| 13.3 | 13.3 | 12.4 | ||||
| Total 21.38 1:01:39 20.8 0:45:18 28.3 0:50:19 25.5 |
Proposed Service Plans | November 2019 AM Peak Midday PM Peak AM Peak Midday PM Peak Route 3 Southbound Distance Time Speed Time Speed Time Speed Route 3 Northbound Distance Time Speed Time Speed Time Speed San Pablo/Pinole Shores 2nd/Washington (J. London Sq.)
0.4 0:01:47 13.5 0:02:00 12.0 0:02:00 12.0 Station to station (arterial) 0.16 0:01:08 8.5 0:01:08 8.5 0:01:18 7.4 Del Monte Dr 3rd/Broadway 0.42 0:01:51 13.6 0:02:05 12.1 0:02:05 12.1 Station to station (arterial) 0.23 0:01:28 9.4 0:01:28 9.4 0:01:44 8.0 Tara Hills Dr 7th/Broadway 0.38 0:01:43 13.3 0:01:55 11.9 0:01:55 11.9 Station to station (arterial) 0.35 0:02:18 9.1 0:02:18 9.1 0:02:42 7.8 Shamrock Dr 12th Street BART 1.08 0:04:07 15.7 0:04:43 13.7 0:04:43 13.7 Station to station (arterial) 0.4 0:02:32 9.5 0:02:32 9.5 0:03:00 8.0 Bella Vista Apts 19th Street BART 0.45 0:03:17 8.2 0:03:17 8.2 0:03:17 8.2 I-80 ramp to TC 14.27 0:31:45 27.0 0:26:35 32.2 0:30:14 28.3 Richmond Pkwy Transit Center Richmond Pkwy Transit Center 14.52 0:30:17 28.8 0:26:43 32.6 0:26:43 32.6 Station to station (arterial) 0.56 0:02:07 15.9 0:02:07 15.9 0:02:20 14.4 19th Street BART Bella Vista Apts 0.4 0:02:15 10.7 0:02:32 9.5 0:02:32 9.5 Station to station (arterial) 1.02 0:03:30 17.5 0:03:30 17.5 0:03:55 15.6 12th Street BART Shamrock Dr 0.35 0:01:48 11.7 0:02:03 10.2 0:02:03 10.2 Station to station (arterial) 0.38 0:01:35 14.4 0:01:35 14.4 0:01:43 13.3 7th/Broadway Tara Hills Dr 0.17 0:01:05 9.4 0:01:11 8.6 0:01:11 8.6 Station to station (arterial) 0.4 0:01:39 14.5 0:01:39 14.5 0:01:47 13.5 3rd/Broadway Del Monte Dr 0.13 0:01:10 6.7 0:01:15 6.2 0:01:15 6.2 Station to station (arterial) 0.3 0:01:21 13.3 0:01:21 13.3 0:01:27 12.4 2nd/Washington (J. London Sq.)
San Pablo/Crestview Total 18.30 0:49:20 22.3 0:47:44 23.0 0:47:44 23.0 Total 18.07 0:49:23 22.0 0:44:13 24.5 0:50:10 21.6 AM Peak Midday PM Peak AM Peak Midday PM Peak Route 4 Southbound Distance Time Speed Time Speed Time Speed Route 4 Northbound Distance Time Speed Time Speed Time Speed San Pablo/Crestview SF Transbay Terminal 0.4 0:01:47 13.5 0:02:00 12.0 0:01:32 15.7 18.72 0:51:27 21.8 0:35:06 32.0 0:39:07 28.7 Del Monte Dr Richmond Pkwy Transit Center 0.42 0:01:51 13.6 0:02:05 12.1 0:01:35 15.9 0.56 0:02:07 15.9 0:02:07 15.9 0:02:20 14.4 Tara Hills Dr Bella Vista Apts 0.38 0:01:43 13.3 0:01:55 11.9 0:01:29 15.4 1.02 0:03:30 17.5 0:03:30 17.5 0:03:55 15.6 Shamrock Dr Shamrock Dr 1.08 0:04:07 15.7 0:04:43 13.7 0:03:21 19.3 0.38 0:01:35 14.4 0:01:35 14.4 0:01:43 13.3 Bella Vista Apts Tara Hills Dr 0.45 0:03:17 8.2 0:03:17 8.2 0:02:57 9.2 0.4 0:01:39 14.5 0:01:39 14.5 0:01:47 13.5 Richmond Pkwy Transit Center Del Monte Dr 18.75 0:39:10 28.7 0:35:10 32.0 0:41:32 27.1 0.3 0:01:21 13.3 0:01:21 13.3 0:01:27 12.4 SF Transbay Terminal San Pablo/Crestview Total 21.48 0:51:55 24.8 0:49:10 26.2 0:52:26 24.6 Total 21.38 1:01:39 20.8 0:45:18 28.3 0:50:19 25.5
Original PDF, page 174
| AM Peak Midday PM Peak Route 5 Southbound Distance Time Speed Time Speed Time Speed | ||||||
|---|---|---|---|---|---|---|
| 1 Contra Costa College 2.65 0:08:17 19.2 0:10:15 15.5 0:10:15 15.5 2 El Sobrante P&R 16.35 0:35:03 28.0 0:31:34 31.1 0:37:06 26.4 3 SF Transbay Terminal Total 19.00 0:43:20 26.3 0:41:49 27.3 0:47:21 24.1 | 0:10:15 0:31:34 | 0:10:15 0:37:06 | ||||
| 19.2 | 15.5 | 15.5 | ||||
| 28.0 | 31.1 | 26.4 | ||||
| Total 19.00 0:43:20 26.3 0:41:49 27.3 0:47:21 24.1 |
| AM Peak Midday PM Peak Route 5 Northbound Distance Time Speed Time Speed Time Speed | ||||||
|---|---|---|---|---|---|---|
| 3 SF Transbay Terminal 16.37 0:45:48 21.4 0:31:35 31.1 0:35:05 28.0 2 El Sobrante P&R 2.70 0:07:55 20.5 0:09:56 16.3 0:09:56 16.3 1 Contra Costa College Total 19.07 0:53:43 21.2 0:41:31 27.5 0:45:01 25.3 | 0:31:35 0:09:56 | 0:35:05 0:09:56 | ||||
| 21.4 | 31.1 | 28.0 | ||||
| 20.5 | 16.3 | 16.3 | ||||
| Total 19.07 0:53:43 21.2 0:41:31 27.5 0:45:01 25.3 |
Proposed Service Plans | November 2019 AM Peak Midday PM Peak AM Peak Midday PM Peak Route 5 Southbound Distance Time Speed Time Speed Time Speed Route 5 Northbound Distance Time Speed Time Speed Time Speed Contra Costa College SF Transbay Terminal 2.65 0:08:17 19.2 0:10:15 15.5 0:10:15 15.5 16.37 0:45:48 21.4 0:31:35 31.1 0:35:05 28.0 El Sobrante P&R El Sobrante P&R 16.35 0:35:03 28.0 0:31:34 31.1 0:37:06 26.4 2.70 0:07:55 20.5 0:09:56 16.3 0:09:56 16.3 SF Transbay Terminal Contra Costa College Total 19.00 0:43:20 26.3 0:41:49 27.3 0:47:21 24.1 Total 19.07 0:53:43 21.2 0:41:31 27.5 0:45:01 25.3 AM Peak Midday PM Peak AM Peak Midday PM Peak Route 6 Southbound Distance Time Speed Time Speed Time Speed Route 6 Northbound Distance Time Speed Time Speed Time Speed Contra Costa College 2nd/Washington (J. London Sq.)
0.48 0:02:04 13.9 0:02:04 13.9 0:02:04 13.9 0.16 0:01:08 8.5 0:01:08 8.5 0:01:18 7.4 Stone St 3rd/Broadway 0.53 0:02:14 14.2 0:02:14 14.2 0:02:14 14.2 0.23 0:01:28 9.4 0:01:28 9.4 0:01:44 8.0 Dover Ave 7th/Broadway 0.58 0:02:24 14.5 0:02:24 14.5 0:02:24 14.5 0.35 0:02:18 9.1 0:02:18 9.1 0:02:42 7.8 Rheem Ave 12th Street BART 0.42 0:01:51 13.6 0:01:51 13.6 0:01:51 13.6 0.4 0:02:32 9.5 0:02:32 9.5 0:03:00 8.0 Garvin Ave 19th Street BART 0.52 0:02:12 14.2 0:02:12 14.2 0:02:12 14.2 0.68 0:02:45 14.8 0:02:45 14.8 0:02:45 14.8 Nevin Ave 40th/Adeline 0.4 0:01:47 13.5 0:01:47 13.5 0:01:47 13.5 0.36 0:01:39 13.1 0:01:39 13.1 0:01:39 13.1 Broadway 40th/Hollis 0.47 0:02:02 13.9 0:02:02 13.9 0:02:02 13.9 0.23 0:01:19 10.5 0:01:19 10.5 0:01:19 10.5 37th St Hollis/45th 0.55 0:03:03 10.8 0:03:03 10.8 0:03:03 10.8 0.22 0:01:17 10.3 0:01:17 10.3 0:01:17 10.3 Richmond East P&R Hollis/53rd 7.73 0:16:22 28.3 0:15:01 30.9 0:14:52 31.2 0.4 0:02:00 12.0 0:02:00 12.0 0:02:00 12.0 Hollis/65th Hollis/59th 0.4 0:02:00 12.0 0:02:00 12.0 0:02:00 12.0 0.41 0:02:02 12.1 0:02:02 12.1 0:02:02 12.1 Hollis/59th Hollis/65th 0.38 0:01:55 11.9 0:01:55 11.9 0:01:55 11.9 6.9 0:15:50 26.1 0:13:09 31.5 0:14:55 27.8 Hollis/53rd Richmond East P&R 0.22 0:01:17 10.3 0:01:17 10.3 0:01:17 10.3 0.6 0:02:29 14.5 0:02:29 14.5 0:02:29 14.5 Hollis/45th 37th St 0.21 0:01:14 10.2 0:02:31 5.0 0:01:14 10.2 0.5 0:02:08 14.1 0:02:08 14.1 0:02:08 14.1 40th/Hollis Broadway 0.4 0:01:47 13.5 0:01:47 13.5 0:01:47 13.5 0.36 0:01:39 13.1 0:01:39 13.1 0:01:39 13.1 40th/Adeline Nevin Ave 1.19 0:04:45 15.0 0:04:45 15.0 0:04:45 15.0 0.42 0:01:51 13.6 0:01:51 13.6 0:01:51 13.6 19th Street BART Garvin Ave 0.4 0:02:15 10.7 0:02:32 9.5 0:02:32 9.5 0.4 0:01:47 13.5 0:01:47 13.5 0:01:47 13.5 12th Street BART Rheem Ave 0.35 0:01:48 11.7 0:02:03 10.2 0:02:03 10.2 0.64 0:02:37 14.7 0:02:37 14.7 0:02:37 14.7 7th/Broadway Dover Ave 0.18 0:01:07 9.7 0:01:14 8.8 0:01:14 8.8 0.58 0:02:24 14.5 0:02:24 14.5 0:02:24 14.5 3rd/Broadway Stone St 0.15 0:02:22 3.8 0:01:20 6.7 0:01:20 6.7 0.43 0:02:09 12.0 0:02:09 12.0 0:02:09 12.0 2nd/Washington (J. London Sq.)
Contra Costa College Total 15.56 0:54:29 17.1 0:54:02 17.3 0:52:36 17.7 Total 14.27 0:51:22 18.2 0:48:41 19.2 0:51:45 18.0
Original PDF, page 175
| AM Peak Midday PM Peak Route 7 Southbound Distance Time Speed Time Speed Time Speed | ||||||
|---|---|---|---|---|---|---|
| 1 Contra Costa College 0.48 0:02:04 13.9 0:02:04 13.9 0:02:04 13.9 Stone St 0.53 0:02:14 14.2 0:02:14 14.2 0:02:14 14.2 Dover Ave 0.58 0:02:24 14.5 0:02:24 14.5 0:02:24 14.5 Rheem Ave 0.42 0:01:51 13.6 0:01:51 13.6 0:01:51 13.6 Garvin Ave 0.52 0:02:08 14.6 0:02:08 14.6 0:02:08 14.6 Nevin Ave 0.4 0:01:47 13.5 0:01:47 13.5 0:01:47 13.5 Broadway 0.47 0:02:02 13.9 0:02:02 13.9 0:02:02 13.9 37th St 0.55 0:03:03 10.8 0:03:03 10.8 0:03:03 10.8 2 Richmond East P&R 5.06 0:10:13 29.7 0:08:21 36.4 0:08:18 36.6 3 Gilman/6th 0.5 0:02:24 12.5 0:02:46 10.8 0:02:46 10.8 6th/Virginia 0.35 0:01:48 11.7 0:02:03 10.2 0:02:03 10.2 University/6th 0.32 0:01:31 12.7 0:01:41 11.4 0:01:54 10.1 University/San Pablo 1.05 0:04:01 15.7 0:04:36 13.7 0:05:25 11.6 University/MLK 0.35 0:01:52 11.3 0:02:03 10.2 0:02:18 9.1 4 Downtown Berkeley BART 0.27 0:01:21 12.0 0:01:29 10.9 0:01:40 9.7 Shattuck/Durant 0.2 0:01:12 10.0 0:01:20 9.0 0:01:20 9.0 5 Shattuck/Dwight Total 12.05 0:41:55 17.2 0:41:52 17.3 0:43:17 16.7 | 0:02:04 0:02:14 0:02:24 0:01:51 0:02:08 0:01:47 0:02:02 0:03:03 0:08:21 0:02:46 0:02:03 0:01:41 0:04:36 0:02:03 0:01:29 0:01:20 | 0:02:04 0:02:14 0:02:24 0:01:51 0:02:08 0:01:47 0:02:02 0:03:03 0:08:18 0:02:46 0:02:03 0:01:54 0:05:25 0:02:18 0:01:40 0:01:20 | ||||
| 13.9 | 13.9 | 13.9 | ||||
| 14.2 | 14.2 | 14.2 | ||||
| 14.5 | 14.5 | 14.5 | ||||
| 13.6 | 13.6 | 13.6 | ||||
| 14.6 | 14.6 | 14.6 | ||||
| 13.5 | 13.5 | 13.5 | ||||
| 13.9 | 13.9 | 13.9 | ||||
| 10.8 | 10.8 | 10.8 | ||||
| 29.7 | 36.4 | 36.6 | ||||
| 12.5 | 10.8 | 10.8 | ||||
| 11.7 | 10.2 | 10.2 | ||||
| 12.7 | 11.4 | 10.1 | ||||
| 15.7 | 13.7 | 11.6 | ||||
| 11.3 | 10.2 | 9.1 | ||||
| 12.0 | 10.9 | 9.7 | ||||
| 10.0 | 9.0 | 9.0 | ||||
| Total 12.05 0:41:55 17.2 0:41:52 17.3 0:43:17 16.7 |
| AM Peak Midday PM Peak Route 7 Northbound Distance Time Speed Time Speed Time Speed | ||||||
|---|---|---|---|---|---|---|
| 5 Shattuck/Dwight 0.2 0:01:12 10.0 0:01:20 9.0 0:01:20 9.0 Shattuck/Durant 0.27 0:01:36 10.1 0:01:44 9.3 0:01:55 8.5 4 Downtown Berkeley BART 0.35 0:01:37 13.0 0:01:48 11.7 0:02:03 10.2 University/MLK 1.05 0:04:01 15.7 0:04:36 13.7 0:05:25 11.6 University/San Pablo 0.32 0:01:31 12.7 0:01:41 11.4 0:01:54 10.1 University/6th 0.35 0:01:48 11.7 0:02:03 10.2 0:02:03 10.2 6th/Virginia 0.5 0:02:24 12.5 0:02:46 10.8 0:02:46 10.8 3 Gilman/6th 4.58 0:11:36 23.7 0:07:49 35.2 0:10:13 26.9 2 Richmond East P&R 0.6 0:02:29 14.5 0:02:29 14.5 0:02:29 14.5 37th St 0.5 0:02:08 14.1 0:02:08 14.1 0:02:08 14.1 Broadway 0.36 0:01:39 13.1 0:01:39 13.1 0:01:39 13.1 Nevin Ave 0.42 0:01:47 14.1 0:01:47 14.1 0:01:47 14.1 Garvin Ave 0.4 0:01:47 13.5 0:01:47 13.5 0:01:47 13.5 Rheem Ave 0.64 0:02:37 14.7 0:02:37 14.7 0:02:37 14.7 Dover Ave 0.58 0:02:24 14.5 0:02:24 14.5 0:02:24 14.5 Stone St 0.43 0:02:09 12.0 0:02:09 12.0 0:02:09 12.0 1 Contra Costa College Total 11.55 0:42:45 16.9 0:40:47 17.7 0:44:39 16.2 | 0:01:20 0:01:44 0:01:48 0:04:36 0:01:41 0:02:03 0:02:46 0:07:49 0:02:29 0:02:08 0:01:39 0:01:47 0:01:47 0:02:37 0:02:24 0:02:09 | 0:01:20 0:01:55 0:02:03 0:05:25 0:01:54 0:02:03 0:02:46 0:10:13 0:02:29 0:02:08 0:01:39 0:01:47 0:01:47 0:02:37 0:02:24 0:02:09 | ||||
| 10.0 | 9.0 | 9.0 | ||||
| 10.1 | 9.3 | 8.5 | ||||
| 13.0 | 11.7 | 10.2 | ||||
| 15.7 | 13.7 | 11.6 | ||||
| 12.7 | 11.4 | 10.1 | ||||
| 11.7 | 10.2 | 10.2 | ||||
| 12.5 | 10.8 | 10.8 | ||||
| 23.7 | 35.2 | 26.9 | ||||
| 14.5 | 14.5 | 14.5 | ||||
| 14.1 | 14.1 | 14.1 | ||||
| 13.1 | 13.1 | 13.1 | ||||
| 14.1 | 14.1 | 14.1 | ||||
| 13.5 | 13.5 | 13.5 | ||||
| 14.7 | 14.7 | 14.7 | ||||
| 14.5 | 14.5 | 14.5 | ||||
| 12.0 | 12.0 | 12.0 | ||||
| Total 11.55 0:42:45 16.9 0:40:47 17.7 0:44:39 16.2 |
| AM Peak Midday PM Peak Route 8 Southbound Distance Time Speed Time Speed Time Speed | AM Peak Midday PM Peak Route 8 Northbound Distance Time Speed Time Speed Time Speed 5 2nd/Washington (J. London Sq.) 0.16 0:00:58 9.9 0:01:02 9.3 0:01:02 9.3 3rd/Broadway 0.23 0:01:12 11.5 0:01:19 10.5 0:01:19 10.5 7th/Broadway 0.35 0:02:03 10.2 0:02:18 9.1 0:02:18 9.1 4 12th Street BART 0.4 0:02:15 10.7 0:02:32 9.5 0:02:32 9.5 3 19th Street BART 11.05 0:16:12 40.9 0:17:09 38.7 0:21:56 30.2 2 Richmond West P&R 0.25 0:01:34 9.6 0:01:34 9.6 0:01:51 8.1 Maine Ave 0.56 0:03:03 11.0 0:03:03 11.0 0:03:42 9.1 MacDonald Ave 0.26 0:01:37 9.6 0:01:37 9.6 0:01:54 8.2 Roosevelt Ave 0.75 0:02:28 18.2 0:02:28 18.2 0:02:28 18.2 Rheem Ave 0.63 0:02:09 17.6 0:02:09 17.6 0:02:09 17.6 Market Ave 0.45 0:01:40 16.2 0:01:40 16.2 0:01:40 16.2 Road 20 0.55 0:01:56 17.1 0:01:56 17.1 0:01:56 17.1 Broadway 0.33 0:01:36 12.4 0:01:36 12.4 0:01:36 12.4 1 Contra Costa College Total 15.97 0:38:43 24.8 0:40:23 23.8 0:46:23 20.7 | ||||||
|---|---|---|---|---|---|---|---|
| 1 Contra Costa College 0.33 0:01:12 16.5 0:01:12 16.5 0:01:26 13.8 Broadway 0.53 0:01:36 19.9 0:01:36 19.9 0:02:02 15.6 Road 20 0.46 0:01:28 18.8 0:01:28 18.8 0:01:49 15.2 Market Ave 0.65 0:01:51 21.1 0:01:51 21.1 0:02:24 16.3 Rheem Ave 0.68 0:01:54 21.5 0:01:54 21.5 0:02:29 16.4 Roosevelt Ave 0.35 0:02:03 10.2 0:02:03 10.2 0:02:03 10.2 MacDonald Ave 0.48 0:02:40 10.8 0:02:40 10.8 0:02:40 10.8 Maine Ave 0.25 0:02:19 6.5 0:02:19 6.5 0:02:19 6.5 2 Richmond West P&R 11.22 0:18:53 35.7 0:19:14 35.0 0:18:38 36.1 3 19th Street BART 0.4 0:02:15 10.7 0:02:32 9.5 0:02:32 9.5 4 12th Street BART 0.35 0:01:48 11.7 0:02:03 10.2 0:02:03 10.2 7th/Broadway 0.18 0:01:02 10.5 0:01:07 9.7 0:01:07 9.7 3rd/Broadway 0.15 0:01:11 7.6 0:01:15 7.2 0:01:15 7.2 5 2nd/Washington (J. London Sq.) Total 16.03 0:40:12 23.9 0:41:14 23.3 0:42:47 22.5 | 0:01:12 0:01:36 0:01:28 0:01:51 0:01:54 0:02:03 0:02:40 0:02:19 0:19:14 0:02:32 0:02:03 0:01:07 0:01:15 | 0:01:26 0:02:02 0:01:49 0:02:24 0:02:29 0:02:03 0:02:40 0:02:19 0:18:38 0:02:32 0:02:03 0:01:07 0:01:15 | |||||
| 16.5 | 16.5 | 13.8 | |||||
| 19.9 | 19.9 | 15.6 | |||||
| 18.8 | 18.8 | 15.2 | |||||
| 21.1 | 21.1 | 16.3 | |||||
| 21.5 | 21.5 | 16.4 | |||||
| 10.2 | 10.2 | 10.2 | |||||
| 10.8 | 10.8 | 10.8 | |||||
| 6.5 | 6.5 | 6.5 | |||||
| 35.7 | 35.0 | 36.1 | |||||
| 10.7 | 9.5 | 9.5 | |||||
| 11.7 | 10.2 | 10.2 | |||||
| 10.5 | 9.7 | 9.7 | |||||
| 7.6 | 7.2 | 7.2 | |||||
| Total 16.03 0:40:12 23.9 0:41:14 23.3 0:42:47 22.5 |
Proposed Service Plans | November 2019 AM Peak Midday PM Peak AM Peak Midday PM Peak Route 7 Southbound Distance Time Speed Time Speed Time Speed Route 7 Northbound Distance Time Speed Time Speed Time Speed Contra Costa College Shattuck/Dwight 0.48 0:02:04 13.9 0:02:04 13.9 0:02:04 13.9 0.2 0:01:12 10.0 0:01:20 9.0 0:01:20 9.0 Stone St Shattuck/Durant 0.53 0:02:14 14.2 0:02:14 14.2 0:02:14 14.2 0.27 0:01:36 10.1 0:01:44 9.3 0:01:55 8.5 Dover Ave Downtown Berkeley BART 0.58 0:02:24 14.5 0:02:24 14.5 0:02:24 14.5 0.35 0:01:37 13.0 0:01:48 11.7 0:02:03 10.2 Rheem Ave University/MLK 0.42 0:01:51 13.6 0:01:51 13.6 0:01:51 13.6 1.05 0:04:01 15.7 0:04:36 13.7 0:05:25 11.6 Garvin Ave University/San Pablo 0.52 0:02:08 14.6 0:02:08 14.6 0:02:08 14.6 0.32 0:01:31 12.7 0:01:41 11.4 0:01:54 10.1 Nevin Ave University/6th 0.4 0:01:47 13.5 0:01:47 13.5 0:01:47 13.5 0.35 0:01:48 11.7 0:02:03 10.2 0:02:03 10.2 Broadway 6th/Virginia 0.47 0:02:02 13.9 0:02:02 13.9 0:02:02 13.9 0.5 0:02:24 12.5 0:02:46 10.8 0:02:46 10.8 37th St Gilman/6th 0.55 0:03:03 10.8 0:03:03 10.8 0:03:03 10.8 4.58 0:11:36 23.7 0:07:49 35.2 0:10:13 26.9 Richmond East P&R Richmond East P&R 5.06 0:10:13 29.7 0:08:21 36.4 0:08:18 36.6 0.6 0:02:29 14.5 0:02:29 14.5 0:02:29 14.5 Gilman/6th 37th St 0.5 0:02:24 12.5 0:02:46 10.8 0:02:46 10.8 0.5 0:02:08 14.1 0:02:08 14.1 0:02:08 14.1 6th/Virginia Broadway 0.35 0:01:48 11.7 0:02:03 10.2 0:02:03 10.2 0.36 0:01:39 13.1 0:01:39 13.1 0:01:39 13.1 University/6th Nevin Ave 0.32 0:01:31 12.7 0:01:41 11.4 0:01:54 10.1 0.42 0:01:47 14.1 0:01:47 14.1 0:01:47 14.1 University/San Pablo Garvin Ave 1.05 0:04:01 15.7 0:04:36 13.7 0:05:25 11.6 0.4 0:01:47 13.5 0:01:47 13.5 0:01:47 13.5 University/MLK Rheem Ave 0.35 0:01:52 11.3 0:02:03 10.2 0:02:18 9.1 0.64 0:02:37 14.7 0:02:37 14.7 0:02:37 14.7 Downtown Berkeley BART Dover Ave 0.27 0:01:21 12.0 0:01:29 10.9 0:01:40 9.7 0.58 0:02:24 14.5 0:02:24 14.5 0:02:24 14.5 Shattuck/Durant Stone St 0.2 0:01:12 10.0 0:01:20 9.0 0:01:20 9.0 0.43 0:02:09 12.0 0:02:09 12.0 0:02:09 12.0 Shattuck/Dwight Contra Costa College Total 12.05 0:41:55 17.2 0:41:52 17.3 0:43:17 16.7 Total 11.55 0:42:45 16.9 0:40:47 17.7 0:44:39 16.2
Original PDF, page 176
Proposed Service Plans | November 2019
Appendix B
Route Schedules
| Southbound | |||||
|---|---|---|---|---|---|
| 1 2 3 4 5 | |||||
| Hercules Transit Center | Richmond Pkwy Transit Center | Gilman / 6th | Downtown Berkeley BART | Shattuck / Dwight Way | Total |
| Mileage 4.3 8.8 2.6 0.5 16.2 | |||||
| AM Speed: | 11.0 18.0 12.0 3.0 22.7 30.0 13.3 11.1 | 44.0 22.1 | |||
| Midday Speed: | 10.0 15.0 13.0 3.0 26.1 35.2 11.7 10.0 | 41.0 23.7 | |||
| PM Speed: | 11.0 15.0 14.0 3.0 23.5 35.2 10.7 9.4 | 43.0 22.6 |
| Northbound | |||||
|---|---|---|---|---|---|
| 5 4 3 2 1 | |||||
| Shattuck / Dwight Way | Downtown Berkeley BART | Gilman / 6th | Richmond Pkwy Transit Center | Hercules Transit Center | Total |
| Mileage 0.45 2.6 8.7 4.1 15.9 | |||||
| AM Speed: | 3.0 12.0 22.0 10.0 9.9 13.7 24.2 25.2 | 47.0 20.3 | |||
| Midday Speed: | 3.0 13.0 13.0 9.0 9.1 12.0 39.1 28.8 | 38.0 25.1 | |||
| PM Speed: | 3.0 14.0 18.0 10.0 8.6 10.9 28.7 25.2 | 45.0 21.2 |
| All-Day Schedule (15-minute peak service) | ||
|---|---|---|
| Block Period DH-PO 1 2 3 4 5 LO DH to 1 Return to 1 DH-PI | Block Period DH-PO 5 4 3 2 1 LO DH to 5 Return to 5 DH-PI |
Proposed Service Plans | November 2019 Route 1 Hercules TC, Richmond TC Berkeley Southbound Northbound Mileage 4.3 8.8 2.6 0.5 16.2 Mileage 0.45 2.6 8.7 4.1 15.9 AM 11.0 18.0 12.0 3.0 44.0 AM 3.0 12.0 22.0 10.0 47.0 Speed:
22.7 30.0 13.3 11.1 22.1 Speed: 9.9 13.7 24.2 25.2 20.3 Midday 10.0 15.0 13.0 3.0 41.0 Midday 3.0 13.0 13.0 9.0 38.0 Speed: 26.1 35.2 11.7 10.0 23.7 Speed:
9.1 12.0 39.1 28.8 25.1 PM 11.0 15.0 14.0 3.0 43.0 PM 3.0 14.0 18.0 10.0 45.0 Speed: 23.5 35.2 10.7 9.4 22.6 Speed: 8.6 10.9 28.7 25.2 21.2 1-1 AM 0:07 5:00 AM 5:11 AM 5:29 AM 5:41 AM 5:44 AM 0:27 6:11 1-2 AM 0:07 5:30 AM 5:41 AM 5:59 AM 6:11 AM 6:14 AM 0:27 6:41 1-3 AM 0:07 6:00 AM 6:11 AM 6:29 AM 6:41 AM 6:44 AM 0:27 7:11 1-1 AM 6:30 AM 6:41 AM 6:59 AM 7:11 AM 7:14 AM 0:27 7:41 1-4 AM 0:07 6:45 AM 6:56 AM 7:14 AM 7:26 AM 7:29 AM 0:27 7:56 1-2 AM 7:00 AM 7:11 AM 7:29 AM 7:41 AM 7:44 AM 0:27 8:11 1-5 AM 0:07 7:15 AM 7:26 AM 7:44 AM 7:56 AM 7:59 AM 0:25 1-3 AM 7:30 AM 7:41 AM 7:59 AM 8:11 AM 8:14 AM 0:27 8:41 1-6 AM 0:07 7:45 AM 7:56 AM 8:14 AM 8:26 AM 8:29 AM 0:25 1-1 AM 8:00 AM 8:11 AM 8:29 AM 8:41 AM 8:44 AM 0:16 1-1 Midday 9:00 AM 9:03 AM 9:16 AM 9:29 AM 9:38 AM 0:22 1-4 AM 8:15 AM 8:26 AM 8:44 AM 8:56 AM 8:59 AM 0:25 1-2 AM 8:30 AM 8:41 AM 8:59 AM 9:11 AM 9:14 AM 0:25 1-3 AM 9:00 AM 9:11 AM 9:29 AM 9:41 AM 9:44 AM 0:25 1-1 Midday 10:00 AM 10:10 AM 10:25 AM 10:38 AM 10:41 AM 0:19 1-1 Midday 11:00 AM 11:03 AM 11:16 AM 11:29 AM 11:38 AM 0:22 1-1 Midday 12:00 PM 12:10 PM 12:25 PM 12:38 PM 12:41 PM 0:19 1-1 Midday 1:00 PM 1:03 PM 1:16 PM 1:29 PM 1:38 PM 0:22 1-1 Midday 2:00 PM 2:10 PM 2:25 PM 2:38 PM 2:41 PM 0:19 1-1 Midday 3:00 PM 3:03 PM 3:16 PM 3:29 PM 3:38 PM 0:27 4:05 PM 1-2 PM 0:25 3:30 PM 3:33 PM 3:47 PM 4:05 PM 4:15 PM 0:27 4:42 PM 1-3 PM 0:25 4:00 PM 4:03 PM 4:17 PM 4:35 PM 4:45 PM 0:27 5:12 PM 1-1 PM 4:15 PM 4:18 PM 4:32 PM 4:50 PM 5:00 PM 0:27 5:27 PM 1-4 PM 0:25 4:30 PM 4:33 PM 4:47 PM 5:05 PM 5:15 PM 0:27 5:42 PM 1-5 PM 0:25 4:45 PM 4:48 PM 5:02 PM 5:20 PM 5:30 PM 0:07 1-2 PM 5:00 PM 5:03 PM 5:17 PM 5:35 PM 5:45 PM 0:27 6:12 PM 1-6 PM 0:25 5:15 PM 5:18 PM 5:32 PM 5:50 PM 6:00 PM 0:07 1-3 PM 5:30 PM 5:33 PM 5:47 PM 6:05 PM 6:15 PM 0:27 6:42 PM 1-1 PM 5:45 PM 5:48 PM 6:02 PM 6:20 PM 6:30 PM 0:07 1-4 PM 6:00 PM 6:03 PM 6:17 PM 6:35 PM 6:45 PM 0:07 1-2 PM 6:30 PM 6:33 PM 6:47 PM 7:05 PM 7:15 PM 0:07 1-3 PM 7:00 PM 7:03 PM 7:17 PM 7:35 PM 7:45 PM 0:07 Summary of Service Block Hrs.
Hrs. Miles 1-1 0.56 13.50 192.5 1-2 0.31 7.48 96.2 1-3 0.31 7.48 96.2 1-4 0.19 4.48 64.2 1-5 0.06 1.48 32.1 1-6 0.06 1.48 32.1 Rev. 35.92 513.28 DH 11.87 405.00 Total 47.78 918.28
Original PDF, page 178
| Peak Period Only Schedule | ||
|---|---|---|
| Block Period DH-PO 1 2 3 4 5 LO DH to 1 Return to 1 DH-PI | Block Period DH-PO 5 4 3 2 1 LO DH to 5 Return to 5 DH-PI |
Proposed Service Plans | November 2019 1-1 AM 0:07 5:00 AM 5:11 AM 5:29 AM 5:41 AM 5:44 AM 0:27 6:11 1-2 AM 0:07 5:30 AM 5:41 AM 5:59 AM 6:11 AM 6:14 AM 0:27 6:41 1-3 AM 0:07 6:00 AM 6:11 AM 6:29 AM 6:41 AM 6:44 AM 0:27 7:11 1-1 AM 0:07 6:30 AM 6:41 AM 6:59 AM 7:11 AM 7:14 AM 0:27 7:41 1-4 AM 0:07 6:45 AM 6:56 AM 7:14 AM 7:26 AM 7:29 AM 0:27 7:56 1-2 AM 0:07 7:00 AM 7:11 AM 7:29 AM 7:41 AM 7:44 AM 0:27 8:11 1-5 AM 7:15 AM 7:26 AM 7:44 AM 7:56 AM 7:59 AM 0:25 1-3 AM 7:30 AM 7:41 AM 7:59 AM 8:11 AM 8:14 AM 0:27 8:41 1-6 AM 7:45 AM 7:56 AM 8:14 AM 8:26 AM 8:29 AM 0:25 1-1 AM 8:00 AM 8:11 AM 8:29 AM 8:41 AM 8:44 AM 0:25 1-4 AM 8:15 AM 8:26 AM 8:44 AM 8:56 AM 8:59 AM 0:25 1-2 AM 8:30 AM 8:41 AM 8:59 AM 9:11 AM 9:14 AM 0:25 1-3 AM 9:00 AM 9:11 AM 9:29 AM 9:41 AM 9:44 AM 0:25 1-1 Midday 0:25 3:00 PM 3:03 PM 3:16 PM 3:29 PM 3:38 PM 0:27 4:05 PM 1-2 PM 0:25 3:30 PM 3:33 PM 3:47 PM 4:05 PM 4:15 PM 0:27 4:42 PM 1-3 PM 0:25 4:00 PM 4:03 PM 4:17 PM 4:35 PM 4:45 PM 0:27 5:12 PM 1-1 PM 4:15 PM 4:18 PM 4:32 PM 4:50 PM 5:00 PM 0:27 5:27 PM 1-4 PM 0:25 4:30 PM 4:33 PM 4:47 PM 5:05 PM 5:15 PM 0:27 5:42 PM 1-5 PM 0:25 4:45 PM 4:48 PM 5:02 PM 5:20 PM 5:30 PM 0:07 1-2 PM 5:00 PM 5:03 PM 5:17 PM 5:35 PM 5:45 PM 0:27 6:12 PM 1-6 PM 0:25 5:15 PM 5:18 PM 5:32 PM 5:50 PM 6:00 PM 0:07 1-3 PM 5:30 PM 5:33 PM 5:47 PM 6:05 PM 6:15 PM 0:27 6:42 PM 1-1 PM 5:45 PM 5:48 PM 6:02 PM 6:20 PM 6:30 PM 0:07 1-4 PM 6:00 PM 6:03 PM 6:17 PM 6:35 PM 6:45 PM 0:07 1-2 PM 6:30 PM 6:33 PM 6:47 PM 7:05 PM 7:15 PM 0:07 1-3 PM 7:00 PM 7:03 PM 7:17 PM 7:35 PM 7:45 PM 0:07 Summary of Service Block Hrs.
Hrs. Miles 1-1 0.30 7.23 96.2 1-2 0.31 7.48 96.2 1-3 0.31 7.48 96.2 1-4 0.19 4.48 64.2 1-5 0.06 1.48 32.1 1-6 0.06 1.48 32.1 Rev. 29.65 417.04 DH 12.70 434.00 Total 42.35 851.04
Original PDF, page 179
| Southbound | |||||||
|---|---|---|---|---|---|---|---|
| 1 2 3 4 5 6 7 | |||||||
| Hercules Transit Center | Richmond Pkwy Transit Center | 65th/Hollis | MacArther BART | 19th St. BART | 12th St. BART | 2nd/Washingto n (J. London Sq.) | Total |
| Mileage 4.3 11.6 2.3 2.0 0.4 0.7 21.2 | |||||||
| AM Speed: | 11.0 25.0 11.0 8.0 2.0 4.0 22.7 28.2 12.2 15.1 10.7 9.8 | 61.0 20.9 | |||||
| Midday Speed: | 10.0 19.0 12.0 8.0 2.0 4.0 26.1 37.1 11.5 14.3 10.7 9.8 | 55.0 23.1 | |||||
| PM Speed: | 11.0 22.0 12.0 8.0 2.0 4.0 23.5 31.8 10.8 14.3 10.7 9.8 | 59.0 21.6 |
| Northbound | |||||||
|---|---|---|---|---|---|---|---|
| 5 4 3 2 1 | |||||||
| 2nd/Washingto n (J. London Sq.) | 12th St. BART | 19th St. BART | MacArther BART | 65th/Hollis | Richmond Pkwy Transit Center | Hercules Transit Center | Total |
| Mileage 0.74 0.4 1.96 2.3 11.3 4.1 20.8 | |||||||
| AM Speed: | 5.0 3.0 8.0 11.0 26.0 10.0 9.1 9.5 15.1 12.5 25.6 25.2 | 63.0 19.8 | |||||
| Midday Speed: | 5.0 3.0 8.0 12.0 20.0 9.0 9.1 9.5 14.3 11.8 34.4 28.8 | 57.0 21.9 | |||||
| PM Speed: | 5.0 3.0 8.0 13.0 24.0 10.0 9.1 9.5 14.3 11.1 28.1 25.2 | 63.0 19.8 |
| All-Day Schedule (15-minute peak service) | ||
|---|---|---|
| Block Period DH-PO 1 2 3 4 5 6 7 LO DH to 1 Ret to 1 DH-PI | Block Period DH-PO 7 6 5 4 3 2 1 LO DH to 5 Ret to 5 DH-PI |
Proposed Service Plans | November 2019 Route 2 Hercules TC, Richmond TC Oakland & Jack London Sq. Southbound Northbound Mileage 4.3 11.6 2.3 2.0 0.4 0.7 21.2 Mileage 0.74 0.4 1.96 2.3 11.3 4.1 20.8 AM 11.0 25.0 11.0 8.0 2.0 4.0 61.0 AM 5.0 3.0 8.0 11.0 26.0 10.0 63.0 Speed:
22.7 28.2 12.2 15.1 10.7 9.8 20.9 Speed: 9.1 9.5 15.1 12.5 25.6 25.2 19.8 Midday 10.0 19.0 12.0 8.0 2.0 4.0 55.0 Midday 5.0 3.0 8.0 12.0 20.0 9.0 57.0 Speed:
26.1 37.1 11.5 14.3 10.7 9.8 23.1 Speed: 9.1 9.5 14.3 11.8 34.4 28.8 21.9 PM 11.0 22.0 12.0 8.0 2.0 4.0 59.0 PM 5.0 3.0 8.0 13.0 24.0 10.0 63.0 Speed:
23.5 31.8 10.8 14.3 10.7 9.8 21.6 Speed: 9.1 9.5 14.3 11.1 28.1 25.2 19.8 2-1 AM 0:07 5:00 AM 5:11 AM 5:36 AM 5:47 AM 5:55 AM 5:57 AM 6:01 AM 0:36 6:37 AM 2-2 AM 0:07 5:30 AM 5:41 AM 6:06 AM 6:17 AM 6:25 AM 6:27 AM 6:31 AM 0:36 7:07 AM 2-3 AM 0:07 6:00 AM 6:11 AM 6:36 AM 6:47 AM 6:55 AM 6:57 AM 7:01 AM 0:36 7:37 AM 2-4 AM 0:07 6:30 AM 6:41 AM 7:06 AM 7:17 AM 7:25 AM 7:27 AM 7:31 AM 0:36 8:07 AM 2-5 AM 0:07 6:45 AM 6:56 AM 7:21 AM 7:32 AM 7:40 AM 7:42 AM 7:46 AM 0:31 2-1 AM 7:00 AM 7:11 AM 7:36 AM 7:47 AM 7:55 AM 7:57 AM 8:01 AM 0:36 8:37 AM 2-1 Midday 9:00 AM 9:05 AM 9:08 AM 9:16 AM 9:28 AM 9:48 AM 9:57 AM 0:18 2-6 AM 0:07 7:15 AM 7:26 AM 7:51 AM 8:02 AM 8:10 AM 8:12 AM 8:16 AM 0:36 8:52 AM 2-2 AM 7:30 AM 7:41 AM 8:06 AM 8:17 AM 8:25 AM 8:27 AM 8:31 AM 0:31 2-7 AM 0:07 7:45 AM 7:56 AM 8:21 AM 8:32 AM 8:40 AM 8:42 AM 8:46 AM 0:31 2-3 AM 8:00 AM 8:11 AM 8:36 AM 8:47 AM 8:55 AM 8:57 AM 9:01 AM 0:31 2-8 AM 0:07 8:15 AM 8:26 AM 8:51 AM 9:02 AM 9:10 AM 9:12 AM 9:16 AM 0:31 2-4 AM 8:30 AM 8:41 AM 9:06 AM 9:17 AM 9:25 AM 9:27 AM 9:31 AM 0:31 2-6 AM 9:00 AM 9:11 AM 9:36 AM 9:47 AM 9:55 AM 9:57 AM 10:01 AM 0:31 2-1 Midday 10:15 AM 10:25 AM 10:44 AM 10:56 AM 11:04 AM 11:06 AM 11:10 AM 0:20 2-1 Midday 11:30 AM 11:35 AM 11:38 AM 11:46 AM 11:58 AM 12:18 PM 12:27 PM 0:18 2-1 Midday 12:45 PM 12:55 PM 1:14 PM 1:26 PM 1:34 PM 1:36 PM 1:40 PM 0:20 2-1 Midday 2:00 PM 2:05 PM 2:08 PM 2:16 PM 2:28 PM 2:48 PM 2:57 PM 0:18 2-2 Midday 0:31 3:00 PM 3:05 PM 3:08 PM 3:16 PM 3:28 PM 3:48 PM 3:57 PM 0:36 4:33 PM 2-3 PM 0:31 3:30 PM 3:35 PM 3:38 PM 3:46 PM 3:59 PM 4:23 PM 4:33 PM 0:36 5:09 PM 2-4 PM 0:31 4:00 PM 4:05 PM 4:08 PM 4:16 PM 4:29 PM 4:53 PM 5:03 PM 0:36 5:39 PM 2-5 PM 0:31 4:15 PM 4:20 PM 4:23 PM 4:31 PM 4:44 PM 5:08 PM 5:18 PM 0:07 2-1 Midday 3:15 PM 3:25 PM 3:44 PM 3:56 PM 4:04 PM 4:06 PM 4:10 PM 0:20 2-1 PM 4:30 PM 4:35 PM 4:38 PM 4:46 PM 4:59 PM 5:23 PM 5:33 PM 0:36 6:09 PM 2-2 PM 4:45 PM 4:50 PM 4:53 PM 5:01 PM 5:14 PM 5:38 PM 5:48 PM 0:07 2-6 PM 0:31 5:00 PM 5:05 PM 5:08 PM 5:16 PM 5:29 PM 5:53 PM 6:03 PM 0:07 2-3 PM 5:15 PM 5:20 PM 5:23 PM 5:31 PM 5:44 PM 6:08 PM 6:18 PM 0:36 6:54 PM 2-7 PM 0:31 5:30 PM 5:35 PM 5:38 PM 5:46 PM 5:59 PM 6:23 PM 6:33 PM 0:07 2-8 PM 0:31 5:45 PM 5:50 PM 5:53 PM 6:01 PM 6:14 PM 6:38 PM 6:48 PM 0:07 2-4 PM 6:00 PM 6:05 PM 6:08 PM 6:16 PM 6:29 PM 6:53 PM 7:03 PM 0:07 2-1 PM 6:30 PM 6:35 PM 6:38 PM 6:46 PM 6:59 PM 7:23 PM 7:33 PM 0:07 2-3 PM 7:00 PM 7:05 PM 7:08 PM 7:16 PM 7:29 PM 7:53 PM 8:03 PM 0:07 Summary of Service Block Hrs.
Hrs. Miles 2-1 0.61 14.55 210.0 2-2 0.23 5.63 84.0 2-3 0.32 7.57 104.8 2-4 0.25 6.07 84.0 2-5 0.09 2.07 42.0 2-6 0.09 2.07 63.2 2-7 0.09 2.07 42.0 2-8 0.09 2.07 42.0 Rev.
42.08 671.84 DH 15.70 531.00 Total 57.78 1202.84
Original PDF, page 180
| Peak Period Only Schedule | ||
|---|---|---|
| Block Period DH-PO 1 2 3 4 5 6 7 LO DH to 1 Ret to 1 DH-PI | Block Period DH-PO 7 6 5 4 3 2 1 LO DH to 5 Ret to 5 DH-PI |
Proposed Service Plans | November 2019 2-1 AM 0:07 5:00 AM 5:11 AM 5:36 AM 5:47 AM 5:55 AM 5:57 AM 6:01 AM 0:36 6:37 AM 2-2 AM 0:07 5:30 AM 5:41 AM 6:06 AM 6:17 AM 6:25 AM 6:27 AM 6:31 AM 0:36 7:07 AM 2-3 AM 0:07 6:00 AM 6:11 AM 6:36 AM 6:47 AM 6:55 AM 6:57 AM 7:01 AM 0:36 7:37 AM 2-4 AM 0:07 6:30 AM 6:41 AM 7:06 AM 7:17 AM 7:25 AM 7:27 AM 7:31 AM 0:36 8:07 AM 2-5 AM 0:07 6:45 AM 6:56 AM 7:21 AM 7:32 AM 7:40 AM 7:42 AM 7:46 AM 0:31 2-1 AM 7:00 AM 7:11 AM 7:36 AM 7:47 AM 7:55 AM 7:57 AM 8:01 AM 0:31 2-6 AM 0:07 7:15 AM 7:26 AM 7:51 AM 8:02 AM 8:10 AM 8:12 AM 8:16 AM 0:36 8:52 AM 2-2 AM 7:30 AM 7:41 AM 8:06 AM 8:17 AM 8:25 AM 8:27 AM 8:31 AM 0:31 2-7 AM 0:07 7:45 AM 7:56 AM 8:21 AM 8:32 AM 8:40 AM 8:42 AM 8:46 AM 0:31 2-3 AM 8:00 AM 8:11 AM 8:36 AM 8:47 AM 8:55 AM 8:57 AM 9:01 AM 0:31 2-8 AM 0:07 8:15 AM 8:26 AM 8:51 AM 9:02 AM 9:10 AM 9:12 AM 9:16 AM 0:31 2-4 AM 8:30 AM 8:41 AM 9:06 AM 9:17 AM 9:25 AM 9:27 AM 9:31 AM 0:31 2-6 AM 9:00 AM 9:11 AM 9:36 AM 9:47 AM 9:55 AM 9:57 AM 10:01 AM 0:31 2-2 Midday 0:31 3:00 PM 3:05 PM 3:08 PM 3:16 PM 3:28 PM 3:48 PM 3:57 PM 0:36 4:33 PM 2-3 PM 0:31 3:30 PM 3:35 PM 3:38 PM 3:46 PM 3:59 PM 4:23 PM 4:33 PM 0:36 5:09 PM 2-4 PM 0:31 4:00 PM 4:05 PM 4:08 PM 4:16 PM 4:29 PM 4:53 PM 5:03 PM 0:36 5:39 PM 2-5 PM 0:31 4:15 PM 4:20 PM 4:23 PM 4:31 PM 4:44 PM 5:08 PM 5:18 PM 0:07 2-1 PM 0:31 4:30 PM 4:35 PM 4:38 PM 4:46 PM 4:59 PM 5:23 PM 5:33 PM 0:36 6:09 PM 2-2 PM 4:45 PM 4:50 PM 4:53 PM 5:01 PM 5:14 PM 5:38 PM 5:48 PM 0:07 2-6 PM 0:31 5:00 PM 5:05 PM 5:08 PM 5:16 PM 5:29 PM 5:53 PM 6:03 PM 0:07 2-3 PM 5:15 PM 5:20 PM 5:23 PM 5:31 PM 5:44 PM 6:08 PM 6:18 PM 0:36 6:54 PM 2-7 PM 0:31 5:30 PM 5:35 PM 5:38 PM 5:46 PM 5:59 PM 6:23 PM 6:33 PM 0:07 2-8 PM 0:31 5:45 PM 5:50 PM 5:53 PM 6:01 PM 6:14 PM 6:38 PM 6:48 PM 0:07 2-4 PM 6:00 PM 6:05 PM 6:08 PM 6:16 PM 6:29 PM 6:53 PM 7:03 PM 0:07 2-1 PM 6:30 PM 6:35 PM 6:38 PM 6:46 PM 6:59 PM 7:23 PM 7:33 PM 0:07 2-3 PM 7:00 PM 7:05 PM 7:08 PM 7:16 PM 7:29 PM 7:53 PM 8:03 PM 0:07 Summary of Service Block Hrs.
Hrs. Miles 2-1 0.25 6.07 84.0 2-2 0.24 5.82 84.0 2-3 0.32 7.57 104.8 2-4 0.25 6.07 84.0 2-5 0.09 2.07 42.0 2-6 0.16 3.82 63.2 2-7 0.09 2.07 42.0 2-8 0.09 2.07 42.0 Rev.
35.53 545.87 DH 15.90 540.00 Total 51.43 1085.87
Original PDF, page 181
| Southbound | |||||
|---|---|---|---|---|---|
| 1 2 3 4 5 | |||||
| Hercules Transit Center | Richmond Pkwy Transit Center | 65th/Hollis | MacArther BART | MacArthur/ Broadway | Total |
| Mileage 4.3 11.6 2.3 0.8 18.9 | |||||
| AM Speed: | 11.0 25.0 11.0 3.0 22.7 28.2 12.3 15.2 | 50.0 22.7 | |||
| Midday Speed: | 10.0 19.0 12.0 4.0 26.1 37.1 11.5 13.4 | 45.0 25.2 | |||
| PM Speed: | 11.0 22.0 12.0 4.0 23.5 31.8 10.8 13.4 | 49.0 23.2 |
| Northbound | |||||
|---|---|---|---|---|---|
| 5 4 3 2 1 | |||||
| MacArthur/ Broadway | MacArther BART | 65th/Hollis | Richmond Pkwy Transit Center | Hercules Transit Center | Total |
| Mileage 0.76 2.3 11.3 4.1 18.5 | |||||
| AM Speed: | 3.0 11.0 26.0 10.0 14.0 12.5 25.6 25.2 | 50.0 22.1 | |||
| Midday Speed: | 4.0 12.0 20.0 9.0 12.4 11.8 34.4 28.8 | 45.0 24.6 | |||
| PM Speed: | 4.0 16.0 24.0 10.0 12.4 8.8 28.1 25.2 | 54.0 20.5 |
| All-Day Schedule (15-minute peak service) | ||
|---|---|---|
| Block Period DH-PO 1 2 3 4 5 LO DH to 1 Ret to 1 DH-PI | Block Period DH-PO 5 4 3 2 1 LO DH to 5 Ret to 5 DH-PI |
Proposed Service Plans | November 2019 Route 2A Hercules TC, Richmond TC MacArthur/Broadway Southbound Northbound Mileage 4.3 11.6 2.3 0.8 18.9 Mileage 0.76 2.3 11.3 4.1 18.5 AM 11.0 25.0 11.0 3.0 50.0 AM 3.0 11.0 26.0 10.0 50.0 Speed:
22.7 28.2 12.3 15.2 22.7 Speed: 14.0 12.5 25.6 25.2 22.1 Midday 10.0 19.0 12.0 4.0 45.0 Midday 4.0 12.0 20.0 9.0 45.0 Speed: 26.1 37.1 11.5 13.4 25.2 Speed:
12.4 11.8 34.4 28.8 24.6 PM 11.0 22.0 12.0 4.0 49.0 PM 4.0 16.0 24.0 10.0 54.0 Speed: 23.5 31.8 10.8 13.4 23.2 Speed: 12.4 8.8 28.1 25.2 20.5 2A-1 AM 0:07 5:00 AM 5:11 AM 5:36 AM 5:47 AM 5:50 AM 0:32 6:22 AM 2A-2 AM 0:07 5:30 AM 5:41 AM 6:06 AM 6:17 AM 6:20 AM 0:32 6:52 AM 2A-3 AM 0:07 6:00 AM 6:11 AM 6:36 AM 6:47 AM 6:50 AM 0:32 7:22 AM 2A-4 AM 0:07 6:30 AM 6:41 AM 7:06 AM 7:17 AM 7:20 AM 0:32 7:52 AM 2A-1 AM 0:07 6:45 AM 6:56 AM 7:21 AM 7:32 AM 7:35 AM 0:32 8:07 AM 2A-5 AM 7:00 AM 7:11 AM 7:36 AM 7:47 AM 7:50 AM 0:29 2A-2 AM 0:07 7:15 AM 7:26 AM 7:51 AM 8:02 AM 8:05 AM 0:32 8:37 AM 2A-6 AM 7:30 AM 7:41 AM 8:06 AM 8:17 AM 8:20 AM 0:29 2A-3 AM 0:07 7:45 AM 7:56 AM 8:21 AM 8:32 AM 8:35 AM 2A-3 Midday 9:00 AM 9:04 AM 9:16 AM 9:36 AM 9:45 AM 0:15 2A-7 AM 8:00 AM 8:11 AM 8:36 AM 8:47 AM 8:50 AM 0:29 2A-4 AM 0:07 8:15 AM 8:26 AM 8:51 AM 9:02 AM 9:05 AM 0:29 2A-1 AM 8:30 AM 8:41 AM 9:06 AM 9:17 AM 9:20 AM 0:29 2A-2 AM 9:00 AM 9:11 AM 9:36 AM 9:47 AM 9:50 AM 0:29 2A-3 Midday 10:00 AM 10:10 AM 10:29 AM 10:41 AM 10:45 AM 0:15 2A-3 Midday 11:00 AM 11:04 AM 11:16 AM 11:36 AM 11:45 AM 0:15 2A-3 Midday 12:00 PM 12:10 PM 12:29 PM 12:41 PM 12:45 PM 0:15 2A-3 Midday 1:00 PM 1:04 PM 1:16 PM 1:36 PM 1:45 PM 0:15 2A-3 Midday 2:00 PM 2:10 PM 2:29 PM 2:41 PM 2:45 PM 0:15 2A-3 Midday 3:00 PM 3:04 PM 3:16 PM 3:36 PM 3:45 PM 0:32 4:17 PM 2A-1 PM 0:29 3:30 PM 3:34 PM 3:50 PM 4:14 PM 4:24 PM 0:32 4:56 PM 2A-2 PM 0:29 4:00 PM 4:04 PM 4:20 PM 4:44 PM 4:54 PM 0:32 5:26 PM 2A-4 PM 0:29 4:15 PM 4:19 PM 4:35 PM 4:59 PM 5:09 PM 0:32 5:41 PM 2A-3 PM 4:30 PM 4:34 PM 4:50 PM 5:14 PM 5:24 PM 0:07 2A-5 PM 0:29 4:45 PM 4:49 PM 5:05 PM 5:29 PM 5:39 PM 0:32 6:11 PM 2A-6 PM 0:29 5:00 PM 5:04 PM 5:20 PM 5:44 PM 5:54 PM 0:07 2A-1 PM 5:15 PM 5:19 PM 5:35 PM 5:59 PM 6:09 PM 0:32 6:41 PM 2A-7 PM 0:29 5:30 PM 5:34 PM 5:50 PM 6:14 PM 6:24 PM 0:07 2A-2 PM 5:45 PM 5:49 PM 6:05 PM 6:29 PM 6:39 PM 0:07 2A-4 PM 6:00 PM 6:04 PM 6:20 PM 6:44 PM 6:54 PM 0:07 2A-5 PM 6:30 PM 6:34 PM 6:50 PM 7:14 PM 7:24 PM 0:07 2A-1 PM 7:00 PM 7:04 PM 7:20 PM 7:44 PM 7:54 PM 0:07 Summary of Service Block Hrs.
Hrs. Miles 2A-1 0.36 8.73 112.1 2A-2 0.29 6.98 93.7 2A-3 0.48 11.40 186.9 2A-4 0.22 5.23 74.8 2A-5 0.15 3.48 55.8 2A-6 0.07 1.73 37.4 2A-7 0.07 1.73 37.4 Rev.
39.30 598.08 DH 13.95 473.40 Total 53.25 1071.48
Original PDF, page 182
| Peak Period Only Schedule | ||
|---|---|---|
| Block Period DH-PO 1 2 3 4 5 LO DH to 1 Ret to 1 DH-PI | Block Period DH-PO 5 4 3 2 1 LO DH to 5 Ret to 5 DH-PI |
Proposed Service Plans | November 2019 2A-1 AM 0:07 5:00 AM 5:11 AM 5:36 AM 5:47 AM 5:50 AM 0:32 6:22 AM 2A-2 AM 0:07 5:30 AM 5:41 AM 6:06 AM 6:17 AM 6:20 AM 0:32 6:52 AM 2A-3 AM 0:07 6:00 AM 6:11 AM 6:36 AM 6:47 AM 6:50 AM 0:32 7:22 AM 2A-4 AM 0:07 6:30 AM 6:41 AM 7:06 AM 7:17 AM 7:20 AM 0:32 7:52 AM 2A-1 AM 0:07 6:45 AM 6:56 AM 7:21 AM 7:32 AM 7:35 AM 0:32 8:07 AM 2A-5 AM 7:00 AM 7:11 AM 7:36 AM 7:47 AM 7:50 AM 0:29 2A-2 AM 0:07 7:15 AM 7:26 AM 7:51 AM 8:02 AM 8:05 AM 0:32 8:37 AM 2A-6 AM 7:30 AM 7:41 AM 8:06 AM 8:17 AM 8:20 AM 0:29 2A-3 AM 0:07 7:45 AM 7:56 AM 8:21 AM 8:32 AM 8:35 AM 0:29 2A-7 AM 8:00 AM 8:11 AM 8:36 AM 8:47 AM 8:50 AM 0:29 2A-4 AM 0:07 8:15 AM 8:26 AM 8:51 AM 9:02 AM 9:05 AM 0:29 2A-1 AM 8:30 AM 8:41 AM 9:06 AM 9:17 AM 9:20 AM 0:29 2A-2 AM 9:00 AM 9:11 AM 9:36 AM 9:47 AM 9:50 AM 0:29 2A-3 Midday 0:29 3:00 PM 3:04 PM 3:16 PM 3:36 PM 3:45 PM 0:32 4:17 PM 2A-1 PM 0:29 3:30 PM 3:34 PM 3:50 PM 4:14 PM 4:24 PM 0:32 4:56 PM 2A-2 PM 0:29 4:00 PM 4:04 PM 4:20 PM 4:44 PM 4:54 PM 0:32 5:26 PM 2A-4 PM 0:29 4:15 PM 4:19 PM 4:35 PM 4:59 PM 5:09 PM 0:32 5:41 PM 2A-3 PM 4:30 PM 4:34 PM 4:50 PM 5:14 PM 5:24 PM 0:07 2A-5 PM 0:29 4:45 PM 4:49 PM 5:05 PM 5:29 PM 5:39 PM 0:32 6:11 PM 2A-6 PM 0:29 5:00 PM 5:04 PM 5:20 PM 5:44 PM 5:54 PM 0:07 2A-1 PM 5:15 PM 5:19 PM 5:35 PM 5:59 PM 6:09 PM 0:32 6:41 PM 2A-7 PM 0:29 5:30 PM 5:34 PM 5:50 PM 6:14 PM 6:24 PM 0:07 2A-2 PM 5:45 PM 5:49 PM 6:05 PM 6:29 PM 6:39 PM 0:07 2A-4 PM 6:00 PM 6:04 PM 6:20 PM 6:44 PM 6:54 PM 0:07 2A-5 PM 6:30 PM 6:34 PM 6:50 PM 7:14 PM 7:24 PM 0:07 2A-1 PM 7:00 PM 7:04 PM 7:20 PM 7:44 PM 7:54 PM 0:07 Summary of Service Block Hrs.
Hrs. Miles 2A-1 0.36 8.73 112.1 2A-2 0.29 6.98 93.7 2A-3 0.21 4.98 74.8 2A-4 0.22 5.23 74.8 2A-5 0.15 3.48 55.8 2A-6 0.07 1.73 37.4 2A-7 0.07 1.73 37.4 Rev.
32.88 485.94 DH 14.92 507.80 Total 47.80 993.74
Original PDF, page 183
| Southbound | |||||
|---|---|---|---|---|---|
| 1 2 3 4 5 | |||||
| Hercules Transit Center | Richmond Pkwy Transit Center | 19th St. BART | 12th St. BART | 2nd/Washington (J. London Sq.) | Total |
| Mileage 4.3 14.5 0.4 0.7 19.9 | |||||
| AM Speed: | 11.0 30.0 2.0 4.0 22.7 28.8 10.7 9.6 | 47.0 25.4 | |||
| Midday Speed: | 10.0 27.0 3.0 4.0 26.1 32.6 9.5 8.7 | 44.0 27.1 | |||
| PM Speed: | 11.0 27.0 3.0 4.0 23.5 32.6 9.5 8.7 | 45.0 26.5 |
| Northbound | |||||
|---|---|---|---|---|---|
| 5 4 3 2 1 | |||||
| 2nd/Washington (J. London Sq.) | 12th St. BART | 19th St. BART | Richmond Pkwy Transit Center | Hercules Transit Center | Total |
| Mileage 0.74 0.4 14.4 4.1 19.7 | |||||
| AM Speed: | 5.0 3.0 33.0 10.0 9.1 9.5 26.2 25.2 | 51.0 23.1 | |||
| Midday Speed: | 5.0 3.0 28.0 9.0 9.1 9.5 31.2 28.8 | 45.0 26.2 | |||
| PM Speed: | 6.0 3.0 31.0 10.0 7.7 8.0 27.5 25.2 | 50.0 23.6 |
| All-Day Schedule (15-minute peak service) | ||
|---|---|---|
| Block Period DH-PO 1 2 5 6 7 LO DH to 1 Ret to 1 DH-PI | Block Period DH-PO 7 6 5 2 1 LO DH to 5 Ret to 5 DH-PI |
Proposed Service Plans | November 2019 Route 2B Hercules TC, Richmond TC Jack London Sq. Southbound Northbound Mileage 4.3 14.5 0.4 0.7 19.9 Mileage 0.74 0.4 14.4 4.1 19.7 AM 11.0 30.0 2.0 4.0 47.0 AM 5.0 3.0 33.0 10.0 51.0 Speed:
22.7 28.8 10.7 9.6 25.4 Speed: 9.1 9.5 26.2 25.2 23.1 Midday 10.0 27.0 3.0 4.0 44.0 Midday 5.0 3.0 28.0 9.0 45.0 Speed: 26.1 32.6 9.5 8.7 27.1 Speed:
9.1 9.5 31.2 28.8 26.2 PM 11.0 27.0 3.0 4.0 45.0 PM 6.0 3.0 31.0 10.0 50.0 Speed: 23.5 32.6 9.5 8.7 26.5 Speed: 7.7 8.0 27.5 25.2 23.6 2B-1 AM 0:07 5:00 AM 5:11 AM 5:41 AM 5:43 AM 5:47 AM 0:34 6:21 AM 2B-2 AM 0:07 5:30 AM 5:41 AM 6:11 AM 6:13 AM 6:17 AM 0:34 6:51 AM 2B-3 AM 0:07 6:00 AM 6:11 AM 6:41 AM 6:43 AM 6:47 AM 0:34 7:21 AM 2B-4 AM 0:07 6:30 AM 6:41 AM 7:11 AM 7:13 AM 7:17 AM 0:34 7:51 AM 2B-1 AM 0:07 6:45 AM 6:56 AM 7:26 AM 7:28 AM 7:32 AM 0:34 8:06 AM 0:31 2B-5 AM 7:00 AM 7:11 AM 7:41 AM 7:43 AM 7:47 AM 2B-2 AM 0:07 7:15 AM 7:26 AM 7:56 AM 7:58 AM 8:02 AM 0:34 8:36 AM 2B-6 AM 7:30 AM 7:41 AM 8:11 AM 8:13 AM 8:17 AM 0:31 2B-3 AM 0:07 7:45 AM 7:56 AM 8:26 AM 8:28 AM 8:32 AM 0:31 2B-7 AM 8:00 AM 8:11 AM 8:41 AM 8:43 AM 8:47 AM 0:13 2B-7 Midday 9:00 AM 9:05 AM 9:08 AM 9:36 AM 9:45 AM 0:15 2B-4 AM 0:07 8:15 AM 8:26 AM 8:56 AM 8:58 AM 9:02 AM 0:31 2B-1 AM 8:30 AM 8:41 AM 9:11 AM 9:13 AM 9:17 AM 0:31 2B-2 AM 9:00 AM 9:11 AM 9:41 AM 9:43 AM 9:47 AM 0:31 2B-7 Midday 10:00 AM 10:10 AM 10:37 AM 10:40 AM 10:44 AM 0:16 2B-7 Midday 11:00 AM 11:05 AM 11:08 AM 11:36 AM 11:45 AM 0:15 2B-7 Midday 12:00 PM 12:10 PM 12:37 PM 12:40 PM 12:44 PM 0:16 2B-7 Midday 1:00 PM 1:05 PM 1:08 PM 1:36 PM 1:45 PM 0:15 2B-7 Midday 2:00 PM 2:10 PM 2:37 PM 2:40 PM 2:44 PM 0:16 2B-7 Midday 3:00 PM 3:05 PM 3:08 PM 3:36 PM 3:45 PM 0:34 4:19 PM 2B-1 PM 0:31 3:30 PM 3:36 PM 3:39 PM 4:10 PM 4:20 PM 0:34 4:54 PM 2B-2 PM 0:31 4:00 PM 4:06 PM 4:09 PM 4:40 PM 4:50 PM 0:34 5:24 PM 2B-3 PM 0:31 4:15 PM 4:21 PM 4:24 PM 4:55 PM 5:05 PM 0:34 5:39 PM 2B-7 PM 4:30 PM 4:36 PM 4:39 PM 5:10 PM 5:20 PM 0:07 2B-4 PM 0:31 4:45 PM 4:51 PM 4:54 PM 5:25 PM 5:35 PM 0:34 6:09 PM 2B-5 PM 0:31 5:00 PM 5:06 PM 5:09 PM 5:40 PM 5:50 PM 0:07 2B-1 PM 5:15 PM 5:21 PM 5:24 PM 5:55 PM 6:05 PM 0:34 6:39 PM 2B-6 PM 0:31 5:30 PM 5:36 PM 5:39 PM 6:10 PM 6:20 PM 0:07 2B-2 PM 5:45 PM 5:51 PM 5:54 PM 6:25 PM 6:35 PM 0:07 2B-3 PM 6:00 PM 6:06 PM 6:09 PM 6:40 PM 6:50 PM 0:07 2B-4 PM 6:30 PM 6:36 PM 6:39 PM 7:10 PM 7:20 PM 0:07 2B-1 PM 7:00 PM 7:06 PM 7:09 PM 7:40 PM 7:50 PM 0:07 Summary of Service Block Hrs.
Hrs. Miles 2B-1 0.36 8.62 118.6 2B-2 0.29 6.87 99.0 2B-3 0.21 5.12 79.1 2B-4 0.21 5.12 79.1 2B-5 0.07 1.62 39.5 2B-6 0.07 1.62 39.5 2B-7 0.39 9.33 177.8 Rev.
38.28 632.64 DH 14.75 497.40 Total 53.03 1130.04
Original PDF, page 184
| Peak Period Only Schedule | ||
|---|---|---|
| Block Period DH-PO 1 2 5 6 7 LO DH to 1 Ret to 1 DH-PI | Block Period DH-PO 7 6 5 2 1 LO DH to 5 Ret to 5 DH-PI |
Proposed Service Plans | November 2019 2B-1 AM 0:07 5:00 AM 5:11 AM 5:41 AM 5:43 AM 5:47 AM 0:34 6:21 AM 2B-2 AM 0:07 5:30 AM 5:41 AM 6:11 AM 6:13 AM 6:17 AM 0:34 6:51 AM 2B-3 AM 0:07 6:00 AM 6:11 AM 6:41 AM 6:43 AM 6:47 AM 0:34 7:21 AM 2B-4 AM 0:07 6:30 AM 6:41 AM 7:11 AM 7:13 AM 7:17 AM 0:34 7:51 AM 2B-1 AM 0:07 6:45 AM 6:56 AM 7:26 AM 7:28 AM 7:32 AM 0:34 8:06 AM 0:31 2B-5 AM 7:00 AM 7:11 AM 7:41 AM 7:43 AM 7:47 AM 2B-2 AM 0:07 7:15 AM 7:26 AM 7:56 AM 7:58 AM 8:02 AM 0:34 8:36 AM 2B-6 AM 7:30 AM 7:41 AM 8:11 AM 8:13 AM 8:17 AM 0:31 2B-3 AM 0:07 7:45 AM 7:56 AM 8:26 AM 8:28 AM 8:32 AM 0:31 2B-7 AM 8:00 AM 8:11 AM 8:41 AM 8:43 AM 8:47 AM 0:31 2B-4 AM 0:07 8:15 AM 8:26 AM 8:56 AM 8:58 AM 9:02 AM 0:31 2B-1 AM 8:30 AM 8:41 AM 9:11 AM 9:13 AM 9:17 AM 0:31 2B-2 AM 9:00 AM 9:11 AM 9:41 AM 9:43 AM 9:47 AM 0:31 2B-7 Midday 0:31 3:00 PM 3:05 PM 3:08 PM 3:36 PM 3:45 PM 0:34 4:19 PM 2B-1 PM 0:31 3:30 PM 3:36 PM 3:39 PM 4:10 PM 4:20 PM 0:34 4:54 PM 2B-2 PM 0:31 4:00 PM 4:06 PM 4:09 PM 4:40 PM 4:50 PM 0:34 5:24 PM 2B-3 PM 0:31 4:15 PM 4:21 PM 4:24 PM 4:55 PM 5:05 PM 0:34 5:39 PM 2B-7 PM 4:30 PM 4:36 PM 4:39 PM 5:10 PM 5:20 PM 0:07 2B-4 PM 0:31 4:45 PM 4:51 PM 4:54 PM 5:25 PM 5:35 PM 0:34 6:09 PM 2B-5 PM 0:31 5:00 PM 5:06 PM 5:09 PM 5:40 PM 5:50 PM 0:07 2B-1 PM 5:15 PM 5:21 PM 5:24 PM 5:55 PM 6:05 PM 0:34 6:39 PM 2B-6 PM 0:31 5:30 PM 5:36 PM 5:39 PM 6:10 PM 6:20 PM 0:07 2B-2 PM 5:45 PM 5:51 PM 5:54 PM 6:25 PM 6:35 PM 0:07 2B-3 PM 6:00 PM 6:06 PM 6:09 PM 6:40 PM 6:50 PM 0:07 2B-4 PM 6:30 PM 6:36 PM 6:39 PM 7:10 PM 7:20 PM 0:07 2B-1 PM 7:00 PM 7:06 PM 7:09 PM 7:40 PM 7:50 PM 0:07 Summary of Service Block Hrs.
Hrs. Miles 2B-1 0.36 8.62 118.6 2B-2 0.29 6.87 99.0 2B-3 0.21 5.12 79.1 2B-4 0.21 5.12 79.1 2B-5 0.07 1.62 39.5 2B-6 0.07 1.62 39.5 2B-7 0.13 3.12 59.2 Rev.
32.07 514.02 DH 15.78 533.40 Total 47.85 1047.42
Original PDF, page 185
| Southbound | |||||
|---|---|---|---|---|---|
| 1 2 3 4 5 | |||||
| San Pablo/Pinole Shores | Richmond Pkwy Transit Center | 19th Street BART | 12th Street BART | 2nd/Washingto n (J. London Sq.) | Total |
| Mileage 2.7 14.5 0.4 0.7 18.3 | |||||
| AM Speed: | 13.0 30.0 2.0 4.0 12.8 28.8 10.7 9.6 | 49.0 22.4 | |||
| Midday Speed: | 14.0 27.0 3.0 4.0 11.7 32.6 9.5 8.7 | 48.0 22.9 | |||
| PM Speed: | 14.0 27.0 3.0 4.0 11.7 32.6 9.5 8.7 | 48.0 22.9 |
| Northbound | |||||
|---|---|---|---|---|---|
| 5 4 3 2 1 | |||||
| 2nd/Washingto n (J. London Sq.) | 12th Street BART | 19th Street BART | Richmond Pkwy Transit Center | San Pablo/Pinole Shores | Total |
| Mileage 0.74 0.4 14.3 2.7 18.1 | |||||
| AM Speed: | 5.0 3.0 32.0 10.0 9.1 9.5 27.0 15.6 | 50.0 21.7 | |||
| Midday Speed: | 5.0 3.0 27.0 10.0 9.1 9.5 32.2 15.6 | 45.0 24.1 | |||
| PM Speed: | 6.0 3.0 30.0 11.0 7.7 8.0 28.3 14.3 | 50.0 21.7 |
| All-Day Schedule (15-minute peak service) | ||
|---|---|---|
| Block Period DH-PO 1 2 3 4 5 LO DH to 1 Ret to 1 DH-PI | Block Period DH-PO 5 4 3 2 1 LO DH to 5 Ret to 4 DH-PI |
Proposed Service Plans | November 2019 Route 3 San Pablo/Pinole Shores, Richmond TC Oakland & J. London Sq. Southbound Northbound Mileage 2.7 14.5 0.4 0.7 18.3 Mileage 0.74 0.4 14.3 2.7 18.1 AM 13.0 30.0 2.0 4.0 49.0 AM 5.0 3.0 32.0 10.0 50.0 Speed:
12.8 28.8 10.7 9.6 22.4 Speed: 9.1 9.5 27.0 15.6 21.7 Midday 14.0 27.0 3.0 4.0 48.0 Midday 5.0 3.0 27.0 10.0 45.0 Speed: 11.7 32.6 9.5 8.7 22.9 Speed:
9.1 9.5 32.2 15.6 24.1 PM 14.0 27.0 3.0 4.0 48.0 PM 6.0 3.0 30.0 11.0 50.0 Speed: 11.7 32.6 9.5 8.7 22.9 Speed: 7.7 8.0 28.3 14.3 21.7 3-1 AM 0:05 5:00 AM 5:13 AM 5:43 AM 5:45 AM 5:49 AM 0:31 6:20 3-2 AM 0:05 5:30 AM 5:43 AM 6:13 AM 6:15 AM 6:19 AM 0:31 6:50 3-3 AM 0:05 6:00 AM 6:13 AM 6:43 AM 6:45 AM 6:49 AM 0:31 7:20 3-1 AM 6:30 AM 6:43 AM 7:13 AM 7:15 AM 7:19 AM 0:31 7:50 3-4 AM 0:05 6:45 AM 6:58 AM 7:28 AM 7:30 AM 7:34 AM 0:31 8:05 3-2 AM 7:00 AM 7:13 AM 7:43 AM 7:45 AM 7:49 AM 0:31 8:20 3-5 AM 0:05 7:15 AM 7:28 AM 7:58 AM 8:00 AM 8:04 AM 0:31 3-3 AM 7:30 AM 7:43 AM 8:13 AM 8:15 AM 8:19 AM 0:31 8:50 3-6 AM 0:05 7:45 AM 7:58 AM 8:28 AM 8:30 AM 8:34 AM 0:31 3-1 AM 8:00 AM 8:13 AM 8:43 AM 8:45 AM 8:49 AM 0:11 3-1 Midday 9:00 AM 9:05 AM 9:08 AM 9:35 AM 9:45 AM 0:15 3-4 AM 8:15 AM 8:28 AM 8:58 AM 9:00 AM 9:04 AM 0:31 3-2 AM 8:30 AM 8:43 AM 9:13 AM 9:15 AM 9:19 AM 0:31 3-3 AM 9:00 AM 9:13 AM 9:43 AM 9:45 AM 9:49 AM 0:31 3-1 Midday 10:00 AM 10:14 AM 10:41 AM 10:44 AM 10:48 AM 0:12 3-1 Midday 11:00 AM 11:05 AM 11:08 AM 11:35 AM 11:45 AM 0:15 3-1 Midday 12:00 PM 12:14 PM 12:41 PM 12:44 PM 12:48 PM 0:12 3-1 Midday 1:00 PM 1:05 PM 1:08 PM 1:35 PM 1:45 PM 0:15 3-1 Midday 2:00 PM 2:14 PM 2:41 PM 2:44 PM 2:48 PM 0:12 3-1 Midday 3:00 PM 3:05 PM 3:08 PM 3:35 PM 3:45 PM 0:31 4:16 PM 3-2 PM 0:31 3:30 PM 3:36 PM 3:39 PM 4:09 PM 4:20 PM 0:31 4:51 PM 3-3 PM 0:31 4:00 PM 4:06 PM 4:09 PM 4:39 PM 4:50 PM 0:31 5:21 PM 3-4 PM 0:31 4:15 PM 4:21 PM 4:24 PM 4:54 PM 5:05 PM 0:31 5:36 PM 3-1 PM 4:30 PM 4:36 PM 4:39 PM 5:09 PM 5:20 PM 0:31 5:51 PM 3-5 PM 0:31 4:45 PM 4:51 PM 4:54 PM 5:24 PM 5:35 PM 0:05 3-2 PM 5:00 PM 5:06 PM 5:09 PM 5:39 PM 5:50 PM 0:31 6:21 PM 3-6 PM 0:31 5:15 PM 5:21 PM 5:24 PM 5:54 PM 6:05 PM 0:05 3-3 PM 5:30 PM 5:36 PM 5:39 PM 6:09 PM 6:20 PM 0:31 6:51 PM 3-4 PM 5:45 PM 5:51 PM 5:54 PM 6:24 PM 6:35 PM 0:05 3-1 PM 6:00 PM 6:06 PM 6:09 PM 6:39 PM 6:50 PM 0:05 3-2 PM 6:30 PM 6:36 PM 6:39 PM 7:09 PM 7:20 PM 0:05 3-3 PM 7:00 PM 7:06 PM 7:09 PM 7:39 PM 7:50 PM 0:05 Summary of Service Block Hrs.
Hrs. Miles 3-1 0.58 13.83 218.2 3-2 0.32 7.65 109.1 3-3 0.32 7.65 109.1 3-4 0.19 4.65 72.7 3-5 0.07 1.65 36.4 3-6 0.07 1.65 36.4 Rev. 37.08 581.92 DH 13.40 457.40 Total 50.48 1039.32
Original PDF, page 186
| Peak Period Only Schedule | ||
|---|---|---|
| Block Period DH-PO 1 2 3 4 5 LO DH to 1 Ret to 1 DH-PI | Block Period DH-PO 5 4 3 2 1 LO DH to 5 Ret to 4 DH-PI |
Proposed Service Plans | November 2019 3-1 AM 0:05 5:00 AM 5:13 AM 5:43 AM 5:45 AM 5:49 AM 0:31 6:20 3-2 AM 0:05 5:30 AM 5:43 AM 6:13 AM 6:15 AM 6:19 AM 0:31 6:50 3-3 AM 0:05 6:00 AM 6:13 AM 6:43 AM 6:45 AM 6:49 AM 0:31 7:20 3-1 AM 6:30 AM 6:43 AM 7:13 AM 7:15 AM 7:19 AM 0:31 7:50 3-4 AM 0:05 6:45 AM 6:58 AM 7:28 AM 7:30 AM 7:34 AM 0:31 8:05 3-2 AM 7:00 AM 7:13 AM 7:43 AM 7:45 AM 7:49 AM 0:31 8:20 3-5 AM 0:05 7:15 AM 7:28 AM 7:58 AM 8:00 AM 8:04 AM 0:31 3-3 AM 7:30 AM 7:43 AM 8:13 AM 8:15 AM 8:19 AM 0:31 8:50 3-6 AM 0:05 7:45 AM 7:58 AM 8:28 AM 8:30 AM 8:34 AM 0:31 3-1 AM 8:00 AM 8:13 AM 8:43 AM 8:45 AM 8:49 AM 0:31 3-4 AM 8:15 AM 8:28 AM 8:58 AM 9:00 AM 9:04 AM 0:31 3-2 AM 8:30 AM 8:43 AM 9:13 AM 9:15 AM 9:19 AM 0:31 3-3 AM 9:00 AM 9:13 AM 9:43 AM 9:45 AM 9:49 AM 0:31 3-1 Midday 0:31 3:00 PM 3:05 PM 3:08 PM 3:35 PM 3:45 PM 0:31 4:16 PM 3-2 PM 0:31 3:30 PM 3:36 PM 3:39 PM 4:09 PM 4:20 PM 0:31 4:51 PM 3-3 PM 0:31 4:00 PM 4:06 PM 4:09 PM 4:39 PM 4:50 PM 0:31 5:21 PM 3-4 PM 0:31 4:15 PM 4:21 PM 4:24 PM 4:54 PM 5:05 PM 0:31 5:36 PM 3-1 PM 4:30 PM 4:36 PM 4:39 PM 5:09 PM 5:20 PM 0:31 5:51 PM 3-5 PM 0:31 4:45 PM 4:51 PM 4:54 PM 5:24 PM 5:35 PM 0:05 3-2 PM 5:00 PM 5:06 PM 5:09 PM 5:39 PM 5:50 PM 0:31 6:21 PM 3-6 PM 0:31 5:15 PM 5:21 PM 5:24 PM 5:54 PM 6:05 PM 0:05 3-3 PM 5:30 PM 5:36 PM 5:39 PM 6:09 PM 6:20 PM 0:31 6:51 PM 3-4 PM 5:45 PM 5:51 PM 5:54 PM 6:24 PM 6:35 PM 0:05 3-1 PM 6:00 PM 6:06 PM 6:09 PM 6:39 PM 6:50 PM 0:05 3-2 PM 6:30 PM 6:36 PM 6:39 PM 7:09 PM 7:20 PM 0:05 3-3 PM 7:00 PM 7:06 PM 7:09 PM 7:39 PM 7:50 PM 0:05 Summary of Service Block Hrs.
Hrs. Miles 3-1 0.32 7.65 109.1 3-2 0.32 7.65 109.1 3-3 0.32 7.65 91.0 3-4 0.19 4.65 72.7 3-5 0.07 1.65 36.4 3-6 0.07 1.65 36.4 Rev. 30.90 454.74 DH 14.27 489.40 Total 45.17 944.14
Original PDF, page 187
| Southbound | |||
|---|---|---|---|
| 1 2 3 | |||
| San Pablo/ Pinole Shores | Richmond Pkwy Transit Center | SF Transbay Terminal | Total |
| Mileage 2.7 18.8 21.5 | |||
| AM Speed: | 13.0 44.0 12.8 28.7 | 57.0 22.6 | |
| Midday Speed: | 14.0 40.0 11.7 32.0 | 54.0 23.9 | |
| PM Speed: | 11.0 47.0 15.0 27.1 | 58.0 22.2 |
| Northbound | |||
|---|---|---|---|
| 3 2 1 | |||
| SF Transbay Terminal | Richmond Pkwy Transit Center | San Pablo/ Pinole Shores | Total |
| Mileage 18.7 2.7 21.4 | |||
| AM Speed: | 51.0 10.0 21.8 15.6 | 61.0 21.0 | |
| Midday Speed: | 35.0 10.0 32.0 15.6 | 45.0 28.5 | |
| PM Speed: | 39.0 11.0 28.7 14.3 | 50.0 25.7 |
| All-Day Schedule (15-minute peak service) | ||
|---|---|---|
| Block Period DH-PO 1 2 3 LO DH to 1 Ret to 1 DH-PI | Block Period DH-PO 3 2 1 LO DH to 3 Ret to 3 DH-PI |
Proposed Service Plans | November 2019 Route 4 San Pablo/Crestview, Richmond TC SF Transbay Southbound Northbound Mileage 2.7 18.8 21.5 Mileage 18.7 2.7 21.4 AM 13.0 44.0 57.0 AM 51.0 10.0 61.0 Speed:
12.8 28.7 22.6 Speed: 21.8 15.6 21.0 Midday 14.0 40.0 54.0 Midday 35.0 10.0 45.0 Speed: 11.7 32.0 23.9 Speed: 32.0 15.6 28.5 PM 11.0 47.0 58.0 PM 39.0 11.0 50.0 Speed:
15.0 27.1 22.2 Speed: 28.7 14.3 25.7 4-1 AM 0:05 6:00 AM 6:13 AM 6:57 AM 0:37 7:34 4-2 AM 0:05 6:15 AM 6:28 AM 7:12 AM 0:37 7:49 4-3 AM 0:05 6:30 AM 6:43 AM 7:27 AM 0:37 8:04 4-4 AM 0:05 6:45 AM 6:58 AM 7:42 AM 0:37 8:19 4-5 AM 0:05 7:00 AM 7:13 AM 7:57 AM 0:36 4-6 AM 0:05 7:15 AM 7:28 AM 8:12 AM 0:36 4-7 AM 0:05 7:30 AM 7:43 AM 8:27 AM 0:36 4-1 AM 0:05 7:45 AM 7:58 AM 8:42 AM 0:18 4-1 Midday 9:00 AM 9:35 AM 9:45 AM 0:15 4-2 AM 0:05 8:00 AM 8:13 AM 8:57 AM 0:36 4-3 AM 8:15 AM 8:28 AM 9:12 AM 0:36 4-4 AM 8:30 AM 8:43 AM 9:27 AM 0:36 4-1 Midday 10:00 AM 10:14 AM 10:54 AM 0:21 4-1 Midday 11:15 AM 11:50 AM 12:00 PM 0:15 4-1 Midday 12:15 PM 12:29 PM 1:09 PM 0:21 4-1 Midday 1:30 PM 2:05 PM 2:15 PM 0:15 4-2 Midday 0:41 3:00 PM 3:35 PM 3:45 PM 0:42 4:27 PM 4-3 PM 0:41 3:30 PM 4:09 PM 4:20 PM 0:42 5:02 PM 4-1 Midday 2:30 PM 2:44 PM 3:24 PM 0:36 4-1 PM 4:00 PM 4:39 PM 4:50 PM 0:42 5:32 PM 4-4 PM 0:41 4:15 PM 4:54 PM 5:05 PM 0:42 5:47 PM 4-5 PM 0:41 4:30 PM 5:09 PM 5:20 PM 0:05 4-2 PM 4:45 PM 5:24 PM 5:35 PM 0:42 6:17 PM 4-6 PM 0:41 5:00 PM 5:39 PM 5:50 PM 0:05 4-3 PM 5:15 PM 5:54 PM 6:05 PM 0:42 6:47 PM 4-7 PM 0:41 5:30 PM 6:09 PM 6:20 PM 0:05 4-1 PM 5:45 PM 6:24 PM 6:35 PM 0:05 4-4 PM 6:00 PM 6:39 PM 6:50 PM 0:05 4-2 PM 6:30 PM 7:09 PM 7:20 PM 0:05 4-3 PM 7:00 PM 7:39 PM 7:50 PM 0:05 Summary of Service Block Hrs.
Hrs. Miles 4-1 0.52 12.58 214.3 4-2 0.29 7.03 107.1 4-3 0.29 7.03 107.1 4-4 0.22 5.28 85.7 4-5 0.07 1.78 42.9 4-6 0.07 1.78 42.9 4-7 0.07 1.78 42.9 Rev.
1.55 37.28 642.80 DH 15.70 15.70 500.20 Total 17.25 52.98 1143.00
Original PDF, page 188
| Peak Period Only Schedule | ||
|---|---|---|
| Block Period DH-PO 1 2 3 LO DH to 1 Ret to 1 DH-PI | Block Period DH-PO 3 2 1 LO DH to 3 Ret to 3 DH-PI |
Proposed Service Plans | November 2019 4-1 AM 0:05 6:00 AM 6:13 AM 6:57 AM 0:37 7:34 4-2 AM 0:05 6:15 AM 6:28 AM 7:12 AM 0:37 7:49 4-3 AM 0:05 6:30 AM 6:43 AM 7:27 AM 0:37 8:04 4-4 AM 0:05 6:45 AM 6:58 AM 7:42 AM 0:37 8:19 4-5 AM 0:05 7:00 AM 7:13 AM 7:57 AM 0:36 4-6 AM 0:05 7:15 AM 7:28 AM 8:12 AM 0:36 4-7 AM 0:05 7:30 AM 7:43 AM 8:27 AM 0:36 4-1 AM 0:05 7:45 AM 7:58 AM 8:42 AM 0:36 4-2 AM 0:05 8:00 AM 8:13 AM 8:57 AM 0:36 4-3 AM 8:15 AM 8:28 AM 9:12 AM 0:36 4-4 AM 8:30 AM 8:43 AM 9:27 AM 0:36 4-2 Midday 0:41 3:00 PM 3:35 PM 3:45 PM 0:42 4:27 PM 4-3 PM 0:41 3:30 PM 4:09 PM 4:20 PM 0:42 5:02 PM 4-1 PM 0:41 4:00 PM 4:39 PM 4:50 PM 0:42 5:32 PM 4-4 PM 0:41 4:15 PM 4:54 PM 5:05 PM 0:42 5:47 PM 4-5 PM 0:41 4:30 PM 5:09 PM 5:20 PM 0:05 4-2 PM 4:45 PM 5:24 PM 5:35 PM 0:42 6:17 PM 4-6 PM 0:41 5:00 PM 5:39 PM 5:50 PM 0:05 4-3 PM 5:15 PM 5:54 PM 6:05 PM 0:42 6:47 PM 4-7 PM 0:41 5:30 PM 6:09 PM 6:20 PM 0:05 4-1 PM 5:45 PM 6:24 PM 6:35 PM 0:05 4-4 PM 6:00 PM 6:39 PM 6:50 PM 0:05 4-2 PM 6:30 PM 7:09 PM 7:20 PM 0:05 4-3 PM 7:00 PM 7:39 PM 7:50 PM 0:05 Summary of Service Block Hrs.
Hrs. Miles 4-1 0.22 5.28 85.7 4-2 0.29 7.03 107.1 4-3 0.29 7.03 107.1 4-4 0.22 5.28 85.7 4-5 0.07 1.78 42.9 4-6 0.07 1.78 42.9 4-7 0.07 1.78 42.9 Rev.
1.25 29.98 514.22 DH 16.98 16.98 542.40 Total 18.23 46.97 1056.62
Original PDF, page 189
| Southbound | |||
|---|---|---|---|
| 1 2 3 | |||
| Contra Costa College | San Pablo Dam P&R | SF Transbay Terminal | Total |
| Mileage 2.7 16.4 19.0 | |||
| AM Speed: | 8.0 40.0 19.2 28.0 | 48.0 23.8 | |
| Midday Speed: | 10.0 37.0 15.5 31.1 | 47.0 24.3 | |
| PM Speed: | 10.0 42.0 15.5 26.4 | 52.0 21.9 |
| Northbound | |||
|---|---|---|---|
| 3 2 1 | |||
| SF Transbay Terminal | San Pablo Dam P&R | Contra Costa College | Total |
| Mileage 16.4 2.7 19.1 | |||
| AM Speed: | 46.0 8.0 21.4 20.5 | 54.0 21.2 | |
| Midday Speed: | 32.0 10.0 31.1 16.3 | 42.0 27.2 | |
| PM Speed: | 35.0 10.0 28.0 16.3 | 45.0 25.4 |
| All-Day Schedule (15-minute peak service) | ||
|---|---|---|
| Block Period DH-PO 1 2 3 LO DH to 1 Ret to 1 DH-PI | Block Period DH-PO 3 2 1 LO DH to 3 Ret to 3 DH-PI |
Proposed Service Plans | November 2019 Route 5 Contra Costa College, San Pablo Dam P&R, SF Transbay Southbound Northbound Mileage 2.7 16.4 19.0 Mileage 16.4 2.7 19.1 AM 8.0 40.0 48.0 AM 46.0 8.0 54.0 Speed:
19.2 28.0 23.8 Speed: 21.4 20.5 21.2 Midday 10.0 37.0 47.0 Midday 32.0 10.0 42.0 Speed: 15.5 31.1 24.3 Speed: 31.1 16.3 27.2 PM 10.0 42.0 52.0 PM 35.0 10.0 45.0 Speed:
15.5 26.4 21.9 Speed: 28.0 16.3 25.4 5-1 AM 0:07 5:00 AM 5:08 AM 5:48 AM 0:33 6:21 5-2 AM 0:07 5:30 AM 5:38 AM 6:18 AM 0:33 6:51 5-3 AM 0:07 6:00 AM 6:08 AM 6:48 AM 0:33 7:21 5-4 AM 0:07 6:30 AM 6:38 AM 7:18 AM 0:33 7:51 5-1 AM 6:45 AM 6:53 AM 7:33 AM 0:33 8:06 5-5 AM 0:07 7:00 AM 7:08 AM 7:48 AM 0:27 5-2 AM 7:15 AM 7:23 AM 8:03 AM 0:33 8:36 5-6 AM 0:07 7:30 AM 7:38 AM 8:18 AM 0:27 5-3 AM 7:45 AM 7:53 AM 8:33 AM 0:27 5-3 Midday 9:00 AM 9:32 AM 9:42 AM 0:18 5-7 AM 0:07 8:00 AM 8:08 AM 8:48 AM 0:27 5-4 AM 8:15 AM 8:23 AM 9:03 AM 0:27 5-1 AM 8:30 AM 8:38 AM 9:18 AM 0:27 5-2 AM 9:00 AM 9:08 AM 9:48 AM 0:27 5-3 Midday 10:00 AM 10:10 AM 10:47 AM 0:13 5-3 Midday 11:00 AM 11:32 AM 11:42 AM 0:18 5-3 Midday 12:00 PM 12:10 PM 12:47 PM 0:13 5-3 Midday 1:00 PM 1:32 PM 1:42 PM 0:18 5-3 Midday 2:00 PM 2:10 PM 2:47 PM 0:13 5-3 Midday 3:00 PM 3:32 PM 3:42 PM 0:38 4:20 PM 5-1 PM 0:32 3:30 PM 4:05 PM 4:15 PM 0:38 4:53 PM 5-2 PM 0:32 4:00 PM 4:35 PM 4:45 PM 0:38 5:23 PM 5-4 PM 0:32 4:15 PM 4:50 PM 5:00 PM 0:38 5:38 PM 5-3 PM 4:30 PM 5:05 PM 5:15 PM 0:07 5-5 PM 0:32 4:45 PM 5:20 PM 5:30 PM 0:38 6:08 PM 5-6 PM 0:32 5:00 PM 5:35 PM 5:45 PM 0:07 5-1 PM 5:15 PM 5:50 PM 6:00 PM 0:38 6:38 PM 5-7 PM 0:32 5:30 PM 6:05 PM 6:15 PM 0:07 5-2 PM 5:45 PM 6:20 PM 6:30 PM 0:07 5-4 PM 6:00 PM 6:35 PM 6:45 PM 0:07 5-5 PM 6:30 PM 7:05 PM 7:15 PM 0:07 5-1 PM 7:00 PM 7:35 PM 7:45 PM 0:07 Summary of Service Block Hrs.
Hrs. Miles 5-1 0.36 8.55 114.2 5-2 0.28 6.80 95.1 5-3 0.47 11.25 190.4 5-4 0.21 5.05 76.1 5-5 0.14 3.30 57.1 5-6 0.06 1.55 38.1 5-7 0.06 1.55 38.1 Rev.
38.05 609.12 DH 14.63 456.00 Total 52.68 1065.12
Original PDF, page 190
| Peak Period Only Schedule | ||
|---|---|---|
| Block Period DH-PO 1 2 3 LO DH to 1 Ret to 1 DH-PI | Block Period DH-PO 3 2 1 LO DH to 3 Ret to 3 DH-PI |
Proposed Service Plans | November 2019 5-1 AM 0:07 5:00 AM 5:08 AM 5:48 AM 0:33 6:21 5-2 AM 0:07 5:30 AM 5:38 AM 6:18 AM 0:33 6:51 5-3 AM 0:07 6:00 AM 6:08 AM 6:48 AM 0:33 7:21 5-4 AM 0:07 6:30 AM 6:38 AM 7:18 AM 0:33 7:51 5-1 AM 6:45 AM 6:53 AM 7:33 AM 0:33 8:06 5-5 AM 0:07 7:00 AM 7:08 AM 7:48 AM 0:27 5-2 AM 7:15 AM 7:23 AM 8:03 AM 0:33 8:36 5-6 AM 0:07 7:30 AM 7:38 AM 8:18 AM 0:27 5-3 AM 7:45 AM 7:53 AM 8:33 AM 0:27 5-7 AM 0:07 8:00 AM 8:08 AM 8:48 AM 0:27 5-4 AM 8:15 AM 8:23 AM 9:03 AM 0:27 5-1 AM 8:30 AM 8:38 AM 9:18 AM 0:27 5-2 AM 9:00 AM 9:08 AM 9:48 AM 0:27 5-3 Midday 0:32 3:00 PM 3:32 PM 3:42 PM 0:38 4:20 PM 5-1 PM 0:32 3:30 PM 4:05 PM 4:15 PM 0:38 4:53 PM 5-2 PM 0:32 4:00 PM 4:35 PM 4:45 PM 0:38 5:23 PM 5-4 PM 0:32 4:15 PM 4:50 PM 5:00 PM 0:38 5:38 PM 5-3 PM 4:30 PM 5:05 PM 5:15 PM 0:07 5-5 PM 0:32 4:45 PM 5:20 PM 5:30 PM 0:38 6:08 PM 5-6 PM 0:32 5:00 PM 5:35 PM 5:45 PM 0:07 5-1 PM 5:15 PM 5:50 PM 6:00 PM 0:38 6:38 PM 5-7 PM 0:32 5:30 PM 6:05 PM 6:15 PM 0:07 5-2 PM 5:45 PM 6:20 PM 6:30 PM 0:07 5-4 PM 6:00 PM 6:35 PM 6:45 PM 0:07 5-5 PM 6:30 PM 7:05 PM 7:15 PM 0:07 5-1 PM 7:00 PM 7:35 PM 7:45 PM 0:07 Summary of Service Block Hrs.
Hrs. Miles 5-1 0.31 7.55 114.2 5-2 0.28 6.80 95.1 5-3 0.20 4.80 76.1 5-4 0.21 5.05 76.1 5-5 0.14 3.30 57.1 5-6 0.06 1.55 38.1 5-7 0.06 1.55 38.1 Rev.
30.60 494.91 DH 15.62 487.00 Total 46.22 981.91
Original PDF, page 191
| Southbound | ||||||
|---|---|---|---|---|---|---|
| 1 2 3 4 5 6 | ||||||
| Contra Costa College | Richmond East P&R | 65th/Hollis | 19th Street BART | 12th Street BART | 2nd/Washington (J. London Sq.) | Total |
| Mileage 4.0 7.7 2.8 0.4 0.7 15.6 | ||||||
| AM Speed: | 18.0 16.0 13.0 2.0 5.0 13.5 28.3 13.0 10.7 7.7 | 54.0 17.3 | ||||
| Midday Speed: | 18.0 15.0 14.0 3.0 5.0 13.5 30.9 11.8 9.5 8.8 | 55.0 17.0 | ||||
| PM Speed: | 18.0 15.0 13.0 3.0 5.0 13.5 31.2 13.0 9.5 8.8 | 54.0 17.3 |
| Northbound | ||||||
|---|---|---|---|---|---|---|
| 6 5 4 3 2 1 | ||||||
| 2nd/Washington (J. London Sq.) | 12th Street BART | 19th Street BART | 65th/Hollis | Richmond East P&R | Contra Costa College | Total |
| Mileage 0.74 0.4 2.3 6.9 3.9 14.3 | ||||||
| AM Speed: | 5.0 3.0 11.0 16.0 17.0 9.1 9.5 12.5 26.1 13.8 | 52.0 16.5 | ||||
| Midday Speed: | 5.0 3.0 11.0 13.0 17.0 9.1 9.5 12.5 31.5 13.8 | 49.0 17.5 | ||||
| PM Speed: | 6.0 3.0 11.0 15.0 17.0 7.7 8.0 12.5 27.8 13.8 | 52.0 16.5 |
| All-Day Schedule (15-minute peak service) | ||
|---|---|---|
| Block Period DH-PO 1 2 3 4 5 6 LO DH to 1 Ret to 1 DH-PI | Block Period DH-PO 6 5 4 3 2 1 LO DH to 6 Ret to 6 DH-PI |
Proposed Service Plans | November 2019 Route 6 Contra Costa College, Richmond East Oakland & J. London Sq. Southbound Northbound Deadhead Distances an Mileage 4.0 7.7 2.8 0.4 0.7 15.6 Mileage 0.74 0.4 2.3 6.9 3.9 14.3 AM 18.0 16.0 13.0 2.0 5.0 54.0 AM 5.0 3.0 11.0 16.0 17.0 52.0 Garage-CCC Speed:
13.5 28.3 13.0 10.7 7.7 17.3 Speed: 9.1 9.5 12.5 26.1 13.8 16.5 J London-CC Midday 18.0 15.0 14.0 3.0 5.0 55.0 Midday 5.0 3.0 11.0 13.0 17.0 49.0 J London-G Speed:
13.5 30.9 11.8 9.5 8.8 17.0 Speed: 9.1 9.5 12.5 31.5 13.8 17.5 PM 18.0 15.0 13.0 3.0 5.0 54.0 PM 6.0 3.0 11.0 15.0 17.0 52.0 Speed: 13.5 31.2 13.0 9.5 8.8 17.3 Speed:
7.7 8.0 12.5 27.8 13.8 16.5 6-1 AM 0:07 5:00 AM 5:18 AM 5:34 AM 5:47 AM 5:49 AM 5:54 AM 0:27 6:21 6-2 AM 0:07 5:30 AM 5:48 AM 6:04 AM 6:17 AM 6:19 AM 6:24 AM 0:27 6:51 6-3 AM 0:07 6:00 AM 6:18 AM 6:34 AM 6:47 AM 6:49 AM 6:54 AM 0:27 7:21 6-1 AM 6:30 AM 6:48 AM 7:04 AM 7:17 AM 7:19 AM 7:24 AM 0:27 7:51 6-4 AM 0:07 6:45 AM 7:03 AM 7:19 AM 7:32 AM 7:34 AM 7:39 AM 0:27 8:06 6-2 AM 7:00 AM 7:18 AM 7:34 AM 7:47 AM 7:49 AM 7:54 AM 0:27 8:21 6-5 AM 0:07 7:15 AM 7:33 AM 7:49 AM 8:02 AM 8:04 AM 8:09 AM 0:21 6-3 AM 7:30 AM 7:48 AM 8:04 AM 8:17 AM 8:19 AM 8:24 AM 0:27 8:51 6-6 AM 0:07 7:45 AM 8:03 AM 8:19 AM 8:32 AM 8:34 AM 8:39 AM 0:26 6-6 Midday 9:00 AM 9:05 AM 9:08 AM 9:19 AM 9:32 AM 9:49 AM 0:11 6-1 AM 8:00 AM 8:18 AM 8:34 AM 8:47 AM 8:49 AM 8:54 AM 0:21 6-4 AM 8:15 AM 8:33 AM 8:49 AM 9:02 AM 9:04 AM 9:09 AM 0:21 6-2 AM 8:30 AM 8:48 AM 9:04 AM 9:17 AM 9:19 AM 9:24 AM 0:21 6-3 AM 9:00 AM 9:18 AM 9:34 AM 9:47 AM 9:49 AM 9:54 AM 0:21 6-6 Midday 10:00 AM 10:18 AM 10:33 AM 10:47 AM 10:50 AM 10:55 AM 0:10 6-6 Midday 11:00 AM 11:05 AM 11:08 AM 11:19 AM 11:32 AM 11:49 AM 0:11 6-6 Midday 12:00 PM 12:18 PM 12:33 PM 12:47 PM 12:50 PM 12:55 PM 0:10 6-6 Midday 1:00 PM 1:05 PM 1:08 PM 1:19 PM 1:32 PM 1:49 PM 0:11 6-6 Midday 2:00 PM 2:18 PM 2:33 PM 2:47 PM 2:50 PM 2:55 PM 0:10 6-6 Midday 3:00 PM 3:05 PM 3:08 PM 3:19 PM 3:32 PM 3:49 PM 0:27 4:16 PM 6-1 PM 0:35 3:30 PM 3:36 PM 3:39 PM 3:50 PM 4:05 PM 4:22 PM 0:27 4:49 PM 6-2 PM 0:35 4:00 PM 4:06 PM 4:09 PM 4:20 PM 4:35 PM 4:52 PM 0:27 5:19 PM 6-3 PM 0:35 4:15 PM 4:21 PM 4:24 PM 4:35 PM 4:50 PM 5:07 PM 0:27 5:34 PM 6-6 PM 4:30 PM 4:36 PM 4:39 PM 4:50 PM 5:05 PM 5:22 PM 0:27 5:49 PM 6-4 PM 0:35 4:45 PM 4:51 PM 4:54 PM 5:05 PM 5:20 PM 5:37 PM 0:07 6-1 PM 5:00 PM 5:06 PM 5:09 PM 5:20 PM 5:35 PM 5:52 PM 0:27 6:19 PM 6-5 PM 0:35 5:15 PM 5:21 PM 5:24 PM 5:35 PM 5:50 PM 6:07 PM 0:07 6-2 PM 5:30 PM 5:36 PM 5:39 PM 5:50 PM 6:05 PM 6:22 PM 0:27 6:49 PM 6-3 PM 5:45 PM 5:51 PM 5:54 PM 6:05 PM 6:20 PM 6:37 PM 0:07 6-6 PM 6:00 PM 6:06 PM 6:09 PM 6:20 PM 6:35 PM 6:52 PM 0:07 6-1 PM 6:30 PM 6:36 PM 6:39 PM 6:50 PM 7:05 PM 7:22 PM 0:07 6-2 PM 7:00 PM 7:06 PM 7:09 PM 7:20 PM 7:35 PM 7:52 PM 0:07 Summary of Service Block Hrs.
Hrs. Miles 6-1 0.32 7.77 89.5 6-2 0.32 7.77 89.5 6-3 0.26 6.27 75.3 6-4 0.14 3.27 45.4 6-5 0.07 1.77 29.8 6-6 0.46 11.12 147.9 Rev. 37.95 477.44 DH 12.37 378.80 Total 50.32 856.24
Original PDF, page 192
| Peak Period Only Schedule | ||
|---|---|---|
| Block Period DH-PO 1 2 3 4 5 6 LO DH to 1 Ret to 1 DH-PI | Block Period DH-PO 6 5 4 3 2 1 LO DH to 6 Ret to 6 DH-PI |
Proposed Service Plans | November 2019 6-1 AM 0:07 5:00 AM 5:18 AM 5:34 AM 5:47 AM 5:49 AM 5:54 AM 0:27 6:21 6-2 AM 0:07 5:30 AM 5:48 AM 6:04 AM 6:17 AM 6:19 AM 6:24 AM 0:27 6:51 6-3 AM 0:07 6:00 AM 6:18 AM 6:34 AM 6:47 AM 6:49 AM 6:54 AM 0:27 7:21 6-1 AM 6:30 AM 6:48 AM 7:04 AM 7:17 AM 7:19 AM 7:24 AM 0:27 7:51 6-4 AM 0:07 6:45 AM 7:03 AM 7:19 AM 7:32 AM 7:34 AM 7:39 AM 0:27 8:06 6-2 AM 7:00 AM 7:18 AM 7:34 AM 7:47 AM 7:49 AM 7:54 AM 0:27 8:21 6-5 AM 0:07 7:15 AM 7:33 AM 7:49 AM 8:02 AM 8:04 AM 8:09 AM 0:21 6-3 AM 7:30 AM 7:48 AM 8:04 AM 8:17 AM 8:19 AM 8:24 AM 0:27 8:51 6-6 AM 0:07 7:45 AM 8:03 AM 8:19 AM 8:32 AM 8:34 AM 8:39 AM 0:21 6-1 AM 8:00 AM 8:18 AM 8:34 AM 8:47 AM 8:49 AM 8:54 AM 0:21 6-4 AM 8:15 AM 8:33 AM 8:49 AM 9:02 AM 9:04 AM 9:09 AM 0:21 6-2 AM 8:30 AM 8:48 AM 9:04 AM 9:17 AM 9:19 AM 9:24 AM 0:21 6-3 AM 9:00 AM 9:18 AM 9:34 AM 9:47 AM 9:49 AM 9:54 AM 0:21 6-6 Midday 0:35 3:00 PM 3:05 PM 3:08 PM 3:19 PM 3:32 PM 3:49 PM 0:27 4:16 PM 6-1 PM 0:35 3:30 PM 3:36 PM 3:39 PM 3:50 PM 4:05 PM 4:22 PM 0:27 4:49 PM 6-2 PM 0:35 4:00 PM 4:06 PM 4:09 PM 4:20 PM 4:35 PM 4:52 PM 0:27 5:19 PM 6-3 PM 0:35 4:15 PM 4:21 PM 4:24 PM 4:35 PM 4:50 PM 5:07 PM 0:27 5:34 PM 6-6 PM 4:30 PM 4:36 PM 4:39 PM 4:50 PM 5:05 PM 5:22 PM 0:27 5:49 PM 6-4 PM 0:35 4:45 PM 4:51 PM 4:54 PM 5:05 PM 5:20 PM 5:37 PM 0:07 6-1 PM 5:00 PM 5:06 PM 5:09 PM 5:20 PM 5:35 PM 5:52 PM 0:27 6:19 PM 6-5 PM 0:35 5:15 PM 5:21 PM 5:24 PM 5:35 PM 5:50 PM 6:07 PM 0:07 6-2 PM 5:30 PM 5:36 PM 5:39 PM 5:50 PM 6:05 PM 6:22 PM 0:27 6:49 PM 6-3 PM 5:45 PM 5:51 PM 5:54 PM 6:05 PM 6:20 PM 6:37 PM 0:07 6-6 PM 6:00 PM 6:06 PM 6:09 PM 6:20 PM 6:35 PM 6:52 PM 0:07 6-1 PM 6:30 PM 6:36 PM 6:39 PM 6:50 PM 7:05 PM 7:22 PM 0:07 6-2 PM 7:00 PM 7:06 PM 7:09 PM 7:20 PM 7:35 PM 7:52 PM 0:07 Summary of Service Block Hrs.
Hrs. Miles 6-1 0.32 7.77 89.5 6-2 0.32 7.77 89.5 6-3 0.26 6.27 75.3 6-4 0.14 3.27 45.4 6-5 0.07 1.77 29.8 6-6 0.20 4.77 58.4 Rev. 31.60 387.92 DH 13.30 403.40 Total 44.90 791.32
Original PDF, page 193
| Southbound | |||||
|---|---|---|---|---|---|
| 1 2 3 4 5 | |||||
| Contra Costa College | Richmond East P&R | Gilman / 6th | Downtown Berkeley BART | Shattuck / Dwight Way | Total |
| Mileage 4.0 5.1 2.6 0.5 12.1 | |||||
| AM Speed: | 18.0 10.0 12.0 3.0 13.5 29.7 13.3 11.1 | 43.0 16.8 | |||
| Midday Speed: | 18.0 8.0 13.0 3.0 13.5 36.4 11.7 10.0 | 42.0 17.2 | |||
| PM Speed: | 18.0 8.0 14.0 3.0 13.5 36.6 10.7 9.4 | 43.0 16.8 |
| Northbound | |||||
|---|---|---|---|---|---|
| 5 4 3 2 1 | |||||
| Shattuck / Dwight Way | Downtown Berkeley BART | Gilman / 6th | MacDonald Ave. P&R | Contra Costa College | Total |
| Mileage 0.47 2.6 4.6 3.9 11.6 | |||||
| AM Speed: | 3.0 11.0 12.0 17.0 10.1 13.6 23.7 13.9 | 43.0 16.1 | |||
| Midday Speed: | 3.0 13.0 8.0 17.0 9.2 12.0 35.2 13.9 | 41.0 16.9 | |||
| PM Speed: | 3.0 14.0 10.0 17.0 8.7 10.9 26.9 13.9 | 44.0 15.8 |
| All-Day Schedule (15-minute peak service) | ||
|---|---|---|
| Block Period DH-PO 1 2 3 4 5 LO DH to 1 Ret to 1 DH-PI | Block Period DH-PO 5 4 3 2 1 Recovery DH to 6 Ret to 6 DH-PI |
Proposed Service Plans | November 2019 Route 7 Contra Costa College, Richmond East, Berkeley Southbound Northbound Mileage 4.0 5.1 2.6 0.5 12.1 Mileage 0.47 2.6 4.6 3.9 11.6 AM 18.0 10.0 12.0 3.0 43.0 AM 3.0 11.0 12.0 17.0 43.0 Speed:
13.5 29.7 13.3 11.1 16.8 Speed: 10.1 13.6 23.7 13.9 16.1 Midday 18.0 8.0 13.0 3.0 42.0 Midday 3.0 13.0 8.0 17.0 41.0 Speed: 13.5 36.4 11.7 10.0 17.2 Speed:
9.2 12.0 35.2 13.9 16.9 PM 18.0 8.0 14.0 3.0 43.0 PM 3.0 14.0 10.0 17.0 44.0 Speed: 13.5 36.6 10.7 9.4 16.8 Speed: 8.7 10.9 26.9 13.9 15.8 7-1 AM 0:07 5:00 AM 5:18 AM 5:28 AM 5:40 AM 5:43 AM 0:25 6:08 7-2 AM 0:07 5:30 AM 5:48 AM 5:58 AM 6:10 AM 6:13 AM 0:25 6:38 7-3 AM 0:07 6:00 AM 6:18 AM 6:28 AM 6:40 AM 6:43 AM 0:25 7:08 7-1 AM 6:30 AM 6:48 AM 6:58 AM 7:10 AM 7:13 AM 0:25 7:38 7-4 AM 0:07 6:45 AM 7:03 AM 7:13 AM 7:25 AM 7:28 AM 0:25 7:53 7-2 AM 7:00 AM 7:18 AM 7:28 AM 7:40 AM 7:43 AM 0:25 8:08 7-5 AM 0:07 7:15 AM 7:33 AM 7:43 AM 7:55 AM 7:58 AM 0:18 7-3 AM 7:30 AM 7:48 AM 7:58 AM 8:10 AM 8:13 AM 0:25 8:38 7-6 AM 0:07 7:45 AM 8:03 AM 8:13 AM 8:25 AM 8:28 AM 0:18 7-1 AM 8:00 AM 8:18 AM 8:28 AM 8:40 AM 8:43 AM 0:17 7-1 Midday 9:00 AM 9:03 AM 9:16 AM 9:24 AM 9:41 AM 0:19 7-4 AM 8:15 AM 8:33 AM 8:43 AM 8:55 AM 8:58 AM 0:18 7-2 AM 8:30 AM 8:48 AM 8:58 AM 9:10 AM 9:13 AM 0:18 7-3 AM 9:00 AM 9:18 AM 9:28 AM 9:40 AM 9:43 AM 0:18 7-1 Midday 10:00 AM 10:18 AM 10:26 AM 10:39 AM 10:42 AM 7-1 Midday 11:00 AM 11:03 AM 11:16 AM 11:24 AM 11:41 AM 0:19 7-1 Midday 12:00 PM 12:18 PM 12:26 PM 12:39 PM 12:42 PM 7-1 Midday 1:00 PM 1:03 PM 1:16 PM 1:24 PM 1:41 PM 0:19 7-1 Midday 2:00 PM 2:18 PM 2:26 PM 2:39 PM 2:42 PM 7-1 Midday 3:00 PM 3:03 PM 3:16 PM 3:24 PM 3:41 PM 0:25 4:06 PM 7-2 PM 0:35 3:30 PM 3:33 PM 3:47 PM 3:57 PM 4:14 PM 0:25 4:39 PM 7-3 PM 0:35 4:00 PM 4:03 PM 4:17 PM 4:27 PM 4:44 PM 0:25 5:09 PM 7-4 PM 0:35 4:15 PM 4:18 PM 4:32 PM 4:42 PM 4:59 PM 0:25 5:24 PM 7-1 PM 4:30 PM 4:33 PM 4:47 PM 4:57 PM 5:14 PM 0:25 5:39 PM 7-5 PM 0:35 4:45 PM 4:48 PM 5:02 PM 5:12 PM 5:29 PM 0:07 7-2 PM 5:00 PM 5:03 PM 5:17 PM 5:27 PM 5:44 PM 0:25 6:09 PM 7-6 PM 0:35 5:15 PM 5:18 PM 5:32 PM 5:42 PM 5:59 PM 0:07 7-3 PM 5:30 PM 5:33 PM 5:47 PM 5:57 PM 6:14 PM 0:25 6:39 PM 7-4 PM 5:45 PM 5:48 PM 6:02 PM 6:12 PM 6:29 PM 0:07 7-1 PM 6:00 PM 6:03 PM 6:17 PM 6:27 PM 6:44 PM 0:07 7-2 PM 6:30 PM 6:33 PM 6:47 PM 6:57 PM 7:14 PM 0:07 7-3 PM 7:00 PM 7:03 PM 7:17 PM 7:27 PM 7:44 PM 0:07 Summary of Service Block Hrs.
Hrs. Miles 7-1 0.57 13.73 141.6 7-2 0.31 7.45 70.8 7-3 0.31 7.45 70.8 7-4 0.19 4.45 47.2 7-5 0.06 1.45 23.6 7-6 0.06 1.45 23.6 Rev. 35.98 377.60 DH 11.65 298.20 Total 47.63 675.80
Original PDF, page 194
| Peak Period Only Schedule | ||
|---|---|---|
| Block Period DH-PO 1 2 3 4 5 LO DH to 1 Ret to 1 DH-PI | Block Period DH-PO 5 4 3 2 1 Recovery DH to 6 Ret to 6 DH-PI |
Proposed Service Plans | November 2019 7-1 AM 0:07 5:00 AM 5:18 AM 5:28 AM 5:40 AM 5:43 AM 0:25 6:08 7-2 AM 0:07 5:30 AM 5:48 AM 5:58 AM 6:10 AM 6:13 AM 0:25 6:38 7-3 AM 0:07 6:00 AM 6:18 AM 6:28 AM 6:40 AM 6:43 AM 0:25 7:08 7-1 AM 6:30 AM 6:48 AM 6:58 AM 7:10 AM 7:13 AM 0:25 7:38 7-4 AM 0:07 6:45 AM 7:03 AM 7:13 AM 7:25 AM 7:28 AM 0:25 7:53 7-2 AM 7:00 AM 7:18 AM 7:28 AM 7:40 AM 7:43 AM 0:25 8:08 7-5 AM 0:07 7:15 AM 7:33 AM 7:43 AM 7:55 AM 7:58 AM 0:18 7-3 AM 7:30 AM 7:48 AM 7:58 AM 8:10 AM 8:13 AM 0:25 8:38 7-6 AM 0:07 7:45 AM 8:03 AM 8:13 AM 8:25 AM 8:28 AM 0:18 7-1 AM 8:00 AM 8:18 AM 8:28 AM 8:40 AM 8:43 AM 0:18 7-4 AM 8:15 AM 8:33 AM 8:43 AM 8:55 AM 8:58 AM 0:18 7-2 AM 8:30 AM 8:48 AM 8:58 AM 9:10 AM 9:13 AM 0:18 7-3 AM 9:00 AM 9:18 AM 9:28 AM 9:40 AM 9:43 AM 0:18 7-1 Midday 0:35 3:00 PM 3:03 PM 3:16 PM 3:24 PM 3:41 PM 0:25 4:06 PM 7-2 PM 0:35 3:30 PM 3:33 PM 3:47 PM 3:57 PM 4:14 PM 0:25 4:39 PM 7-3 PM 0:35 4:00 PM 4:03 PM 4:17 PM 4:27 PM 4:44 PM 0:25 5:09 PM 7-4 PM 0:35 4:15 PM 4:18 PM 4:32 PM 4:42 PM 4:59 PM 0:25 5:24 PM 7-1 PM 4:30 PM 4:33 PM 4:47 PM 4:57 PM 5:14 PM 0:25 5:39 PM 7-5 PM 0:35 4:45 PM 4:48 PM 5:02 PM 5:12 PM 5:29 PM 0:07 7-2 PM 5:00 PM 5:03 PM 5:17 PM 5:27 PM 5:44 PM 0:25 6:09 PM 7-6 PM 0:35 5:15 PM 5:18 PM 5:32 PM 5:42 PM 5:59 PM 0:07 7-3 PM 5:30 PM 5:33 PM 5:47 PM 5:57 PM 6:14 PM 0:25 6:39 PM 7-4 PM 5:45 PM 5:48 PM 6:02 PM 6:12 PM 6:29 PM 0:07 7-1 PM 6:00 PM 6:03 PM 6:17 PM 6:27 PM 6:44 PM 0:07 7-2 PM 6:30 PM 6:33 PM 6:47 PM 6:57 PM 7:14 PM 0:07 7-3 PM 7:00 PM 7:03 PM 7:17 PM 7:27 PM 7:44 PM 0:07 Summary of Service Block Hrs.
Hrs. Miles 7-1 0.31 7.45 70.8 7-2 0.31 7.45 70.8 7-3 0.31 7.45 70.8 7-4 0.19 4.45 47.2 7-5 0.06 1.45 23.6 7-6 0.06 1.45 23.6 Rev. 29.70 306.80 DH 12.53 316.20 Total 42.23 623.00
Original PDF, page 195
| Southbound | |||||
|---|---|---|---|---|---|
| 1 2 3 4 5 | |||||
| Contra Costa College | Richmond West P&R | 19th Street BART | 12th Street BART | 2nd/Washingto n (J. London Sq.) | Total |
| Mileage 3.7 11.2 0.4 0.7 16.0 | |||||
| AM Speed: | 15.0 25.0 2.0 4.0 14.9 26.7 10.7 10.2 | 46.0 20.9 | |||
| Midday Speed: | 15.0 26.0 3.0 4.0 14.9 26.3 9.5 9.2 | 48.0 20.0 | |||
| PM Speed: | 17.0 25.0 3.0 4.0 13.0 27.1 9.5 9.2 | 49.0 19.6 |
| Northbound | |||||
|---|---|---|---|---|---|
| 5 4 3 2 1 | |||||
| 2nd/Washingto n (J. London Sq.) | 12th Street BART | 19th Street BART | Richmond West P&R | Contra Costa College | Total |
| Mileage 0.74 0.4 11.1 3.8 16.0 | |||||
| AM Speed: | 4.0 2.0 22.0 16.0 10.5 10.7 30.7 14.1 | 44.0 21.8 | |||
| Midday Speed: | 5.0 3.0 23.0 16.0 9.5 9.5 29.0 14.1 | 47.0 20.4 | |||
| PM Speed: | 5.0 3.0 29.0 17.0 9.5 9.5 22.7 13.1 | 54.0 17.7 |
| All-Day Schedule (15-minute peak service) | ||
|---|---|---|
| Block Period DH-PO 1 2 3 4 5 LO DH to 1 Ret to 1 DH-PI | Block Period DH-PO 5 4 3 2 1 Recovery DH to 6 Ret to 6 DH-PI |
Proposed Service Plans | November 2019 Route 8 Contra Costa College, Rumrill Blvd. Oakland, J. London Sq. Southbound Northbound Mileage 3.7 11.2 0.4 0.7 16.0 Mileage 0.74 0.4 11.1 3.8 16.0 AM 15.0 25.0 2.0 4.0 46.0 AM 4.0 2.0 22.0 16.0 44.0 Speed:
14.9 26.7 10.7 10.2 20.9 Speed: 10.5 10.7 30.7 14.1 21.8 Midday 15.0 26.0 3.0 4.0 48.0 Midday 5.0 3.0 23.0 16.0 47.0 Speed: 14.9 26.3 9.5 9.2 20.0 Speed:
9.5 9.5 29.0 14.1 20.4 PM 17.0 25.0 3.0 4.0 49.0 PM 5.0 3.0 29.0 17.0 54.0 Speed: 13.0 27.1 9.5 9.2 19.6 Speed: 9.5 9.5 22.7 13.1 17.7 8-1 AM 0:07 5:00 AM 5:15 AM 5:40 AM 5:42 AM 5:46 AM 0:31 6:17 8-2 AM 0:07 5:30 AM 5:45 AM 6:10 AM 6:12 AM 6:16 AM 0:31 6:47 8-3 AM 0:07 6:00 AM 6:15 AM 6:40 AM 6:42 AM 6:46 AM 0:31 7:17 8-1 AM 6:30 AM 6:45 AM 7:10 AM 7:12 AM 7:16 AM 0:31 7:47 8-4 AM 6:45 AM 7:00 AM 7:25 AM 7:27 AM 7:31 AM 0:31 8:02 8-2 AM 7:00 AM 7:15 AM 7:40 AM 7:42 AM 7:46 AM 0:31 8:17 8-5 AM 7:15 AM 7:30 AM 7:55 AM 7:57 AM 8:01 AM 0:25 8-3 AM 7:30 AM 7:45 AM 8:10 AM 8:12 AM 8:16 AM 0:31 8:47 8-6 AM 7:45 AM 8:00 AM 8:25 AM 8:27 AM 8:31 AM 0:25 8-1 AM 8:00 AM 8:15 AM 8:40 AM 8:42 AM 8:46 AM 0:14 8-1 Midday 9:00 AM 9:05 AM 9:08 AM 9:31 AM 9:47 AM 0:13 8-4 AM 8:15 AM 8:30 AM 8:55 AM 8:57 AM 9:01 AM 0:25 8-2 AM 8:30 AM 8:45 AM 9:10 AM 9:12 AM 9:16 AM 0:25 8-3 AM 9:00 AM 9:15 AM 9:40 AM 9:42 AM 9:46 AM 0:25 8-1 Midday 10:00 AM 10:15 AM 10:41 AM 10:44 AM 10:48 AM 8-1 Midday 11:00 AM 11:05 AM 11:08 AM 11:31 AM 11:47 AM 0:13 8-1 Midday 12:00 PM 12:15 PM 12:41 PM 12:44 PM 12:48 PM 8-1 Midday 1:00 PM 1:05 PM 1:08 PM 1:31 PM 1:47 PM 0:13 8-1 Midday 2:00 PM 2:15 PM 2:41 PM 2:44 PM 2:48 PM 8-1 Midday 3:00 PM 3:05 PM 3:08 PM 3:31 PM 3:47 PM 0:31 4:18 PM 8-2 PM 0:35 3:30 PM 3:35 PM 3:38 PM 4:07 PM 4:24 PM 0:31 4:55 PM 8-3 PM 0:35 4:00 PM 4:05 PM 4:08 PM 4:37 PM 4:54 PM 0:31 5:25 PM 8-4 PM 0:35 4:15 PM 4:20 PM 4:23 PM 4:52 PM 5:09 PM 0:31 5:40 PM 8-1 PM 4:30 PM 4:35 PM 4:38 PM 5:07 PM 5:24 PM 0:07 8-5 PM 0:35 4:45 PM 4:50 PM 4:53 PM 5:22 PM 5:39 PM 0:31 6:10 PM 8-6 PM 0:35 5:00 PM 5:05 PM 5:08 PM 5:37 PM 5:54 PM 0:07 8-2 PM 5:15 PM 5:20 PM 5:23 PM 5:52 PM 6:09 PM 0:31 6:40 PM 8-7 PM 0:35 5:30 PM 5:35 PM 5:38 PM 6:07 PM 6:24 PM 0:07 8-3 PM 5:45 PM 5:50 PM 5:53 PM 6:22 PM 6:39 PM 0:07 8-4 PM 6:00 PM 6:05 PM 6:08 PM 6:37 PM 6:54 PM 0:07 8-5 PM 6:30 PM 6:35 PM 6:38 PM 7:07 PM 7:24 PM 0:07 8-2 PM 7:00 PM 7:05 PM 7:08 PM 7:37 PM 7:54 PM 0:07 Summary of Service Block Hrs.
Hrs. Miles 8-1 0.58 13.90 176.0 8-2 0.32 7.67 96.0 8-3 0.32 7.67 80.0 8-4 0.19 4.67 64.0 8-5 0.07 1.67 48.0 8-6 0.07 1.67 32.0 8-7 0.04 0.90 16.0 Rev.
38.13 512.00 DH 13.47 369.40 Total 51.60 881.40
Original PDF, page 196
| Peak Period Only Schedule | ||
|---|---|---|
| Block Period DH-PO 1 2 3 4 5 LO DH to 1 Ret to 1 DH-PI | Block Period DH-PO 5 4 3 2 1 Recovery DH to 6 Ret to 6 DH-PI |
Proposed Service Plans | November 2019 8-1 AM 0:07 5:00 AM 5:15 AM 5:40 AM 5:42 AM 5:46 AM 0:31 6:17 8-2 AM 0:07 5:30 AM 5:45 AM 6:10 AM 6:12 AM 6:16 AM 0:31 6:47 8-3 AM 0:07 6:00 AM 6:15 AM 6:40 AM 6:42 AM 6:46 AM 0:31 7:17 8-1 AM 6:30 AM 6:45 AM 7:10 AM 7:12 AM 7:16 AM 0:31 7:47 8-4 AM 6:45 AM 7:00 AM 7:25 AM 7:27 AM 7:31 AM 0:31 8:02 8-2 AM 7:00 AM 7:15 AM 7:40 AM 7:42 AM 7:46 AM 0:31 8:17 8-5 AM 7:15 AM 7:30 AM 7:55 AM 7:57 AM 8:01 AM 0:25 8-3 AM 7:30 AM 7:45 AM 8:10 AM 8:12 AM 8:16 AM 0:31 8:47 8-6 AM 7:45 AM 8:00 AM 8:25 AM 8:27 AM 8:31 AM 0:25 8-1 AM 8:00 AM 8:15 AM 8:40 AM 8:42 AM 8:46 AM 0:25 8-4 AM 8:15 AM 8:30 AM 8:55 AM 8:57 AM 9:01 AM 0:25 8-2 AM 8:30 AM 8:45 AM 9:10 AM 9:12 AM 9:16 AM 0:25 8-3 AM 9:00 AM 9:15 AM 9:40 AM 9:42 AM 9:46 AM 0:25 8-1 Midday 0:35 3:00 PM 3:05 PM 3:08 PM 3:31 PM 3:47 PM 0:31 4:18 PM 8-2 PM 0:35 3:30 PM 3:35 PM 3:38 PM 4:07 PM 4:24 PM 0:31 4:55 PM 8-3 PM 0:35 4:00 PM 4:05 PM 4:08 PM 4:37 PM 4:54 PM 0:31 5:25 PM 8-4 PM 0:35 4:15 PM 4:20 PM 4:23 PM 4:52 PM 5:09 PM 0:31 5:40 PM 8-1 PM 4:30 PM 4:35 PM 4:38 PM 5:07 PM 5:24 PM 0:07 8-5 PM 0:35 4:45 PM 4:50 PM 4:53 PM 5:22 PM 5:39 PM 0:31 6:10 PM 8-6 PM 0:35 5:00 PM 5:05 PM 5:08 PM 5:37 PM 5:54 PM 0:07 8-2 PM 5:15 PM 5:20 PM 5:23 PM 5:52 PM 6:09 PM 0:31 6:40 PM 8-7 PM 0:35 5:30 PM 5:35 PM 5:38 PM 6:07 PM 6:24 PM 0:07 8-3 PM 5:45 PM 5:50 PM 5:53 PM 6:22 PM 6:39 PM 0:07 8-4 PM 6:00 PM 6:05 PM 6:08 PM 6:37 PM 6:54 PM 0:07 8-5 PM 6:30 PM 6:35 PM 6:38 PM 7:07 PM 7:24 PM 0:07 8-2 PM 7:00 PM 7:05 PM 7:08 PM 7:37 PM 7:54 PM 0:07 Summary of Service Block Hrs.
Hrs. Miles 8-1 0.32 7.67 80.0 8-2 0.32 7.67 96.0 8-3 0.32 7.67 80.0 8-4 0.19 4.67 64.0 8-5 0.07 1.67 48.0 8-6 0.07 1.67 32.0 8-7 0.04 0.90 16.0 Rev.
31.90 416.00 DH 14.47 394.00 Total 46.37 810.00
Original PDF, page 197
® ®
WEST CONTRA COSTA COUNTY
EXPRESS BUS IMPLEMENTATION PLAN H.
FINANCIAL PLAN
Final Plan | February 2020


FINANCIAL PLAN
January | 2020
Prepared by
Transportation Analytics
Financial Plan | January 2020 Transportation Analytics
EXECUTIVE SUMMARY
Based on earlier work in this study, a ten‐year financial outlook was developed to accompany the proposed list of express bus routes and the associated capital projects in the implementation plan. The proposed bus routes have been grouped into near‐term and long‐term phases and the capital projects have been segmented into required and optimal projects. The goal of the financial analysis is to determine which of these sub‐sets can be deployed within the envelope of available financial resources.
The committed funding for the new express bus routes comes primarily from two sources that are not yet accessible to the transit operator. The Metropolitan Transportation Commission’s Regional Measure 3 (RM3) and the Contra Costa Transportation Authority’s new Transportation Expenditure Plan (TEP) both have specific funding allocations dedicated to support the express bus services. However, RM3 is currently the subject of legal challenges so the funds are being held in escrow for the time being, and the TEP goes before voters later this year.
There are other minor funding sources available to supplement these core revenues, but they do not materially affect the findings & recommendations of the financial analysis.
Even under optimistic assumptions, RM3 alone cannot fund the buses and capital projects for any of the near‐term routes. As a result, approval of the TEP or securing another funding source would be required to be able to launch the plan as it is currently configured. If both RM3 and the TEP were to become available, the funding total would be enough to implement the required projects for the near‐term routes with some funds leftover to pursue a portion of the rest of the plan.
After building the required projects for the near‐term routes, the remaining funds are insufficient to fully build out either the set of required projects for the long‐term routes or the set of optimal projects for the near‐term routes.
However, they can support the full set of improvements associated with the near‐term routes except the transit center expansions at Hercules and Richmond Parkway. The balance of committed funding available to the project could be used either as a contribution towards the Hercules and Richmond Parkway projects, or it could support a scaled‐back set of improvements to expand parking capacity at these facilities while additional funding is secured.
In either case, under current assumptions for the near‐term routes and associated required projects, the annual allocation of available RM3 operating funds will be fully utilized within the 10‐year plan horizon, so additional operating contributions will need to come from either TEP or other funding sources. To fully implement the entire set of required and optimal projects for all of the proposed express bus facilities, additional financial resources should be secured. This would most likely come from competitive grant programs, such as California’s Solutions for Congested Corridors Program, the FTA Section 5339 Bus and Bus Facilities Program, and/or any one of the incentive grants available for purchase of Zero‐Emission Busses.
INTRODUCTION
This memo describes the financial analysis conducted for the final set of express bus routes and associated capital projects developed during earlier work in the West Contra Costa County Express Bus Implementation Plan study.
In particular, technical analysis of transit operational requirements and potential passenger demand were used to identify two phases of route deployment (near‐term and long‐term) and to prioritize and group the capital projects to fit this operational phasing. The specific list of bus routes and capital projects is described in more detail in the West Contra Costa County Express Bus Implementation Plan.
With the route phasing as a given, the financial analysis compared the capital and operating costs of the various plan components with the known and potential sources of funding that could be available to support
Original PDF, page 200
Financial Plan | January 2020 Transportation Analytics implementation. The goal of the analysis was to identify and confirm the feasible sub‐set of routes and projects that could be implemented within the known funding sources, and then to quantify the remaining funding gaps, if any, in order to help decision‐makers seek funding to support the implementation of the full Express Bus plan. The model uses a ten‐year planning horizon, which is the same timeframe as a typical Short‐Range Transit Plan used by many transit operators to assess their overall financial outlook.
The remainder of this memo is organized into three sections:
Funding Sources lists the set of capital and operating monies that were identified and considered in this analysis, including several sources that are well‐defined at this time and some additional prospective sources that should be investigated and pursued to complement the known sources.
Development of Financial Model describes the inputs and assumptions that shaped the financial calculations, including the critical path considerations that could change the financial outcomes calculated by the model.
Results of Financial Model explains the conclusions of the model calculations for two different identified scenarios and discusses recommendations for next steps.
FUNDING SOURCES
As with most transit projects, funding to support capital construction and system operations for the proposed express bus routes would come from a variety of sources and partners. Some funding has already been formally dedicated to the transit service being developed in this study; other funding sources appear to be a strong fit for the new routes, but they may require competitive applications or formal allocation by other partners before funds can be accessed. This section describes each funding sources considered in this study, including the usage restrictions and allocation guidelines that are relevant to the express bus routes, the assumptions used to develop estimates of available funds from each source used in the financial analysis, and highlights of sources that are the best candidates for seeking additional monies to support the new service.
MTC Regional Measure
In its role as the Bay Area Toll Authority (BATA), the Metropolitan Transportation Commission (MTC) operates the seven state‐owned toll bridges in the Bay Area. Through region‐wide ballot initiatives, MTC has received voter approval to charge additional tolls to support expenditure plans that, in part, provide transit service to help relieve traffic congestion in the bridge corridors. The most recent ballot initiative, known as Regional Measure 3 or RM3, was approved by voters in June 2018. The measure included specific line item funding allocations that would benefit new transit service in West Contra Costa County. MTC has been collecting the new RM3 tolls since January 2019, but several lawsuits have been filed challenging the validity of the measure, so MTC is holding the collected funds in escrow until the court challenges are fully resolved. Should the court find in favor of MTC, several funding allocations would become immediately available for the express bus services.
Original PDF, page 201
Financial Plan | January 2020 Transportation Analytics
I‐80 Transit Improvements
The RM3 expenditure plan includes a $25 million set‐aside for a group of capital projects known as “I‐80 Transit Improvements.” The funds have already been sub‐allocated to specific projects, three of which have a direct bearing on the West County express bus services:
WCCTA Bus Operations Facility Expansion and Modernization ($5 Million) – This allocation will cover the majority of the costs of the expansion of WestCAT facilities that would be necessary to launch additional express bus services. The design, timing, and budget of the facility improvements are beyond the scope of the express bus implementation plan, so the associated capital costs and revenues are not included in this financial analysis. However, completion of this capital project is necessary before new WestCAT‐ operated service can begin, so the availability of these RM3 revenues are on the critical path of deploying the new routes.
Express Bus Service Expansion in I‐80 Corridor (Bus Acquisition) ($5 Million) – This allocation will provide funding to acquire five new express bus vehicles for WestCAT service. In practice, the buses purchased with these funds may not be physically deployed on the routes identified in this study, but the fleet expansion will allow WestCAT to grow its available fleet, freeing up buses that could potentially be used on the new proposed routes.
I‐80 Corridor Transit Improvements in Contra Costa County ($15 Million) – This allocation will be evenly divided to support the capital projects that emerge from two on‐going planning studies: this study of express bus service in West Contra Costa County and a study of improvements to Rapid Bus and BRT services along San Pablo Avenue. Some of the recommendations for San Pablo could overlap with the projects needed for the new express bus routes, but the findings of the San Pablo study are still under development, so it is not possible to confirm how the San Pablo share will be allocated. The financial analysis assumes that half of the $15 million ($7.5 million) would be available for capital projects to support the proposed express bus service.
AC Transit Rapid Bus Corridor Improvements
The RM3 expenditure plan includes $100 million in funding for capital projects located on Rapid Bus corridors in the AC Transit route network. Several of the proposed express bus routes operate on corridors that currently have Rapid Bus service, such as Shattuck Avenue in Berkeley and 40th Street in Emeryville and Oakland. It is assumed that the capital projects on these specific routes, such as Transit Signal Priority, would be directly coordinated with and supported by AC Transit, and thus potentially eligible for a funding contribution from this source. The project team identified up to $1.5 million (2019$) in capital projects that are located on current Rapid Bus corridors, and the financial analysis assumed that the projects would all of their funding from this revenue source.
Regional Express Bus Operating Funds
In addition to the capital funds noted above, RM3 also includes operating funding. In particular, the expenditure program allocates $20 million per year towards regional express bus services. The routes proposed in this study relieve congestion in the bridge corridors and would almost certainly be eligible for these operating funds.
However, BATA has not yet defined a methodology for allocating the $20 million to different routes, transit operators, and geographies. The financial analysis makes the simplifying assumption that up to 25% of the funds ($5 million per year) could flow to support new express bus routes in West Contra Costa County. It should be noted that prior regional measures did not allow transit agencies to carry over unspent operating funds from year to year, and the same approach was assumed here. Also, the bridge toll increase does not escalate for inflation, so
Original PDF, page 202
Financial Plan | January 2020 Transportation Analytics it is assumed the $20 million total for this spending category will be held constant and its purchasing power will erode over time.
CCTA Transportation Expenditure Plan
The Contra Costa Transportation Authority (CCTA) is the agency responsible for planning, funding, and implementing innovative transit programs to reduce emissions and improve mobility in Contra Costa County.
Some of CCTA’s work is funded through voter‐approved sales taxes including Measure C (1988) and Measure J (2004). In 2016, the CCTA board began moving forward with placing a new 35‐year Transportation Expenditure Plan (TEP) on the ballot. The latest version will go before voters in March 2020. If the measure passes, funds from the new TEP would become available to support the express bus projects approximately 12 to 18 months after the election. The first allocation listed below has the potential to provide $90 Million specifically for the express service. The other three allocation items noted below have a potential nexus with the improvements proposed to support the identified routes.1
Improve Transit Reliability Along the I‐80 Corridor
The TEP includes a $90 million allocation specifically focused on new transit projects for congestion relief in the I‐ 80 corridor in West Contra Costa County. The expenditure plan specifically cites new express bus service, highway interchange and access improvements, and dedicated part‐time transit lanes on I‐80 as potential investments, all of which are included as elements of the implementation plan. Discussions with CCTA staff indicated that this $90 million would be considered dedicated funding towards the recommendations of this study, and that the funds could be spent on any project components that are physically located in Contra Costa County as well as vehicle purchases and operating expenses.
Relieve Congestion and Improve Local Access Along the I‐80 Corridor
The TEP includes $57 million for a variety of projects in the I‐80 corridor including several elements that are closely related to portions of the final project list in this study: improving and expanding express transit service and transforming park‐and‐rides into shared mobility hubs. Other projects in this investment category are focused on operational and technology improvements to I‐80 itself, and while these types of projects would likely benefit the express bus services, they do not have as clear a nexus to the capital projects listed in the implementation plan.
Because the project list is so varied, it is not possible for CCTA to confirm how projects in the express bus implementation plan will fare relative to other potential investments. As a conservative assumption, the financial analysis does not include any funds from this category at this time. Project sponsors should apply for funding in this category in order to supplement confirmed available sources.
Improve Traffic Flow on Major Roads in West County
The TEP includes a $38 million line item for improvements to local roads that could have a nexus with a subset of the express bus implementation plan. The expenditure plan document specifically lists traffic signal synchronization and bus transit facility enhancements as eligible expenses for this investment category, both of 1 The TEP is based on sales tax revenues, so the total amount collected by CCTA may exceed or fall short of projections, depending on the pace of local economic growth over the 35‐year life of the plan. All individual line item allocations in the expenditure plan are calculated as a relative share of the $3.6 billion total in the approved program. As funds are drawn down from a particular line item, CCTA decreases that item’s relative share of future revenues in proportion, which reduces future exposure to any excess or shortfall in tax receipts. These effects are not modeled in the financial calculations presented here; it is assumed that the express bus projects will claim and receive the full amount allocated in the TEP.
Original PDF, page 203
Financial Plan | January 2020 Transportation Analytics which are included in the project list from this study. As with the previous line item, other potential investments may take priority for use of these funds, so CCTA cannot confirm an amount that might be allocated to the express bus projects. As a conservative assumption, the financial analysis does not include any funds from this category at this time. Project sponsors should apply for funding in this category in order to supplement confirmed available sources.
Increase Bus Services and Reliability in West County
The TEP also provides significant investments targeted directly at transit service improvements, including a $250 million line item for services in West Contra Costa County. Both WestCAT and AC Transit are eligible for funding. The expenditure plan document cites the goal of using the funds to, “provide cleaner, safer, and more reliable trips on buses,” and that the funding will allow for frequency increases and fare off‐sets to increase ridership. The description of this line item is not specific enough to judge how much of this money, if any, would flow towards supporting entirely new express bus routes, so as a conservative assumption, the financial analysis does not include any funds from this category at this time. Both transit operators should maximize use of these funds to support and grow their overall route networks, including the recommended express bus routes.
Additional Capital Sources
Hercules TIF
During the development of the capital project list, it became clear that one candidate project—the SR‐4/I‐80 interchange improvements—were largely the same as an existing item in the project list for the City of Hercules Transportation Impact Fee (TIF) program. The cost for the improvements needed for the project as defined in this study is less than the estimate currently shown in the Hercules TIF list, so it was assumed that 100% of the costs for this particular capital project would be paid with City of Hercules funds in any scenario that includes that project.
Externally Funded Projects
Several of the largest improvements in the capital projects list for this study were under development well before this study began and their on‐going evaluation, design, and construction exceeds the scope of this planning effort.
It was assumed that 100% of the costs for these projects would be paid from other external funding sources, and that the final development timeline of each of these projects would support the implementation of the express bus routes. As a result, the financial model does not include capital costs or capital revenues associated with the following five “externally funded” projects:
I‐80/Ashby Avenue Interchange
I‐80/San Pablo Dam Road Interchange
Transit Signal Priority on Grand Avenue in Oakland
WestCAT Facility Upgrade
AC Transit Facility Upgrade
Other Potential Capital Funding Not Assumed
A number of the capital projects in this study align well with the eligible uses for a variety of state and federal grant programs that support transit, but the amount and timing of funding is often difficult to estimate in advance. In particular, capital grants are often awarded via competitive programs that review applications on an annual or biennial cycle, and it is virtually impossible to predict how the projects from this study would fare relative to other potential applicants for the same round of funding. Although the financial model does not portray any revenues
Original PDF, page 204
Financial Plan | January 2020 Transportation Analytics from these sources, project sponsors should diligently pursue grants from the programs below in order to help complete the capital funding portfolio:
Transit and Intercity Rail Capital Program (TIRCP) – This competitive grant program is a formally defined part of the California Greenhouse Gas Reduction Fund (GGRF) that invests the proceeds of the state’s cap‐ and‐trade auctions. The program primarily funds projects in passenger‐serving intercity rail corridors to help relieve congestion and reduce vehicle emissions. Eligible uses of funds include projects that improve connections between intercity rail and local transit, which could include express bus projects and services that facilitate connections to Capital Corridor stations, which in the vicinity of the proposed express bus routes include Richmond, Jack London Square, Emeryville, and a potential future station in Hercules.
Local Partnership Program (LPP) – This program was created as part of the Road Repair and Accountability Act of 2017 (also known as Senate Bill 1 or SB1). Through separate formulaic and competitive program components, it provides funding to local agencies, including transit operators like AC Transit and WestCAT, to support a variety of transportation improvement projects. The formula component apportions revenues to recipients based on the volume of locally‐generated funding sources (sales taxes, bridge, tolls, etc.) and population. The competitive program awards funds based on how well a candidate project meets defined goals such as improvements in air quality and reduction in vehicle miles traveled (VMT).
Solutions for Congested Corridors Program (SCCP) – This competitive grant program was also created as part of SB1. It focuses on supporting infrastructure projects that are part of comprehensive corridor programs to improve overall travel efficiency on all modes in a pre‐defined corridor. The projects typically emerge from multi‐agency planning efforts and are scored on how well they meet program goals such as improved safety and reduced congestion. The recommendations from the Plan should be incorporated into future I‐80 and I‐580 corridor analyses to qualify them for SCCP funding.
State Transportation Improvement Program (STIP) – This existing funding program was significantly augmented by SB1. Transit projects are eligible for funding, and project sponsors submit their proposed projects to the California Transportation Commission via MTC on a biennial basis. Because of competing regional priorities, it is not possible to confirm in advance which projects will receive the strongest backing in a given cycle.
Zero Emission Bus Funding – In December 2018, the California Air Resources Board (CARB) approved the Innovative Clean Transit (ICT) Regulation, which requires that all transit operators in California transition to a Zero‐Emission Bus (ZEB) fleet by the year 2040. There are a variety of funding sources that can support the cost of fleet upgrades and replacements. In addition to programs discussed elsewhere in this document, CARB has highlighted funding options such as the Carl Moyer Program, the Volkswagen Environmental Mitigation Trust, and the Legislature’s recent GGRF allocations in support of the implementation of AB617 in disadvantaged communities. CARB’s Hybrid and Zero‐Emission Truck and Bus Voucher Incentive Project (HVIP) may also be an option in future years, although it is currently over‐ subscribed. Funding from these programs could potentially be used for future bus purchases.
FTA 5339: Bus & Bus Facilities – This is one of several Federal Transit Administration grant programs that supports construction and operations of public transit around the country. Section 5339 funds are awarded through both a formula allocation and a competitive program in order to rehabilitate or acquire buses and related equipment and facilities, including upgrades to low or no‐emission buses and facilities.
The formula portion of funding includes a fixed component and a component based on population and service factors; the incremental allocation to these new routes because of the increased service would likely be very small, so it was not estimated in the financial analysis. The competitive portion is awarded based on asset age and condition and vehicle emissions profiles.
Original PDF, page 205
| West County Subregional Transportation Mitigation Program (STMP) | ‐ Contra Costa County Measure J | |
|---|---|---|
| requires that local jurisdictions develop a program of regional traffic mitigation fees, assessments, or | ||
| other mitigations, as appropriate, to fund regional and subregional transportation projects, including | ||
| projects that support transit service. WCCTAC updated the West County STMP in early 2019 and included | ||
| projects supporting express bus as identified in the High Capacity Transit Study. The STMP is therefore | ||
| currently collecting funds that could be used for express bus improvements and can be further updated in | ||
| a future update cycle to reflect the projects included in this Plan. In the 2019 update, based on a nexus | ||
| study completed by WCCTAC, the STMP was limited to collecting 19% of the total project cost of projects | ||
| included. This would result in up to $20 Million collected for express bus improvements through the | ||
| program. Money raised by the STMP is dependent on development that would incur STMP fees and | ||
| therefore the timing and amount to be collected by the STMP is not known. However, it would be a | ||
| potential local funding source for the capital projects in this Plan. |
Financial Plan | January 2020 Transportation Analytics
Additional Operating Sources
State Funding
Several existing California programs fund transit operations through allocations that are based, in part, on a transit operator’s relative share of overall fare revenues in the state. As a result, the addition of new transit service can trigger some incremental revenue allocations due to the new passengers and fares they generate. The financial analysis includes estimates of incremental revenues that could be available from the following two programs:
TDA State Transit Assistance – The 1971 Transportation Development Act (TDA) created a new revenue sources knows as State Transit Assistance (STA) by imposing sales taxes on the sale of diesel fuel and allocated the resulting funds to public transit operators throughout California. The taxes are distributed in two components: a population‐based allocation and a revenue‐based allocation. The population‐based allocation is typically distributed through a regional agency such as MTC, so claims on the funds are highly indirect; this component was not estimated within the financial analysis. The revenue‐based allocation is made directly to the transit operators. To compute the amount that could be awarded to WestCAT and AC Transit because of the newly operating routes, historical data on statewide revenue‐based allocations was used to develop a scaling factor of cents received per dollar of fare revenue in the most recent fiscal year. This was multiplied by the fare revenues anticipated to be generated by each of the new express bus routes to estimate potential future grant awards.
Low Carbon Transit Operations Program (LCTOP) – This formula grant program is a formally defined part of the Greenhouse Gas Reduction Fund (GGRF). The allocations to each transit operator are made using the same formulas as the TDA‐STA funds described above, with both population‐based and revenue‐ based components. For the purposes of the financial analysis, the population‐based component was not included, and the revenue‐based component was estimated using the same scaling factor approach as for STA.
The scaling factor approach described above assumes that the state will generate enough revenues through each funding mechanism (diesel taxes for STA and cap‐and‐trade proceeds for LCTOP) to be able to award similar total funding levels to transit operators in the future and keep pace with inflation. It also assumes that the relative growth and distribution of fare revenues generated at different transit agencies around the state does not change so significantly as to tilt the apportionments away from WestCAT or AC Transit over time. For reference, last year’s STA revenue‐based awards were about five times the size of the LCTOP revenue‐based awards. The population‐ based components of each of these two funding sources are discussed further later in this section.
Original PDF, page 206
Financial Plan | January 2020 Transportation Analytics
Federal Funding
The Federal Transit Administration provides federal funding to public transit operators throughout the country via the Section 5307 program of Urbanized Area Formula Grants. The allocation formula has different components for different sized metro areas, including components based on population and service level factors. The population‐ based components are discussed further later in this section. The service level component was included in the financial analysis using a scaling factor approach. Specifically, historical data for the most recent federal fiscal year apportionments were used to calculate the number of cents received for each revenue mile of service, and this was applied to the proposed operating plan to make a proxy estimate of the federal revenues that might flow to the Bay Area (and ultimately to WestCAT and AC Transit) because of the added service operated for each of the proposed express bus routes.
This scaling factor approach assumes that Congress will continue to appropriate comparable levels of funding to the FTA 5307 program in future years, that funding levels will keep pace with inflation, and that peer agencies around the country grow their service levels in a relatively similar distribution as the present day, so that allocations do not tilt away from WestCAT and AC Transit over time.
Other Potential Operating Funding Not Assumed
As with transit capital funding, there are a number of funding sources for transit operating needs that are challenging to estimate in the context of a planning study. Many transit funding sources make allocations on the basis of demographic and economic variables such as population or sales tax return‐to‐source, which have little relationship to the service itself. The funds are often awarded to local and regional entities who must consider how to support a variety of needs and uses across the route network or even the entire region. Although the addition of new service will not necessarily trigger an incremental funding allocation to the specific route or transit operator, the new express bus services are eligible for and should request operating support from any or all of the following sources:
TDA Local Transportation Fund – The 1971 Transportation Development Act (TDA) created a new revenue source known as the Local Transportation Fund (LTF) by imposing a quarter‐cent sales tax increase statewide and returning that money to local agencies for the specific purpose of funding transportation improvements. In urban areas, transit‐related needs often have a priority claim on these funds, but monies are not directly allocated to individual operators or routes; funding decisions are typically made at the county level, and the needs of new services will need to be balanced against other priorities.
TDA‐STA Population‐Based Funding and GGRF LCTOP Population‐Based Funding – As noted above, both the STA program and the LCTOP include population‐based allocations that are typically awarded to regional planning entities such as MTC who then develops a sub‐allocation methodology to satisfy the many competing needs of transit in the region. Although it is highly likely that additional STA and LCTOP funding will flow to WestCAT and AC Transit over time, it is premature to estimate what portion of the incremental funds would be available to support the new express bus routes.
FTA Section 5307 Urbanized Area Allocation – As noted above, the FTA awards grants to support public transit service on the basis of both population and service level factors. In particular, FTA’s Section 5307 includes components based on relative population as well as population density. These funds are typically allocated at the regional level, so MTC will determine further sub‐allocation priorities for these funds.
DEVELOPMENT OF FINANCIAL MODEL
Description of Model Inputs
Original PDF, page 207
Financial Plan | January 2020 Transportation Analytics The process used to develop the proposed express bus routes ultimately resulted in two distinct phases of implementation (“near‐term” vs. “long‐term”). Specifically, the Project Management Team collaboratively defined a network of eight bus routes (1 to 8) plus two alternative routes (2A and 2B) together with a detailed list of capital projects that would be needed to support these routes. After consultation with stakeholders and key partners, the routes were grouped into near‐term (2, 4, 6, 7) and long‐term (1, 3, 5, 8), and the capital projects were grouped by their different priority levels (“required” vs. “optimal”). These determinations were based primarily on the technical feasibility of each of the routes when considering potential passenger demand and operational constraints, and the financial analysis took these groupings as givens. The financial model was structured to be able to separately analyze multiple groupings of routes so as to evaluate which combinations of routes and projects would be financially feasible within the envelope of known funding sources.
Project List and Capital Costs
As noted above, each of the recommended capital projects was labeled as either required or optimal in order to initiate express bus service and the route(s) that would benefit were noted. Capital projects labeled as required were those deemed necessary in order for the route to function (such as buses and stops) or those deemed necessary for the route to be financially viable (such as Mobility Hubs). All other capital projects were labeled as optimal. The financial model was created so that only those capital projects specifically relevant to the particular set of routes being evaluated would be included in the calculations.
Another key factor in determining financial feasibility is project eligibility. The local funding sources described in the previous section (RM3 and the CCTA TEP) include restrictions on which types of projects will be funded and where different funding sources can be spent. In particular, funds from one of the RM3 line items and all of the TEP cannot be spent on projects located in Alameda County, and a separate RM3 line item can only be spent on designated Rapid Bus corridors. To facilitate alignment of capital funding sources and uses, the capital project list was further segmented to reflect these two distinctions.
The consultant team developed estimates of the capital costs of each project in current dollars, including sub‐ totals for Environmental Analysis & Final Design Costs, Construction Costs, and Other Support Costs. Each project was also evaluated to determine the likely timing and duration of three implementation phases: Pre‐ Environmental, Environmental Clearance and Design, and Construction/Purchase. The timing of the phases is aligned to the operational start of the routes each project supports, according to the near‐term vs. long‐term designation. Based on these inputs, the financial model aligns the costs and development timing as follows:
Environmental Analysis & Final Design Costs were distributed evenly across all years of the Environmental Clearance and Design phase.
Construction Costs were distributed evenly across all years of the Construction/Purchase phase.
Other Support Costs were distributed evenly across all years of implementation, regardless of the number of years for each phase.
Route List and Operating Cost
Two route groupings were analyzed in the financial model. The first grouping includes only the near‐term routes, and the second grouping includes near‐term routes plus the long‐term routes, with the long‐term routes deployed about four years after service begins on the near‐term routes. Regardless of whether the long‐term routes were included in the analysis, Route 2 (a near‐term route) was converted to two separate routes, known as Route 2A and Route 2B, in Year 10 of the implementation plan, which would be the eighth year of actual bus operations.
Original PDF, page 208
Financial Plan | January 2020 Transportation Analytics The financial plan incorporates inputs based on a detailed operations plan for the proposed routes, reflecting peak‐only service that targets morning and evening commuters. The routes are currently assumed to operate in revenue service in the peak‐direction only, but reverse commute service could be implemented with minimal ramifications to the analysis. Midday service could be added later as demand builds in each market, but this is not currently included in the model.
Based on these operating assumptions, the consultant team developed an operating plan for each route including calculations of vehicle hours and revenue miles, fleet requirements, and estimated annual operating costs.
Operating costs were calculated by multiplying the operating cost per total vehicle hour provided by each transit operator by the total vehicle hours scheduled for each route. More information about these calculations is available in the Proposed Service Plan.
For the purposes of the financial analysis, it was assumed that the annual operating costs would grow in line with inflation over time. This is a somewhat optimistic assumption, because cost growth from year to year can be uneven due to periodic labor negotiations and changes in route networks and support facilities. This is balanced by a conservative estimation of the marginal operating cost by each agency.
In addition to the cost of operating the actual bus routes, the new infrastructure being constructed to support the bus routes will require some periodic operation and maintenance. Through consultation with the Project Management Team, the following assumptions were developed for the financial analysis:
The cost to maintain all freeway assets would be the responsibility of Caltrans
The cost of operating and maintaining new and expanded facilities at transit centers and mobility hubs would be covered by user fees charged for parking and ancillary services. Thus, user fees were conservatively not included as potential operations funding source.
The cost to maintain new bus stops is included in the assumed hourly operating cost for each transit agency.
The cost to maintain transit signal priority equipment is borne by each jurisdiction as part of routine traffic signal maintenance.
The overhead cost for the new maintenance facilities needed to launch the new routes is included in the hourly operating cost for each transit agency.
Operating Revenues
The operation of the express bus routes will generate revenues from passenger fares that can be applied towards the cost of the new service. The consultant team developed a range estimate of annual passenger boardings and the associated fare revenues for each route, reflecting current land use and mode choice patterns, a conservative assumption given that the service area includes multiple Priority Development Areas. Additionally, the forecast assumes existing congested travel times due to the uncertainty of the timing and magnitude of benefit associated with proposed transit priority treatments. This may result in a conservative estimate of potential ridership. It also results in a conservative estimate of total operating hours (and operating costs), potentially offset by continued background growth in congestion and reduction in operating speeds.
For the purposes of the financial analysis, the low‐end of the fare revenue estimate was used as a conservative assumption. The fare revenue forecast was a single year point estimate and did not include any adjustments over time to account for the fare increase policies of the transit operators. Based on consultation with the Project Management Team, the financial model assumes that fare revenues will grow in line with inflation, anticipated to
Original PDF, page 209
Financial Plan | January 2020 Transportation Analytics result from the combined effect of periodic fare increases and modal shift resulting from the increased cost competitiveness of transit.
As noted above, the new and expanded transit centers and mobility hubs proposed in the capital project list are assumed to charge user fees in order to cover the operating and maintenance costs of the fixed facilities. This could come from daily parking charges or other revenue‐producing services, such as bike share or retail operations. It is assumed that all of these revenues would be necessary to off‐set operating and rehabilitation costs, and that no incremental user fees will be available to support vehicle operations. This is a conservative assumption given the current financial performance of the Hercules Transit Center.
Non‐Operating Funding
The final input to the financial analysis was the determination of non‐operating funding available to cover the capital and operating costs from the express bus routes. The financial model specifically calculates the amounts available based on the particular subset of routes and projects in a given scenario, based on the eligibility restrictions for each source. The list of non‐operating funding sources that were formally estimated in the calculations includes the following:
MTC Regional Measure 3
CCTA Transportation Expenditure Plan
TDA State Transit Assistance (revenue portion)
GGRF Low Carbon Transportation Operations Program (revenue portion)
FTA 5307 Urbanized Area Program (revenue miles portion)
Hercules TIF Although a number of other funding sources described in the previous section would likely be available to augment this list, they were not included in the analysis at this time, due to the difficulty in estimating the exact timing and amount of funding that could be expected to flow to the express bus routes. Using a more conservative list of available funding also helps to clarify the most feasible paths for deploying the routes over time should the funding change sometime after implementation is underway.
Key Assumptions in Financial Model
Model Timeframe
The financial model is a ten‐year composite calculation of costs and revenues, with separate calculations for capital and operating needs. Results are presented in year of expenditure dollars (YOE$), so the exact timing of when projects are developed and routes are deployed affects the calculations.
As noted in the section on available funding sources, several of the largest dedicated revenue sources intended to support the express bus routes have uncertainties related to the timing of when funds would be available. In particular, the CCTA TEP requires voter approval of a forthcoming ballot measure and Regional Measure 3 is currently being challenged in court. It is assumed that implementation of the express bus routes would not begin until at least one, and likely both, of these two sources is accessible to the project partners. As a baseline input, the financial model assumes that any available funds from these sources would be released at the beginning of FY 2021‐22. If monies are available sooner, project work could begin earlier as well, and costs would be marginally lower than shown in the current model; if funding is delayed and implementation is deferred, then costs would escalate.
Original PDF, page 210
Financial Plan | January 2020 Transportation Analytics
Inflation and Cost Growth Over Time
Converting the various cost and revenue estimates into year of expenditure dollars requires a variety of assumptions about how those figures change over time. A baseline rate of 3.5% per year was used to represent background inflation effects, based on the long‐term trend in the consumer price index (CPI). Relative to this underlying trend, the financial model makes the following assumptions:
Construction costs for all projects are assumed to grow in line with inflation. This is somewhat optimistic compared to the recent past, given the overall strength of the regional economy in the Bay Area.
However growth in the real estate sector appears to be slowing, so cost growth may also return to a more typical level within the ten‐year horizon.
Operating costs and fare revenues for all routes are assumed to grow in line with inflation, as discussed in the previous section on model inputs.
Revenues derived from on‐going state and federal grant programs are assumed to grow in line with inflation, either because these programs are explicitly tied to the economy (e.g., TDA STA is derived from sales taxes) or because elected officials tend to increase annual budgets to reflect increasing infrastructure needs (e.g., FTA 5307 is part of an annual appropriations process at the federal level).
Admittedly there can be financial downturns and political pressures that will keep revenues somewhat below the natural CPI rate, but this simplifying assumption provides an order of magnitude result appropriate for a short time‐frame analysis.
As described above in the funding section, neither the RM3 funds nor the TEP funds growth with inflation, due to the fixed nature of their voter‐approved fiscal programs.
It should be noted that this financial analysis does not include future costs associated with the renewal and replacement of major assets including transit vehicles and fixed facilities in transit centers and mobility hubs. The buses will require a mid‐life overhaul followed by a full replacement at the end of their useful life, which is typically about twenty years; the fixed facilities will need periodic upgrades and re‐builds over the course of the next several decades. Long‐term planning for sustainable operations of these express bus routes beyond the ten‐year horizon will need to consider funding needs for these lump sum capital costs.
RESULTS OF FINANCIAL MODEL
The Project Management Team requested a financial analysis of two separate funding scenarios: one in which only RM3 would be available (without the CCTA TEP) and another where both RM3 and the TEP were utilized.
RM3‐Only Scenario
A scenario that relies primarily on funding from RM3 is unlikely to be both technically and financially viable. By itself, RM3 provides only $12.5M in guaranteed funding for express bus capital projects and an estimated $5M per year in operating funding. New buses cost about $1 million each in current dollars, and each of the routes in the plan requires between 7 and 10 vehicles, which would consume most of the available capital funds even for just one route. The required capital projects would need to be less than the balance of available RM3 funding in order to be viable with RM3 alone.
The route with the smallest total funding requirements is Route 1. It requires a fleet of 7 buses and less than $1 million in capital projects to launch, and its operating costs would be less than $1 million per year in current dollars. However, this route was slated for the long‐term implementation phase for technical reasons, and may not be a fit for immediate deployment.
Original PDF, page 211
Financial Plan | January 2020 Transportation Analytics Route 2 requires 10 vehicles, but it could also be launched within the available funding capacity. However, this route relies on existing fully‐ or over‐subscribed Transit Centers in Hercules and Richmond. Additional capital funding would be desired to increase the multi‐modal accessibility of those facilities prior to introducing new service. Additionally, identified capital projects to enhance transit travel time competitiveness would be particularly valuable for the effectiveness of this route. The bus purchase and stop upgrades required for this route would consume the entirety of the available capital budget in RM3, leaving no funding for these additional needs.
Therefore, this route alone would not result in a desirable implementation scenario. Routes 3 through 8 each requires either a mobility hub or a freeway‐related project (or both) and the capital costs would exceed the available capital resources. It appears to be the case that if the CCTA TEP does not pass, additional funding would have to be secured in order to launch any express bus routes in West County within the next five years.
RM3 + TEP Scenario
The RM3 + TEP scenario is financially viable under certain conditions. The TEP provides a significant boost to the capital funding capacity, which would be sufficient to fund all of the required projects necessary to launch the near‐term routes, together with the operating costs through the first ten years of implementation. This scenario is described in more detail below, followed by a discussion of trade‐offs to consider when expanding to more projects and routes beyond this narrow set.
Near‐Term Routes + Required Projects
The committed funding available from RM3 and the TEP is sufficient to construct all of the required projects for the four near term routes (2, 4, 6, and 7) and fund their operations for the ten‐year operating plan.
The near‐term routes require $63 million (YOE$) in capital projects including:
- $19 million for buses for AC Transit
- $33 million for buses for WestCAT2
- $11 million in required capital projects3
About one fifth of the total capital cost is funded from RM3 and the balance is funded with the TEP. More specifically, the financial analysis assumes that nearly $14 million in RM3 money would be made available to the project through a combination of $12.5 million from the dedicated express bus line items plus up to $1.2 million from the Rapid Bus line item. About $49 million in capital costs would be funded from the dedicated TEP line item for the express bus services, leaving a balance $41 million in that line item for other expenditures in this particular scenario. A summary of the ten‐year capital outlook is provided in Figure 1 at the end of this memo.
The operating cost for the four near‐term routes is $5.4 million in current dollars. This figure increases to $6.4 million in current dollars when the conversion from Route 2 to Routes 2A and 2B is implemented. In Year of Expenditure dollars, the total operating expenses over the ten‐year implementation plan are just above $59 million. About $15.6 million of the total operating expense is covered by fare revenues, with majority of the 2 This total includes the cost of eight additional buses needed to convert Route 2 into Routes 2A and 2B in Year 10 of the implementation plan.
3 This total includes the Bissell Avenue Mobility Hub, the Tara Hills Drive Mobility Hub, and all required bus stops for the near‐term routes.
Original PDF, page 212
Financial Plan | January 2020 Transportation Analytics balance coming from the RM3 operating funds and a modest contribution from state and federal grant programs like TDA‐STA and FTA 5307.
It should be noted that in Year 8 of the implementation plan, the operating expenses increase to the point that the required RM3 funding contribution would hit the assumed $5 million cap. The funding plan contemplates that additional operating contributions would come from the CCTA TEP to fill the gap. A summary of the ten‐year operating outlook is provided in Figure 2 at the end of this memo.
Funding Trade‐Offs
After confirming that the near‐term routes could be launched with available funding, the financial model was used to explore additional options for utilizing balance of the dedicated TEP funds. As the number of routes and capital projects was increased, each of the deployment options typically resulted in some deficits in capital and/or operating funds.
As described above, the routes were grouped into near‐term and long‐term and the capital projects were designated as required or optimal, which naturally leads to a core trade‐off to consider. After building the required projects for the near‐term routes, WCCTAC could proceed in one of two directions as the next step:
Option 1: build the required projects to launch the long‐term routes – This approach assumes that the goal is to put as much new service on the street as quickly as possible and relies on the minimum required improvements to support the full network of routes. At full build‐out, it would require a fleet of 74 vehicles to operate Routes 1‐8 through Year 9 with the transition from Route 2 to Routes 2A and 2B in Year 10. When combined with the required projects for the near‐term routes, the total capital cost is $139 million (YOE$) with a capital funding gap of $35 million. The total operating expense is $90 million (YOE$) with an operating funding gap of $26 million. Operating deficits begin as soon as the long‐term phase routes are deployed.
Option 2: build the optimal projects to enhance near‐term routes – This approach assumes that the goal is to provide high quality service on a few routes, and it defers deployment of the long‐term phase routes until additional funding can be secured. At full build‐out, it would require a fleet of 41 vehicles to operate Routes 2, 4, 6, and 7 through Year 9 with the transition from Route 2 to Routes 2A and 2B in Year 10.
When combined with the required projects for the near‐term routes, the total capital cost is $168 million (YOE$) with a capital funding gap of $60 million. The total operating expense is $59 million (YOE$) with an operating funding gap of $3 million. Operating deficits begin in Year 8, because the additional capital projects will have consumed all of the dedicated funding in the TEP, leaving no buffer for operating expenses when the $5 million from RM3 is fully utilized.
As currently configured, the available funds are insufficient to pursue either of these options in their entirety, but the differences between them highlight a key trade‐off between the two scenarios. Specifically, launching all routes under Option 1 requires far more operating funds than have currently been secured for the Plan, but the operating funding gap is relatively small for Option 2, suggesting that securing additional one‐time capital grants and a modest stream of operating funding could be sufficient to make this option financially feasible.
Each of the two options above assumes full implementation all of the projects in the respective category. A third option to consider would be to launch the long‐term routes individually based on funding capacity:
Option 3: build the required projects to launch one long‐term route – This approach is a more modest version of service expansion than Option 1. Most of the long‐term routes have relatively modest lists of required projects, so any single route would fit within the available funding envelope. For example:
Original PDF, page 213
Financial Plan | January 2020 Transportation Analytics o Two of the long‐term routes (Routes 1 and 3) do not have any additional required infrastructure projects beyond those that would already be in place for the near‐term routes, so the only additional expenses would be the cost of new buses and annual operations; Route 1 is the least expensive of the two. At full build‐out, this option would require a fleet of 48 vehicles to operate Routes 1, 2, 4, 6, and 7 through Year 9 with the transition from Route 2 to Routes 2A and 2B in Year 10. When combined with the required projects for the near‐term routes, the total capital cost is $71 million (YOE$) and the total operating expense is $65 million (YOE$) with no funding gap for either capital or operating. The assumed $5 million in RM3 operating funding would be fully utilized during Year 7, the fifth year of bus operations; a total of $6 million in operating contributions would come from the dedicated funding in the TEP between Year 7 and Year 10.
o Another possibility would be to build the Wright Avenue Mobility Hub and launch Route 8. At full build‐out, this option would require a fleet of 49 vehicles to operate Routes 2, 4, 6, 7, and 8 through Year 9 with the transition from Route 2 to Routes 2A and 2B in Year 10. When combined with the required projects for the near‐term routes, the total capital cost is $90 million (YOE$) and the total operating expense is $68 million (YOE$) with no funding gap for either capital or operating. The assumed $5 million in RM3 operating funding would be fully utilized during Year 7, the fifth year of bus operations; a total of $11 million in operating contributions would come from the dedicated funding in the TEP between Year 7 and Year 10.
After discussion of all of the options described above, the Project Management Team supported the concept of making the near‐term routes as effective and desirable as possible as opposed to implementing as many routes as possible, an approach most aligned with Option 2. The capital and operating outlook for the full build‐out of Option 2 are portrayed in Figure 3 and Figure 4, respectively, at the end of this memo.
It should be noted that more than half of the total capital cost for Option 2 is related to just three passenger facilities: the expansions of the two transit centers at Hercules and Richmond Parkway and the second site at the Tara Hills Drive Mobility Hub. These three projects have a combined cost of almost $96 million (YOE$), which dominates the list of optimal projects for the near‐term routes. A portion of the $41 million in remaining TEP funding could be used as local match to help secure additional capital funding to complete these projects.
Alternatively, the funds could be used to advance interim improvements at these sites until a larger funding package could be developed.
Recommendations and Next Steps
Prepare to Launch Near‐Term Routes
Based on the analysis described above, the near‐term routes are feasible and should be implemented as soon as both RM3 and the TEP funds are made available. The required projects for these routes can be built immediately with available funds, and even some of the optimal projects can be pursued right away while additional funding is identified to complete the full funding package needed to construct the transit center expansions and new mobility hub facilities. If all TEP funds will be pledged towards capital costs for facilities projects, additional operating funds will be needed within the ten‐year horizon of the plan. Or, if WCCTAC prefers to use the remaining TEP funding to support operating costs, then an even higher level of capital funding would be the priority.
Based on consultation among members of the Project Management Team, it was determined that operating funds will be allocated directly to each of the transit agencies each year, similar to the mechanism currently in use for CCTA’s existing Measure J. Operators could choose to allocate additional funds from their other resources to
Original PDF, page 214
Financial Plan | January 2020 Transportation Analytics augment the express bus services beyond the service levels contemplated in this plan, but that has not been assumed here.
Pursue Additional Funding
Regardless of the particular sequence of projects that are funding from committed sources, it is clear that additional funding is necessary to realize the full‐scale implementation of all express bus routes proposed in this plan. The projects in this plan are likely to be highly competitive in future grant application cycles, and project sponsors should pursue funding from multiple additional sources including:
GGRF Transit and Intercity Rail Capital Program (TIRCP)
Local Partnership Program (LPP)
Solutions for Congested Corridors Program (SCCP)
State Transit Improvement Program (STIP)
Zero‐Emission Bus Funding
FTA Section 5339: Bus & Bus Facilities
Original PDF, page 215
| Year 1 | Year 2 | Year 3 | Year 4 | Year 5 | Year 6 | Year 7 | Year 8 | Year 9 | Year 10 | ||||||||||||||||||||||||||
|---|---|---|---|---|---|---|---|---|---|---|---|---|---|---|---|---|---|---|---|---|---|---|---|---|---|---|---|---|---|---|---|---|---|---|---|
| FY | FY | FY | FY | FY | FY | FY | FY | FY | FY | 10‐Year | |||||||||||||||||||||||||
| 2021‐22 | 2022‐23 | 2023‐24 | 2024‐25 | 2025‐26 | 2026‐27 | 2027‐28 | 2028‐29 | 2029‐30 | 2030‐31 | TOTAL | |||||||||||||||||||||||||
| CAPITAL EXPENSES | |||||||||||||||||||||||||||||||||||
| Buses for AC Transit | $9.4 | $9.8 | ‐ | ‐ | ‐ | ‐ | ‐ | ‐ | ‐ | ‐ | $19.2 | ||||||||||||||||||||||||
| Buses for WestCAT | $10.5 | $10.9 | ‐ | ‐ | ‐ | ‐ | ‐ | $5.6 | $5.8 | ‐ | $32.9 | ||||||||||||||||||||||||
| Required Improvements | $1.4 | $9.5 | ‐ | ‐ | ‐ | ‐ | ‐ | ‐ | ‐ | ‐ | $10.9 | ||||||||||||||||||||||||
| Optimal Improvements | ‐ | ‐ | ‐ | ‐ | ‐ | ‐ | ‐ | ‐ | ‐ | ‐ | ‐ | ||||||||||||||||||||||||
| TOTAL CAPITAL EXPENSES | $21.4 | $30.1 | ‐ | ‐ | ‐ | ‐ | ‐ | $5.6 | $5.8 | ‐ | $63.0 | ||||||||||||||||||||||||
| CAPITAL REVENUES | |||||||||||||||||||||||||||||||||||
| CCTA TEP | $15.0 | $22.8 | ‐ | ‐ | ‐ | ‐ | ‐ | $5.6 | $5.8 | ‐ | $49.3 | ||||||||||||||||||||||||
| RM3 | $6.4 | $7.3 | ‐ | ‐ | ‐ | ‐ | ‐ | ‐ | ‐ | ‐ | $13.7 | ||||||||||||||||||||||||
| Hercules TIF | ‐ | ‐ | ‐ | ‐ | ‐ | ‐ | ‐ | ‐ | ‐ | ‐ | ‐ | ||||||||||||||||||||||||
| TOTAL CAPITAL REVENUES | $21.4 | $30.1 | ‐ | ‐ | ‐ | ‐ | ‐ | $5.6 | $5.8 | ‐ | $63.0 | ||||||||||||||||||||||||
| Capital Funding Shortfall, if any | ‐ | ‐ | ‐ | ‐ | ‐ | ‐ | ‐ | ‐ | ‐ | ‐ | ‐ |
Financial Plan | January 2020 Transportation Analytics Figure 1 Summary of Ten‐Year Capital Outlook: RM3 + TEP Funding Scenario, Required Projects for Near‐Term Routes Year 1 Year 2 Year 3 Year 4 Year 5 Year 6 Year 7 Year 8 Year 9 Year 10 FY 2021‐22 FY 2022‐23 FY 2023‐24 FY 2024‐25 FY 2025‐26 FY 2030‐31 10‐Year TOTAL CAPITAL EXPENSES Buses for AC Transit $9.4 $9.8 ‐ ‐ ‐ ‐ ‐ ‐ ‐ ‐ $19.2 Buses for WestCAT $10.5 $10.9 ‐ ‐ ‐ ‐ ‐ $5.6 $5.8 ‐ $32.9 Required Improvements $1.4 $9.5 ‐ ‐ ‐ ‐ ‐ ‐ ‐ ‐ $10.9 Optimal Improvements ‐ ‐ ‐ ‐ ‐ ‐ ‐ ‐ ‐ ‐ ‐ TOTAL CAPITAL EXPENSES $21.4 $30.1 ‐ ‐ ‐ ‐ ‐ $5.6 $5.8 ‐ $63.0 CAPITAL REVENUES CCTA TEP $15.0 $22.8 ‐ ‐ ‐ ‐ ‐ $5.6 $5.8 ‐ $49.3 RM3 $6.4 $7.3 ‐ ‐ ‐ ‐ ‐ ‐ ‐ ‐ $13.7 Hercules TIF ‐ ‐ ‐ ‐ ‐ ‐ ‐ ‐ ‐ ‐ ‐ TOTAL CAPITAL REVENUES $21.4 $30.1 ‐ ‐ ‐ ‐ ‐ $5.6 $5.8 ‐ $63.0 Capital Funding Shortfall, if any ‐ ‐ ‐ ‐ ‐ ‐ ‐ ‐ ‐ ‐ ‐ 1.
Figures are in millions of Year of Expenditure dollars.
2 Fiscal Years run July through June
3 Does not include any projects classified as "externally funded
"
Original PDF, page 216
| Year 1 | Year 2 | Year 3 | Year 4 | Year 5 | Year 6 | Year 7 | Year 8 | Year 9 | Year 10 | ||||||||||||||||||||||||||
|---|---|---|---|---|---|---|---|---|---|---|---|---|---|---|---|---|---|---|---|---|---|---|---|---|---|---|---|---|---|---|---|---|---|---|---|
| FY | FY | FY | FY | FY | FY | FY | FY | FY | FY | 10‐Year | |||||||||||||||||||||||||
| 2021‐22 | 2022‐23 | 2023‐24 | 2024‐25 | 2025‐26 | 2026‐27 | 2027‐28 | 2028‐29 | 2029‐30 | 2030‐31 | TOTAL | |||||||||||||||||||||||||
| OPERATING EXPENSES | |||||||||||||||||||||||||||||||||||
| Routes Operated by AC Transit | ‐ | ‐ | $3.7 | $3.8 | $4.0 | $4.1 | $4.2 | $4.4 | $4.5 | $4.7 | $33.4 | ||||||||||||||||||||||||
| Routes Operated by WestCAT | ‐ | ‐ | $2.7 | $2.8 | $2.9 | $3.0 | $3.1 | $3.2 | $3.3 | $4.9 | $25.8 | ||||||||||||||||||||||||
| TOTAL OPERATING EXPENSES | ‐ | ‐ | $6.4 | $6.6 | $6.8 | $7.1 | $7.3 | $7.6 | $7.8 | $9.6 | $59.3 | ||||||||||||||||||||||||
| OPERATING REVENUES | |||||||||||||||||||||||||||||||||||
| Fares & User Fees | ‐ | ‐ | $1.8 | $1.9 | $1.9 | $2.0 | $2.1 | $2.1 | $2.2 | $1.7 | $15.6 | ||||||||||||||||||||||||
| CCTA TEP | ‐ | ‐ | ‐ | ‐ | ‐ | ‐ | ‐ | $0.0 | $0.2 | $2.6 | $2.8 | ||||||||||||||||||||||||
| RM3 Regional Express Bus | ‐ | ‐ | $4.2 | $4.4 | $4.5 | $4.7 | $4.9 | $5.0 | $5.0 | $5.0 | $37.6 | ||||||||||||||||||||||||
| TDA‐STA | ‐ | ‐ | $0.1 | $0.1 | $0.1 | $0.1 | $0.1 | $0.1 | $0.1 | $0.1 | $1.0 | ||||||||||||||||||||||||
| LCTOP | ‐ | ‐ | $0.0 | $0.0 | $0.0 | $0.0 | $0.0 | $0.0 | $0.0 | $0.0 | $0.2 | ||||||||||||||||||||||||
| FTA 5307 | ‐ | ‐ | $0.2 | $0.2 | $0.2 | $0.2 | $0.2 | $0.2 | $0.2 | $0.3 | $1.9 | ||||||||||||||||||||||||
| TOTAL OPERATING REVENUES | ‐ | ‐ | $6.4 | $6.6 | $6.8 | $7.1 | $7.3 | $7.6 | $7.8 | $9.6 | $59.3 | ||||||||||||||||||||||||
| Operating Funding Shortfall, if any | ‐ | ‐ | ‐ | ‐ | ‐ | ‐ | ‐ | ‐ | ‐ | ‐ | ‐ |
Financial Plan | January 2020 Transportation Analytics Figure 2 Summary of Ten‐Year Operating Outlook ‐‐ RM3 + TEP Funding Scenario, Required Projects for Near‐Term Routes Year 1 Year 2 Year 3 Year 4 Year 5 Year 6 Year 7 Year 8 Year 9 Year 10 FY 2021‐22 FY 2022‐23 FY 2023‐24 FY 2024‐25 FY 2030‐31 10‐Year TOTAL OPERATING EXPENSES Routes Operated by AC Transit ‐ ‐ $3.7 $3.8 $4.0 $4.1 $4.2 $4.4 $4.5 $4.7 $33.4 Routes Operated by WestCAT ‐ ‐ $2.7 $2.8 $2.9 $3.0 $3.1 $3.2 $3.3 $4.9 $25.8 TOTAL OPERATING EXPENSES ‐ ‐ $6.4 $6.6 $6.8 $7.1 $7.3 $7.6 $7.8 $9.6 $59.3 OPERATING REVENUES Fares & User Fees ‐ ‐ $1.8 $1.9 $1.9 $2.0 $2.1 $2.1 $2.2 $1.7 $15.6 CCTA TEP ‐ ‐ ‐ ‐ ‐ ‐ ‐ $0.0 $0.2 $2.6 $2.8 RM3 Regional Express Bus ‐ ‐ $4.2 $4.4 $4.5 $4.7 $4.9 $5.0 $5.0 $5.0 $37.6 TDA‐STA ‐ ‐ $0.1 $0.1 $0.1 $0.1 $0.1 $0.1 $0.1 $0.1 $1.0 LCTOP ‐ ‐ $0.0 $0.0 $0.0 $0.0 $0.0 $0.0 $0.0 $0.0 $0.2 FTA 5307 ‐ ‐ $0.2 $0.2 $0.2 $0.2 $0.2 $0.2 $0.2 $0.3 $1.9 TOTAL OPERATING REVENUES ‐ ‐ $6.4 $6.6 $6.8 $7.1 $7.3 $7.6 $7.8 $9.6 $59.3 Operating Funding Shortfall, if any ‐ ‐ ‐ ‐ ‐ ‐ ‐ ‐ ‐ ‐ ‐ 1.
Figures are in millions of Year of Expenditure dollars.
2 Fiscal Years run July through June
Original PDF, page 217
| Year 1 | Year 2 | Year 3 | Year 4 | Year 5 | Year 6 | Year 7 | Year 8 | Year 9 | Year 10 | ||||||||||||||||||||||||||
|---|---|---|---|---|---|---|---|---|---|---|---|---|---|---|---|---|---|---|---|---|---|---|---|---|---|---|---|---|---|---|---|---|---|---|---|
| FY | FY | FY | FY | FY | FY | FY | FY | FY | FY | 10‐Year | |||||||||||||||||||||||||
| 2021‐22 | 2022‐23 | 2023‐24 | 2024‐25 | 2025‐26 | 2026‐27 | 2027‐28 | 2028‐29 | 2029‐30 | 2030‐31 | TOTAL | |||||||||||||||||||||||||
| CAPITAL EXPENSES | |||||||||||||||||||||||||||||||||||
| Buses for AC Transit | $9.4 | $9.8 | ‐ | ‐ | ‐ | ‐ | ‐ | ‐ | ‐ | ‐ | $19.2 | ||||||||||||||||||||||||
| Buses for WestCAT | $10.5 | $10.9 | ‐ | ‐ | ‐ | ‐ | ‐ | $5.6 | $5.8 | ‐ | $32.9 | ||||||||||||||||||||||||
| Required Improvements | $1.4 | $9.5 | ‐ | ‐ | ‐ | ‐ | ‐ | ‐ | ‐ | ‐ | $10.9 | ||||||||||||||||||||||||
| Optimal Improvements | $1.6 | $9.4 | $20.0 | $49.8 | $24.2 | ‐ | ‐ | ‐ | ‐ | ‐ | $104.9 | ||||||||||||||||||||||||
| TOTAL CAPITAL EXPENSES | $22.9 | $39.5 | $20.0 | $49.8 | $24.2 | ‐ | ‐ | $5.6 | $5.8 | ‐ | $167.9 | ||||||||||||||||||||||||
| CAPITAL REVENUES | |||||||||||||||||||||||||||||||||||
| CCTA TEP | $16.3 | $32.1 | $20.0 | $21.6 | ‐ | ‐ | ‐ | ‐ | ‐ | ‐ | $90.0 | ||||||||||||||||||||||||
| RM3 | $6.6 | $7.6 | ‐ | ‐ | ‐ | ‐ | ‐ | ‐ | ‐ | ‐ | $14.2 | ||||||||||||||||||||||||
| Hercules TIF | $0.1 | $0.4 | $0.4 | $3.5 | ‐ | ‐ | ‐ | ‐ | ‐ | ‐ | $4.4 | ||||||||||||||||||||||||
| TOTAL CAPITAL REVENUES | $23.0 | $40.1 | $20.4 | $25.0 | ‐ | ‐ | ‐ | ‐ | ‐ | ‐ | $108.6 | ||||||||||||||||||||||||
| Capital Funding Shortfall, if any | $0.1 | $0.6 | $0.4 | $(24.7) | $(24.2) | ‐ | ‐ | $(5.6) | $(5.8) | ‐ | $(59.3) |
Financial Plan | January 2020 Transportation Analytics Figure 3 Summary of Ten‐Year Capital Outlook: RM3 + TEP Funding Scenario, Required+Optimal Projects for Near‐Term Routes Year 1 Year 2 Year 3 Year 4 Year 5 Year 6 Year 7 Year 8 Year 9 Year 10 FY 2021‐22 FY 2022‐23 FY 2023‐24 FY 2024‐25 FY 2025‐26 FY 2030‐31 10‐Year TOTAL CAPITAL EXPENSES Buses for AC Transit $9.4 $9.8 ‐ ‐ ‐ ‐ ‐ ‐ ‐ ‐ $19.2 Buses for WestCAT $10.5 $10.9 ‐ ‐ ‐ ‐ ‐ $5.6 $5.8 ‐ $32.9 Required Improvements $1.4 $9.5 ‐ ‐ ‐ ‐ ‐ ‐ ‐ ‐ $10.9 Optimal Improvements $1.6 $9.4 $20.0 $49.8 $24.2 ‐ ‐ ‐ ‐ ‐ $104.9 TOTAL CAPITAL EXPENSES $22.9 $39.5 $20.0 $49.8 $24.2 ‐ ‐ $5.6 $5.8 ‐ $167.9 CAPITAL REVENUES CCTA TEP $16.3 $32.1 $20.0 $21.6 ‐ ‐ ‐ ‐ ‐ ‐ $90.0 RM3 $6.6 $7.6 ‐ ‐ ‐ ‐ ‐ ‐ ‐ ‐ $14.2 Hercules TIF $0.1 $0.4 $0.4 $3.5 ‐ ‐ ‐ ‐ ‐ ‐ $4.4 TOTAL CAPITAL REVENUES $23.0 $40.1 $20.4 $25.0 ‐ ‐ ‐ ‐ ‐ ‐ $108.6 Capital Funding Shortfall, if any $0.1 $0.6 $0.4 $(24.7) $(24.2) ‐ ‐ $(5.6) $(5.8) ‐ $(59.3) 1.
Figures are in millions of Year of Expenditure dollars.
2 Fiscal Years run July through June
3 Does not include any projects classified as "externally funded
"
Original PDF, page 218
| Year 1 | Year 2 | Year 3 | Year 4 | Year 5 | Year 6 | Year 7 | Year 8 | Year 9 | Year 10 | ||||||||||||||||||||||||||
|---|---|---|---|---|---|---|---|---|---|---|---|---|---|---|---|---|---|---|---|---|---|---|---|---|---|---|---|---|---|---|---|---|---|---|---|
| FY | FY | FY | FY | FY | FY | FY | FY | FY | FY | 10‐Year | |||||||||||||||||||||||||
| 2021‐22 | 2022‐23 | 2023‐24 | 2024‐25 | 2025‐26 | 2026‐27 | 2027‐28 | 2028‐29 | 2029‐30 | 2030‐31 | TOTAL | |||||||||||||||||||||||||
| OPERATING EXPENSES | |||||||||||||||||||||||||||||||||||
| Routes Operated by AC Transit | ‐ | ‐ | $3.7 | $3.8 | $4.0 | $4.1 | $4.2 | $4.4 | $4.5 | $4.7 | $33.4 | ||||||||||||||||||||||||
| Routes Operated by WestCAT | ‐ | ‐ | $2.7 | $2.8 | $2.9 | $3.0 | $3.1 | $3.2 | $3.3 | $4.9 | $25.8 | ||||||||||||||||||||||||
| TOTAL OPERATING EXPENSES | ‐ | ‐ | $6.4 | $6.6 | $6.8 | $7.1 | $7.3 | $7.6 | $7.8 | $9.6 | $59.3 | ||||||||||||||||||||||||
| OPERATING REVENUES | |||||||||||||||||||||||||||||||||||
| Fares & User Fees | ‐ | ‐ | $1.8 | $1.9 | $1.9 | $2.0 | $2.1 | $2.1 | $2.2 | $1.7 | $15.6 | ||||||||||||||||||||||||
| CCTA TEP | ‐ | ‐ | ‐ | ‐ | ‐ | ‐ | ‐ | ‐ | ‐ | ‐ | ‐ | ||||||||||||||||||||||||
| RM3 Regional Express Bus | ‐ | ‐ | $4.2 | $4.4 | $4.5 | $4.7 | $4.9 | $5.0 | $5.0 | $5.0 | $37.6 | ||||||||||||||||||||||||
| TDA‐STA | ‐ | ‐ | $0.1 | $0.1 | $0.1 | $0.1 | $0.1 | $0.1 | $0.1 | $0.1 | $1.0 | ||||||||||||||||||||||||
| LCTOP | ‐ | ‐ | $0.0 | $0.0 | $0.0 | $0.0 | $0.0 | $0.0 | $0.0 | $0.0 | $0.2 | ||||||||||||||||||||||||
| FTA 5307 | ‐ | ‐ | $0.2 | $0.2 | $0.2 | $0.2 | $0.2 | $0.2 | $0.2 | $0.3 | $1.9 | ||||||||||||||||||||||||
| TOTAL OPERATING REVENUES | ‐ | ‐ | $6.4 | $6.6 | $6.8 | $7.1 | $7.3 | $7.5 | $7.6 | $7.1 | $56.4 | ||||||||||||||||||||||||
| Operating Funding Shortfall, if any | ‐ | ‐ | ‐ | ‐ | ‐ | ‐ | ‐ | $(0.0) | $(0.2) | $(2.6) | $(2.8) |
Financial Plan | January 2020 Transportation Analytics Figure 4 Summary of Ten‐Year Operating Outlook ‐‐ RM3 + TEP Funding Scenario, Required+Optimal Projects for Near‐Term Routes Year 1 Year 2 Year 3 Year 4 Year 5 Year 6 Year 7 Year 8 Year 9 Year 10 FY 2021‐22 FY 2022‐23 FY 2023‐24 FY 2024‐25 FY 2030‐31 10‐Year TOTAL OPERATING EXPENSES Routes Operated by AC Transit ‐ ‐ $3.7 $3.8 $4.0 $4.1 $4.2 $4.4 $4.5 $4.7 $33.4 Routes Operated by WestCAT ‐ ‐ $2.7 $2.8 $2.9 $3.0 $3.1 $3.2 $3.3 $4.9 $25.8 TOTAL OPERATING EXPENSES ‐ ‐ $6.4 $6.6 $6.8 $7.1 $7.3 $7.6 $7.8 $9.6 $59.3 OPERATING REVENUES Fares & User Fees ‐ ‐ $1.8 $1.9 $1.9 $2.0 $2.1 $2.1 $2.2 $1.7 $15.6 CCTA TEP ‐ ‐ ‐ ‐ ‐ ‐ ‐ ‐ ‐ ‐ ‐ RM3 Regional Express Bus ‐ ‐ $4.2 $4.4 $4.5 $4.7 $4.9 $5.0 $5.0 $5.0 $37.6 TDA‐STA ‐ ‐ $0.1 $0.1 $0.1 $0.1 $0.1 $0.1 $0.1 $0.1 $1.0 LCTOP ‐ ‐ $0.0 $0.0 $0.0 $0.0 $0.0 $0.0 $0.0 $0.0 $0.2 FTA 5307 ‐ ‐ $0.2 $0.2 $0.2 $0.2 $0.2 $0.2 $0.2 $0.3 $1.9 TOTAL OPERATING REVENUES ‐ ‐ $6.4 $6.6 $6.8 $7.1 $7.3 $7.5 $7.6 $7.1 $56.4 Operating Funding Shortfall, if any ‐ ‐ ‐ ‐ ‐ ‐ ‐ $(0.0) $(0.2) $(2.6) $(2.8) 1.
Figures are in millions of Year of Expenditure dollars.
2 Fiscal Years run July through June
In the same set
The original file
Everything above is the content of the original document, published here as a web page so it can be read, searched, translated and used with a screen reader. The original PDF is kept as the authoritative record.