

West Contra Costa Transportation Commission
County Connection Express Bus Study — final report
The county-wide express bus work that the West County study builds on.
Study · Final · 2017 · 23 figures · about 83 min to read
The county-wide express bus work that the West County study builds on.
Current — In force. This is the version to rely on. The adopted final version.
Contra Costa Transportation
Authority
2016 Express Bus Study Update
Final | June 1, 2017 This report takes into account the particular instructions and requirements of our client. It is not intended for and should not be relied upon by any third party and no responsibility is undertaken to any third party.
Job number 239967-00 Arup North America Ltd 560 Mission Street Suite 700 San Francisco 94105 United States of America www.arup.com
Original PDF, page 2
Contra Costa Transportation Authority 2016 Express Bus Study Update Executive Summary Introduction 1.1 Study Vision and Express Bus Definition 1.2 Review of Previous Studies 1.2.1 Contra Costa Express Bus Study (2001) 1.2.2 I-680 Investment Options Analysis (2003) 1.2.3 System Plan for California’s Bay Area Regional Express Bus Service (2006) 1.2.4 I-80 Integrated Corridor Mobility: Corridor System Management Plan (2010) 1.3 Studies and Projects Recently Completed or Currently Underway Corridor Summary – Today and in the Future 2.1 Corridor Overview 2.1.1 Far East Corridor 2.1.2 Highway 4 Corridor 2.1.3 I-80 Corridor 2.1.4 I-680 Corridor Current Express Bus Services 3.1 Express Bus Operators 3.1.1 Contra Costa County Express Bus Operators 3.1.2 Operators with Routes into Contra Costa County 3.2 Express Bus Routes by Corridor 3.2.1 I-680 Express Bus Route 3.2.2 East to Central (SR 4) Express Bus Routes 3.3 Express Bus Service Performance 3.4 Private Services 3.4.1 Semi Private/Private Shuttle Programs 3.4.2 Vanpool Services 3.5 Express Bus Infrastructure 3.5.1 Passenger Facilities 3.5.2 Freeway Facilities 3.5.3 Express Bus Fleet 3.6 Current Funding
Original PDF, page 3
Contra Costa Transportation Authority 2016 Express Bus Study Update Future Conditions and Transit Market 4.1 Transit Competitiveness Tool (TCI) 4.1.1 TCI Results and Service Implications 4.2 Planned Infrastructure Improvements 4.2.1 Passenger Facilities 4.2.2 Freeway Improvements 4.2.3 Regional Express Lanes 4.3 Fleet Replacement Schedule Emerging Trends in Bus Transit 5.1 Branding 5.2 Recent Technological Developments 5.2.1 Real-time Information 5.2.2 Tech-enabled Transit Surveys 5.2.3 Real-time Information: Among Operators 5.3 Ongoing and Future Innovation 5.3.1 Alternative Fuel and Electric Buses 5.3.2 Autonomous Vehicle Technologies Express Bus Recommendations 6.1 Service Scenarios 6.1.1 I-80/Highway 4 Service Plan 6.1.2 I-680/Highway 4:
6.2 Express Bus Infrastructure 6
2.1 I-80/Highway 4:
6.2.2 I-680/Highway 4 6
2.3 Highway 4 Cost Estimates 7.1 Vehicles 7.2 Cost and Benefits 7.2.1 I-80/Highway 4 Service 7.2.2 I-680 Service 7.2.3 Infrastructure Costs Implementation 8.1 Proposed Performance Benchmarks Summary
Original PDF, page 4
Contra Costa Transportation Authority 2016 Express Bus Study Update Tables Table 1: Sample Route Consideration – Hercules to Emeryville Table 2: Sample Trip – Concord – Walnut Creek to San Ramon – Bishop Ranch Table 3: L I-80 Express Routes Table 4: I-680 Express Routes Table 5: Highway 4 Express Routes Table 6: I-80 Corridor Route Service Performance (Weekday, Annualized) Table 7: I-680 Corridor Route Service Performance (Weekday, Annualized) Table 8: SR 4 East Corridor Route Service Performance (Weekday, Annualized) Table 9: Noted Shuttle Operators Utilizing Contra Costa BART Stations Table 10: Transit Centers with Existing Express Bus Service Table 11: Park-and-ride Lots Table 12: Existing Express Bus Only Fleet Table 13: Annual Vehicle Revenue Hours by Operator, in Thousands Table 14: TCI Score by Corridors – 2040 Forecast Year Table 15: Express Bus Only Replacement Schedule Table 16: Route Descriptions Table 17: I-80/Highway 4 Proposed Service Pattern Table 18 : Proposed Service Pattern Table 19: Route Descriptions Table 20: Estimated Increase in Service Hours and Vehicle Needs – I-80/Highway Table 21: Estimated Increase in Service Hours and Vehicle Needs – I-680 Table 22: Summary of total Infrastructure Costs Table 23: Express Bus Recommendations by Phase Table 24: Proposed Performance Benchmarks Figures Figure 1: Existing Express Bus Routes in Contra Costa County Figure 2: Existing Express Bus Routes and Major Stops Along the I-80 Corridor Figure 3: Existing Express Bus Routes along I-680 Corridor Figure 4: Existing Express Bus Routes along SR 4 Corridor Figure 5: Images of Transit Centers Figure 6: Existing Park-and-Ride Lots and Transit Center Facilities in Contra Costa County Figure 7: Existing HOV Lanes within Contra Costa County Figure 8: Images of Transit Vehicles Figure 9: Zone Groups Analyzed in TCI Analysis Figure 10: Corridors by TCI Score
Original PDF, page 5
Contra Costa Transportation Authority 2016 Express Bus Study Update Figure 11: Highway 4 Corridor Improvements Figure 12: Express Lane Projects in Contra Costa County Figure 13: Proposed Route E Figure 14: Proposed Route B Figure 15: I-80 Routing Concept Figure 16: I-680 Corridor Proposed Routings Figure 17: Twin Cities Bus-on-Shoulder Figure 18: Hercules Transit Center
Original PDF, page 6
Contra Costa Transportation Authority 2016 Express Bus Study Update
Executive Summary
Overview and History
In 2001, the Contra Costa Transportation Authority, working with the county’s transit operators, adopted the Contra Costa Express Bus Study. At that time, 18 express bus routes were operated by nine operators.
The policies and projects that were recommended eventually lead to today’s Contra Costa Express Bus services:
- 27 routes
- 10 service providers
- 9,500 weekday passengers
This Express Bus Study Update acknowledges the consistent and incremental successes over the last 16 years and identifies improvements to further strengthen the mode and reorient it as both markets and infrastructure changes.
Vision
The Update was a collaborative effort with all the county’s express bus operators, including:
- AC Transit
- WestCat
- Contra Costa County Transit Authority (County Connection)
- Tri-Delta Transit
Working with CCTA, the Authority and the operators endorsed a vision for Contra Costa Express Bus services to: “Expand and integrate the existing express bus system, creating a financially sustainable, coordinated regional bus network that transports people from Contra Costa residential areas or regional transit to activity centers on a high-quality rapid bus system with competitive travel times and minimal transfers.” The study update defines express bus service as “any limited stop bus service that moves people quickly between Bay Area cities and communities.” The Update focused on three corridors:
- I-80: from the Carquinez Strait to the northern Alameda County line (extended to include Martinez and Pacheco).
Original PDF, page 7
Contra Costa Transportation Authority 2016 Express Bus Study Update
- I-680: from the Carquinez Strait to the northern Alameda County line.
- Highway 4 Corridor (East to Central Corridor): defined as the east-west travel corridor from East Contra Costa County communities into Central Contra
Costa County, consisting of Kirker Pass and SR 4.
Changes Since 2001
The most pronounced planned and delivered infrastructure changes over the last 16 years include:
- eBART in East County, connecting the Pittsburg/Bayview Station with
Antioch
- Additional HOV Lanes on I-80 and I-680
- Additional park and ride facilities and locations
- Integrated Corridor Management on I-80 and adjacent arterials.
In addition, the Bay Area economy has boomed over the last five years, resulting in:
- High employment growth throughout the region
- Significant peak period BART crowding
- Significant highway congestion
- Increased demand for express bus services
Parallel Studies
During the Express Bus Study Update process, CCTA and the West Contra Costa Transportation Advisory Committee (WCCTAC) both engaged in multimodal corridor studies, with options that included (and coordinated with the Update) express bus services:
- CCTA’s “I-680 Transit Investment/Congestion Relief Options Study,” investigated transit options between Walnut Creek and Dublin, and recommended bus on shoulder operations along with more park-and-ride lots for greater access to transit services.
- WCCTAC’s “West Contra Costa High Capacity Transit Study” is developing transit recommendations to improve mobility in the West County/I-80
Corridor. The study is expected to be complete in 2017.
Original PDF, page 8
Contra Costa Transportation Authority 2016 Express Bus Study Update
Corridor Overviews – Existing Services
I-80 Corridor This corridor is the regional powerhouse of the Contra Costa corridors, with about 125,000 vehicle trips crossing at the Carquinez Bridge and another 180,000 at the Alameda County line. In Contra Costa, I-80 serves more than 200,000 trips at San Pablo Dam Road, with more than 14,000 vehicle trips in the peak hour.
About 80,000 daily I-80 vehicle trips are generated within Contra Costa County. The I-80 Corridor is a strong transit market, both for BART and for buses. As in other Contra Costa corridors, BART’s alignment diverges from the freeway alignment, suggesting that buses – using the freeway – could provide access into BART at this point of divergence. The divergence along I-80 Corridor is especially pronounced. BART diverges from the I-80 Corridor at El Cerrito del Norte. From this point northward, I-80 provides the only regional infrastructure for an eight mile urbanized area from El Cerrito to Hercules. This area – all of which is outside the BART corridor – has a population of more than 125,000.
Beyond Hercules, the corridor continues for another four miles and serves Rodeo and Crockett, with a combined population of about 12,000. At this point, the freeway enters Solano County via the Carquinez Bridge.
A total of 12 express bus routes serve this corridor, operated by six agencies. Average weekday ridership is about 6,700 passengers. Challenges – The corridor, while centered on the freeway infrastructure and heavily dependent on the roadway for regional access, also experiences severe congestion and unreliable bus operations. While much of the corridor has HOV lanes, these facilities also experience unreliable operation; in addition, the physical design of the HOV lanes inhibits transit trips between suburban locations in favor of long freeway trips to downtown Oakland or San Francisco.
I-680 Corridor I-680 carries a large amount of traffic generated within the county. About 100,000 vehicles enter at the Benicia Bridge, but by Pleasant Hill more than 275,000 daily vehicle trips are occurring – almost three times the volume over the bridge. At Dublin, about 175,000 daily vehicle trips occur. In the peak hour, the highest volume occurs in Pleasant Hill, with about 20,000 vehicles.
While there is significant I-680 traffic, transit volumes are small – only about 2,400 daily trips express bus passenger trips. Much of the service is oriented to Bishop Ranch, along with downtown Walnut Creek. Service is focused on these markets, but due to dispersed land uses, routes rely on park-and-ride lots for access and trips are long and often circuitous.
Similar to the I-80 Corridor, I-680 diverges from BART north of the Pleasant Hill BART station and serves a different catchment. Within this area north and west
Original PDF, page 9
Contra Costa Transportation Authority 2016 Express Bus Study Update of BART almost 100,000 people reside. South of Walnut Creek (cities of Danville and San Ramon) about 125,000 people live distant from a BART connection Challenges – Similar to I-80, the I-680 corridor experiences severe congestion and unreliable bus operations. While much of the corridor has HOV lanes, these facilities do not provide direct access into Bishop Ranch, the primary jobs location along the mid-corridor, creating inefficient service. In addition, much of the land use is dispersed creating challenges for transit effectiveness.
Highway 4 Corridor Highway 4’s Martinez – Antioch segment is a heavily congested. Caltrans and CCTA are completing a Highway 4 improvement project between Pittsburg and Antioch. This highway segment serves about 150,000 daily vehicle trips; in addition, bus feeder transit carries more than 8,000 daily trips. The Pittsburg/Bay Point BART station has about 14,000 daily passengers (almost 7,000 boardings).
One Tri Delta Express bus and two hybrid express bus routes provides service in this corridor and feeds the Pittsburg/Bay Point BART station, along with four local bus routes. CCCTA 93X connects to Walnut Creek via Kirker Pass Road.
Tri Delta Route 201 and CCCTA 93X connect the Highway 4 and I-680 Corridors
- with about 200 daily passenger trips daily on both the Tri Delta route and the
CCCTA 93X – transit competitiveness in these markets is very poor. The Hercules – Martinez segment is much less traveled, reflecting the more rural land uses along this segment of the corridor. WestCAT operates the 30Z, which links Hercules and Martinez, and like the Tri Delta Route 200 and CCCTA 93X as currently structured, is not transit competitive, although segments of the routings do suggest that with proper service design, transit can provide marketable service.
Challenges – The current large bus feeder market into the Pittsburg/Baypoint BART station will be discontinued when BART begins operation of the eBART service. As a result, the corridor express bus focus will change to connecting the ends of the corridor (beyond eBART) and links to the I-80 and I-680 corridor.
Express Bus Service Recommendations
I-80 Corridor/Highway 4 Corridor Market – A Transit Competitiveness Index process was used to assess the potential transit market in the I-80 Corridor, with a score of 100 indicating transit is a competitive option. For the 2040 year, a combined Corridor index (assuming parking charges) was 221, with very high scores to downtown San Francisco and Oakland, and potential competitive scores to Emeryville and West Berkeley.
Service Plan – In this corridor, the Update recommends a blended service between operators in order to provide additional service in the I-80 and SR 4 corridors (Concord –Martinez—Hercules—Richmond Parkway—San Francisco service).
Original PDF, page 10
Contra Costa Transportation Authority 2016 Express Bus Study Update The end result is increased but coordinated service on six routes, linking from Vallejo and Martinez to San Francisco with some services terminating at BART’s El Cerrito delNorte station. At Richmond Parkway, in the peak hour/peak direction, about 40 buses will provide service.
Capital Projects – The Update recommends the construction of a full HOV median ramp at Richmond Parkway to allow buses from the north (i.e., Westcat and SolTrans) to stop within the freeway right of way, enabling additional service to this node. In effect, Richmond Parkway service levels double or triple (and service is provided throughout the day, not just in the peak. Other projects add bus stops on exit ramps, with access to surface street park-and-ride locations.
In the longer term, either ramp or in-line stops could include:
- •
Hercules (existing)
- •
Pinole Valley Road or Appian Way (long term)
- •
Central Avenue (conceptual long term)
- •
MacDonald Ave/I-80 (consistent and collaborative with BART Vision in- fill station) I-680 Corridor Market – A Transit Competitiveness Index process was used to assess the potential transit market in the I-680 Corridor, with a score of 100 indicating transit is a competitive option. For the 2040 year, a combined Corridor index (assuming parking charges) was 155, with slightly higher scores in submarkets (i.e., Dublin and Concord).
The market between East County and Central County was identified, but was very weak. Conversely, the market into downtown Oakland and San Francisco was strong.
Service Plan – The I-680 corridor service plan simplifies the bus system, increases access points and increase service frequencies. This proposal creates a two branch option from the north, both of which feed into I-680 at Walnut Creek, and then continue on a common routing via I-680 to the Dublin/Pleasanton BART station. Each branch operates every 12 minutes in the peak, providing a common 6 minute service frequency from Walnut Creek south.
On I-680, buses operate in the shoulder during congested times, and make ramp stops at the following locations:
- Wayne/Buskirk/Treat
- Stone Valley Road
- El Cerro
Original PDF, page 11
Contra Costa Transportation Authority 2016 Express Bus Study Update
- Sycamore Valley Road
- Bishop Ranch/Bollinger Canyon
This plan recommends that the I-680 trunk service directly provide access to the new City Center complex at Bishop Ranch (Bollinger Canyon Drive) where a community circulator would provide first/last mile circulation to the balance of the Bishop Ranch campus. As part of this simplified design, Wheels Route 70 would be merged with the new I-680 service to provide a more legible and also more efficient service.
Capital Projects – The Update recommends the county and region continue to work with the state and relevant state agencies or allow for, at minimum, testing of bus on shoulder operations. A desk survey of the shoulder width through the I- 680 corridor suggests that there is currently sufficient right of way to accommodate buses operating in the shoulder.
The Update also endorses I-680 Transit Investment Congestion Relief Options Study recommendations for additional park-and-rides, with specific locations to be determined. Building on these recommendations, the Update calls for a number of new bus stop on ramp locations, including:
- Pacheco Transit Center (served by SolTrans)
- Willow Pass/Sunvalley
- Wayne/Buskirk/Treat
- Stone Valley Road
- El Cerro
- Sycamore Valley Road
- Bollinger Canyon (bus access into Bishop Ranch/San Ramon City Center)
Future park-and-ride facilities at Stone Valley are proposed, but not required for early implementation. Implementing direct pedestrian access from the stop locations, to the street and adjacent business districts are an early action item.
Other Supportive Programs Vehicles – The Update estimates that to fully implement the service plan will require an additional 40 buses. High Capacity Double Deck vehicles are suggested; in addition, as alternative fuels and even full electrification of the fleet continues to evolve, consideration is given to fleet propulsion changes.
Technology – The Update includes consideration of various technology upgrades, mainly focused on passenger information and positive marketing. These include real-time information, passenger feedback and related programs.
Original PDF, page 12
Contra Costa Transportation Authority 2016 Express Bus Study Update Autonomous Vehicles – The Update acknowledges the rapid advancement of self- driving technologies, which could have impacts on both feeder bus system as well as implications for transportation system operations and capacity.
Branding and Marketing – Most BRT system strive to create a unique brand that is identifiable and visible to potential passengers, just as the BART “brand” means something in the Bay Area. The Update encourages this marketing practice.
Estimated Operating and Capital Cost Total additional net operating costs are estimated at about $10 million annually for both the I-80 and I-680 corridors. This assumes a fairly high farebox recovery of about 40% to 65%, depending on the corridor.
Total additional costs for the 40 additional double deck buses is about $35 - $40 million (with a life of about 12 years, or about $3 million annually, not including debt service).
Other additional capital expenses – including stops, stations, access ramps, and park and ride facilities – total between $125 and $200 million. Additional costs could be incorporated with coordinated projects with other agencies (for example, BART stations, express bus lanes, etc.).
Original PDF, page 13
Contra Costa Transportation Authority 2016 Express Bus Study Update
Introduction
For many years, Contra Costa County bus operators have been providing express bus services in different forms. These services evolved, responding to infrastructure changes – primarily freeway improvements – and to changes in travel markets and funding availability. Today, express buses are an integral part of people’s commute options and important to maintaining and increasing mobility throughout Contra Costa County and the region.
Plan Bay Area 2040, the region’s land use and transportation plan, forecast 38% growth in employment and a 27% growth in households in Contra Costa County between 2010 and 20401. In most corridors, the last five years have seen significant growth, sometimes totaling more than 20%. Households are traveling more on roadways, whether by car or by transit, headed to employment destinations in and out of Contra Costa County. In the peak hour to downtown San Francisco, travel (all modes) increased about 23% between 2010 and 2015.2 In addition to the expected growth in these locations, BART has been experiencing record ridership levels. Demand along every corridor, especially I- 80, has never been higher, and there is potential for express bus service to offer additional capacity, especially as a companion to BART service.
1.1 Study Vision and Express Bus Definition
The 2016 Express Bus Study Update builds off of the 2001 Contra Costa Express Bus Study, whose goal was to implement the operators’ vision of “an express bus service network that will transport commuters from residential areas of Contra Costa to employment centers on a high-quality rapid bus system, providing a fast commute with minimal transfers at a reasonable cost.” The 2001 study analyzed four primary corridors:
- Interstate 80 (I-80) Corridor – from the western end of the Carquinez Straits to the northern Alameda County line along I-80
- Interstate 680 (I-680) Corridor – from the eastern end of the Carquinez Straits to the eastern Alameda County Line along I-680
- East to Central (State Route 4 East) – State Route 4 (SR 4) from East Contra
Costa County to Central Contra Costa County
- Far East Corridor – the north-south corridor from East Contra Costa County to the East Alameda County area
1 MTC/ABAG
Plan Bay Area 2040 Final Preferred Scenario and Investment Strategy; Memorandum October 28, 2016.
2 MTC Core Capacity Transit Study, Revised Transbay Corridor
Current Demand, Current and Planned Transit Capacity, 23 May 2016, http://mtc.ca.gov/sites/default/files/CCTS_TransbayCapacityandDemandSummary_FINAL.pdf .
Original PDF, page 14
Contra Costa Transportation Authority 2016 Express Bus Study Update A total of 18 express bus routes operated in these corridors by a total of 9 operators3. In the I-80 Corridor, WestCAT, AC Transit, and Vallejo Transit operated a total of nine express routes. In the I-680 Corridor, County Connection, Wheels, Benicia Transit and FAST operated a total of six express routes summarized. In the SR 4 Corridor, Tri Delta operated a BART express connection and a subscription bus service operated from Antioch to Livermore.
The vision of the 2016 Express Bus Study Update is: “expand and integrate the existing express bus system, creating a financially sustainable, coordinated regional bus network that transports people from Contra Costa residential areas or regional transit to activity centers on a high-quality rapid bus system with competitive travel times and minimal transfers.” The study update defines express bus service as “any limited stop bus service that moves people quickly between Bay Area cities and communities4”. This definition is borrowed from the System Plan for California’s Bay Area Regional Express Bus Service (2006).
1.2 Review of Previous Studies
This section provides a brief overview of previous relevant studies. More detail about these studies and their findings is provided in the Appendices.
1.2.1 Contra Costa Express Bus Study (2001)
The 2001 Contra Costa Express Bus Study documented a need and established a vision for express bus service in Contra Costa County. While BART facilitates long distance travel along two major corridors in Contra Costa County (I-80 and SR 24/I-680) through its rail service, greater express bus service (beyond the existing feeder services to BART) was proposed to address the growing congestion in key corridors throughout Contra Costa County. The study recognized and proposed a plan to overcome the significant service gaps in existing transit coverage and the lack of interconnected, frequent transit service that could serve as a competitive alternative to driving for commuters in Contra Costa County. Four corridors were identified as the most critical for transit improvements:
- I-80: from the Carquinez Strait to the northern Alameda County line.
- I-680: from the Carquinez Strait to the northern Alameda County line.
3 Prior to 2001, there were nine operators that provided express bus service to or from Contra Costa County. Today, ten operators provide express bus service in Contra Costa County, however, two operators have merged (Vallejo Transit and Benicia Breeze) and Rio Vista Delta Breeze has added service to Contra Costa County.
4 Elizabeth Deakin, System Plan for California's Bay Area Regional Express Bus Service
Original PDF, page 15
Contra Costa Transportation Authority 2016 Express Bus Study Update
- East to Central Corridor: defined as the east-west travel corridor from
East Contra Costa County communities into Central Contra Costa County, consisting of Kirker Pass and SR 4.
- Far East Corridor: north-south corridor from East Contra Costa County communities into the East Alameda County area, consisting of SR 4 and
Vasco Road. The study presented a three-phase approach that would culminate into an enhanced bus service scenario in the year 2020, with improvements focusing on the needs of each of the four corridors.
1.2.2 I-680 Investment Options Analysis (2003)
The I-680 Investment Options Analysis study was completed in 2003 to address the long term travel impacts of the considerable rapid growth in development and employment witnessed and forecasted along the I-680 corridor. The study evaluated the potential of a range of multi-modal transportation capital investment options along the corridor:
- BART line from Walnut Creek BART station to West Dublin BART station
- Light Rail Transit from Walnut Creek BART station to West Dublin BART station, running primarily between I-680 median
- Light Rail Transit from Walnut Creek BART station to West Dublin BART station, running in the I-680 median and Bollinger Canyon Road
- High Occupancy Vehicle (HOV) Facilities/Express Bus Package – HOV lane and ramp improvements with additional express bus service
- Conversion of existing HOV lane to High Occupancy Toll (HOT) lane
1.2.3 System Plan for California’s Bay Area Regional Express
Bus Service (2006)
This study, carried out in collaboration with scholars and various government agencies, including Caltrans and MTC, details a plan for successful express bus service in the Bay Area. The report reviewed the state of existing express bus service and identified needs and obstacles relating to infrastructure and service- type based on research and surveys of on-board bus passengers and park-and-ride users.
1.2.4 I-80 Integrated Corridor Mobility: Corridor System
Management Plan (2010)
The I-80 Corridor System Management Plan (CSMP) reviewed the performance of the I-80 corridor (including the major arterials, intersection, ramps, transit, running along the highway) and identified causes of congestion and a mix of
Original PDF, page 16
Contra Costa Transportation Authority 2016 Express Bus Study Update appropriate improvements and strategies to enhance corridor performance. The 2010 report identified I-80 as the most congested corridor in the San Francisco Bay Area, with greater than 7,000 hours of daily delay. The report recognized that increasing capacity on the I-80 freeway is not a viable option (due to development and environmental constraints) for combating the heavy congestion and likelihood of incidents along the corridor. Instead, the report placed primary emphasis on Advanced Traffic Management solutions incorporating speed harmonization, ramp metering, and traveler information.
1.3 Studies and Projects Recently Completed or
Currently Underway
In addition to the studies summarized above, several studies and projects relevant to the design of express bus service for Contra Costa County are in progress:
- The eBART project is expected to be completed in 2017. eBART will be a self-powered diesel-multiple unit (non-electric) train that will connect east
Contra Costa County riders at Hillcrest Avenue in Antioch to the Pittsburg/Bay Point BART station, providing service every 10 minutes. The service plan for this extension of the BART system will influence the design of express bus service in eBART’s vicinity.
- AC Transit’s Major Transit Corridors Study aims to collect and analyze data along each of their key corridors, including San Pablo Avenue in west Contra
Costa County, to recommend short and long-term investment strategies that will inform the agency’s capital investment program. The study is expected to be complete in late 2016; this study coordinates with the Major Corridor Recommendations although overlap between the two efforts is limited.
- Contra Costa Transportation Authority (CCTA) and stakeholders along the I-
680 corridor recently completed the “I-680 Transit Investment/Congestion Relief Options Study.” The study recommended bus on shoulder operations along with more park-and-ride lots for greater access to transit services.
- West Contra Costa Transportation Advisory Committee (WCCTAC) and stakeholders along the I-80 corridor are developing transit recommendations to improve mobility in the West Contra Costa High Capacity Transit Study.
The study is expected to be complete in 2017.
Original PDF, page 17
Contra Costa Transportation Authority 2016 Express Bus Study Update
Corridor Summary – Today and in the
Future
Findings from previous and ongoing studies and current service performance data indicates that there is a strong market for express bus service, across many of the corridors in Contra Costa County.
This section identifies the existing express bus operators, analyzes operator performance, and documents existing express bus infrastructure conditions.
2.1 Corridor Overview
2.1.1 Far East Corridor
The Far East Corridor has historically been a corridor viewed as a natural connection to the eastern edge of Alameda County that would complete the transit network between the two counties. In the mid-2000s, Tri Delta operated service in this corridor. Average ridership was about 100 daily riders (50 each way) and as a result, service was discontinued. Both the market and the existing infrastructure create challenges to renewed service. While about 100,000 people live in Oakley and Brentwood, the land uses are primarily automobile oriented and lack traditional transit nodes or hubs. There are only two park-and-ride lots – one in Brentwood and the other in Discovery Bay – that together have about 120 spaces, and most of the users of those lots are riders destined for connections at the Pittsburg/Bay Point BART station.
2.1.1.1 Future Outlook
Interest continues to be expressed in reintroducing a bus route in the Far East Corridor. To gauge this potential, the consulting team undertook additional work using the Transit Competitiveness Index (TCI, discussed in Section 4) – none of the origins and destinations had the attributes to create a successful environment for transit services.
Based on the TCI scores and the previous pilot service, the study does not recommend implementing an express bus route between the Far East Corridor and Livermore/Dublin.
2.1.2 Highway 4 Corridor
The Highway 4 corridor is anchored by the Pittsburg/Bay Point BART station on the east and Hercules on the west. The Highway 4 corridor can be segmented into two sub-corridors: Hercules – Martinez and Martinez – Antioch.
Original PDF, page 18
Contra Costa Transportation Authority 2016 Express Bus Study Update The Martinez – Antioch segment is a heavily congested segment. Caltrans and CCTA are completing a Highway 4 improvement project between Pittsburg and Antioch. This highway segment serves about 150,000 daily vehicle trips; in addition, bus feeder transit carries more than 8,000 daily trips. The Pittsburg/Bay Point BART station has about 14,000 daily passengers (almost 7,000 boardings).
One Tri Delta Express bus and two hybrid express bus routes provides service in this corridor and feeds the Pittsburg/Bay Point BART station, along with four local bus routes. Routes 300, 390, 391 provide service generally between Antioch and the Pittsburg/Bay Point BART station. In addition, Tri Delta Route 201 travels between Pittsburg/Bay Point BART station and the Concord BART station. CCCTA 93X connects to Walnut Creek via Kirker Pass Road. However, while Tri Delta Route 201 and CCCTA 93X have established transit markets – with about 200 daily passenger trips daily on both the Tri Delta route and the CCCTA 93X – transit competitiveness in these markets is very poor.
The Hercules – Martinez segment is much less traveled, reflecting the more rural land uses along this segment of the corridor. WestCAT operates the 30Z, which links Hercules and Martinez, and like the Tri Delta Route 200 and CCCTA 93X as currently structured, is not transit competitive, although segments of the routings do suggest that with proper service design, transit can provide marketable service.
In general, routes 30Z, 93X and 200 provide lifeline services for riders who are destined for county based community and government services that are located in Martinez. While the transit competitiveness is poor and transit demand is low, these routes are needed connections within the county. This study recommends improving speed and convenience in order to increase reliability and help increase marketability of the routes.
2.1.2.1 Future Outlook
The new eBART service, which provides a 10 mile long diesel rail extension from the Pittsburg/Bay Point BART station to Hillcrest in Antioch via Highway 4, is scheduled to start operations winter 2017. A mid-point station at Railroad Avenue in Pittsburg is under construction and is expected to open in 2018. With this new service, the express bus service that operates to Pittsburg/Bay Point BART station becomes redundant. As a result, this study anticipates that at minimum route 300 will be redesigned to provide service to the new Hillcrest eBART station, and would not be classified as express bus service.
Based on the transit markets served, the study considered opportunities to improve the 30Z, 93X and 200 for speed and convenience in order to improve its transit competitiveness. Additional service on County Connection Route 93X could create an attractive single seat ride from Antioch and Concord to downtown Walnut Creek (with relatively high TCI scores from Concord to Walnut Creek) with service continuing to Bishop Ranch and Dublin/Pleasanton. This expanded route links Antioch/Pittsburg to Concord, John Muir/Shadelands, downtown
Original PDF, page 19
Contra Costa Transportation Authority 2016 Express Bus Study Update Walnut Creek, and then Bishop Ranch and Dublin/Pleasanton. This route serves a distinct travel corridor while complementing BART service.
2.1.3 I-80 Corridor
This corridor is the regional powerhouse of the four corridors in Contra Costa, with about 125,000 vehicle trips crossing at the Carquinez Bridge and another 180,000 at the Alameda County line. In Contra Costa, I-80 serves more than 200,000 trips at San Pablo Dam Road, with more than 14,000 vehicle trips in the peak hour. About 80,000 daily I-80 vehicle trips are generated within Contra Costa County.
The I-80 Corridor is a strong transit market, both for BART and for buses. As in other Contra Costa corridors, BART’s alignment diverges from the freeway alignment, suggesting that buses – using the freeway – could provide access into BART at this point of divergence. The divergence along I-80 Corridor is especially pronounced. BART diverges from the I-80 Corridor at El Cerrito del Norte. From this point northward, I-80 provides the only regional infrastructure for an eight mile urbanized area from El Cerrito to Hercules. This area – all of which is outside the BART corridor – has a population of more than 125,000.
Beyond Hercules, the corridor continues for another four miles and serves Rodeo and Crockett, with a combined population of about 12,000. At this point, the freeway enters Solano County via the Carquinez Bridge.
I-80 – with frequent and attractive WestCat and AC Transit service – has the highest bus transit ridership of the Contra Costa corridors. However, the corridor’s demographics and congestion suggest that express bus can capture an even greater share of the market, carry more people and contribute to expanded mobility in a highly congested highway corridor. To do so, a rethinking of the organization of transit services – to create a more uniform and legible service pattern – is suggested. A challenge to expanding the express bus market is the corridor’s existing congestion level – despite a continuous HOV lane - that reduces bus service reliability and competitiveness as a preferred mode choice.
In addition, like the other corridors, but to a very pronounced degree, I-80 trips extend well into Alameda County.
2.1.3.1 Future Outlook
With three main operators – AC Transit, WestCat and BART – and several Solano and Napa operators providing service to or from this corridor, the plan recommends creating a sub-corridor network, where major stop locations or station hubs are shared between operators, allowing passengers a range of operators and a more robust number of bus trips. Schedules are communicated so that passengers know that a bus for their destination comes at a set frequency, and they can take the next bus, regardless of which operator provides that service. The
Original PDF, page 20
| Route Characteristics | Performance | ||||
|---|---|---|---|---|---|
| Distance: | 17 miles (from Hercules Transit Center) | ||||
| Trips within corridor | 500 | ||||
| Transit travel time (peak) | 65 minutes | ||||
| Auto travel time (peak, average) | 45 minutes | ||||
| Park-and-ride Facilities | Hercules Transit Center/Richmond Parkway | ||||
| HOV Lane | Yes | ||||
| Transit Service Levels | N/A | ||||
| Potential New Access Points | Potential New Access Points | Central Avenue University Avenue Hollis Street (Emeryville) |
Contra Costa Transportation Authority 2016 Express Bus Study Update role of express bus is strengthened and confusion that may exist due to multiple operators operating within the same corridor will be lessened.
In addition to strengthening existing routes, there is an opportunity to create a new route that serves the residential communities around Hercules to employment destinations in Emeryville, an area without direct BART service. A recommendation from the 2001 study, this connection has never been implemented. In the past, the viability of the Hercules-Emeryville route has been challenged by a lack of transit infrastructure and a centralized end destination, leading to an inability to create routes that serve multiple markets and provide time-competitive service. Continued development of a potential route will need to consider reconciling matching transit markets with time competitiveness service options5.
Table 1: Sample Route Consideration – Hercules to Emeryville No current service exists and travel between the two markets requires multiple transfers from bus to BART to bus. Table 1 demonstrates that a Hercules – Richmond Parkway – Emeryville route shows promise as a viable service, subject to infrastructure improvements to address service reliability as this study assumes the new route would be a service extension. An express route service would provide a one-seat ride for customers, taking advantage of significant existing transit infrastructure including park-and-ride lots and HOV lanes, to serve a market with more than 25,000 jobs (Emeryville and west Berkeley). There are freeway access deficiencies, with Hercules and Richmond Parkway having the only in-corridor freeway transit access (other than the AC Transit 72R which 5 The West County High Capacity Transit Study has studied a potential new express route to Emeryville. For information on the study’s most recent information, please refer to http://westcountytransitstudy.com/
Original PDF, page 21
Contra Costa Transportation Authority 2016 Express Bus Study Update operates on an arterial), and a recommendation for implementing this as a new route would be in concert with a recommendation to complete the HOV median drop ramps at Richmond Parkway.
The TCI was also used in this corridor and indicates potential competitiveness for express bus intra-East Bay trips, especially if the BART Vision Plan consideration of a new in-fill Richmond I-80 station proceeds6. Should the BART in-fill station be developed, the Hercules-Emeryville route gains additional origin riders (in Richmond) and also gains another destination (BART).
2.1.4 I-680 Corridor
While the I-80 Corridor is highly significant regionally, I-680 carries a large amount of traffic generated within the county. About 100,000 vehicles enter at the Benicia Bridge, but by Pleasant Hill more than 275,000 daily vehicle trips are occurring – almost three times the volume over the bridge. At Dublin, about 175,000 daily vehicle trips occur. In the peak hour, the highest volume occurs in Pleasant Hill, with about 20,000 vehicles.
While there is significant I-680 traffic, transit volumes are small – only about 2,400 daily trips express bus passenger trips. Much of the service is oriented to Bishop Ranch, along with downtown Walnut Creek. Service is focused on these markets, but due to dispersed land uses, routes rely on park-and-ride lots for access and trips are long and often circuitous. Similar to the I-80 Corridor, I-680 diverges from BART north of the Pleasant Hill BART station and serves a different catchment. Within this area north and west of BART almost 100,000 people reside. South of Walnut Creek (cities of Danville and San Ramon) about 125,000 people live distant from a BART connection.
2.1.4.1 Future Outlook
The challenge of increasing transit demand in the corridor is communicating that the transit trip is a competitive mode compared to auto travel – currently, bus travel into Bishop Ranch on the express routes can be completed faster than an auto trip. Unfortunately, transit is not viewed as a viable travel choice, given the lack of convenience from dispersed land uses, availability of free parking, and accessibility. The plan recommends building on the recommendations of the I-680 Transit Investment Congestion Relief Options Study to increase the number of park-and-ride locations along the corridor, as well as advocating for shoulder running bus operations to reduce travel times and allow for the use of bus stops on freeway ramps, significantly increasing the catchment of the transit system.
6 The West County High Capacity Transit Study has studied BART alternatives which did not include the Richmond I-80 infill station. For information on the study’s most recent information, please refer to http://westcountytransitstudy.com/
Original PDF, page 22
| Route Characteristics | Performance | ||||
|---|---|---|---|---|---|
| Distance: | 20 miles (to Bishop Ranch) | ||||
| Trips within corridor | 3,000 | ||||
| 20 minutes | |||||
| Transit travel time (peak, Walnut Creek | |||||
| to San Ramon) | |||||
| Auto travel time (peak, average) | 30 minutes | ||||
| Service Frequency | ~10-20 min peak/ 2 midday trips | ||||
| Park-and-ride Facilities – Transit Usable | Rudgear Road/I-680; I-680/Sycamore | ||||
| HOV Lane | Yes |
Contra Costa Transportation Authority 2016 Express Bus Study Update The challenges that express bus service faces in this corridor are highlighted by an example trip from Walnut Creek to San Ramon – Bishop Ranch in Table 2.
Table 2: Sample Trip – Concord/Walnut Creek to San Ramon/Bishop Ranch HOV Lane Yes In this corridor, transit is faster than automobiles, as buses can use the HOV lane and bypass congestion. However, the number of access points (bus stops south of Walnut Creek) is limited, and the availability of free parking and the dispersed nature of Bishop Ranch effectively limits transit competitiveness to a very low level. Maintaining faster bus speeds and increasing transit access is a key consideration for encouraging transit use and making the corridor competitive for transit. The TCI increased substantially when the sample trip shown in Table 2 was tested from Concord to Walnut Creek to Dublin/Pleasanton BART, with stops at Bishop Ranch, Stone Valley, El Cerro and Sycamore Valley and assumed San Ramon parking charges.
Legibility, access and travel time are keys to meeting the promise of what is evolving into a strong I-680 transit market. Rather than propose new routes, the plan recommends a streamlining and strengthening of existing routes by combining routes, increasing frequencies and increasing access points (park-and- ride locations/bus stops) to make a more robust service that responds to potential customers and translates into new customers.
Original PDF, page 23
Contra Costa Transportation Authority 2016 Express Bus Study Update
Current Express Bus Services
3.1 Express Bus Operators
3.1.1 Contra Costa County Express Bus Operators
Operators considered part of the Contra Costa express bus network include Alameda-Contra Costa Transit District (AC Transit), Central Contra Costa Transit Authority (County Connection), Eastern Contra Costa Transit Authority (Tri Delta Transit), and Western Contra Costa Transit Authority (WestCAT). All of these operators provide express bus service that originates within Contra Costa County.
In addition, there are a number of other operators providing express bus service that originates outside Contra Costa County. A detailed description of the express bus routes is provided in Table 3.
3.1.1.1 Alameda-Contra Costa Transit District (AC Transit)
The Alameda-Contra Costa Transit District is the third-largest public bus system in California, with seven days a week service covering 364 square miles including 13 cities and adjacent unincorporated areas in Alameda and Contra Costa counties. Within Contra Costa County, AC Transit serves the cities of El Cerrito, Pinole, San Pablo, Richmond and also the communities of El Sobrante, Kensington, and North Richmond. Regional service is focused around its Transbay routes, primarily serving downtown San Francisco via the Bay Bridge, as well as Foster City and San Mateo via the San Mateo Bridge, and Stanford and Palo Alto via the Dumbarton Bridge.
3.1.1.2 Central Contra Costa Transit Authority (County
Connection)
County Connection is organized as a joint powers agency of the cities of Clayton, Concord, Lafayette, Martinez, Orinda, Pleasant Hill, San Ramon, Walnut Creek;
the towns of Danville and Moraga; and the unincorporated areas of central Contra Costa County. CCCTA operates County Connection bus service seven days a week, providing both local and express bus fixed-route and paratransit services throughout a 200-square mile service area.
County Connection operates six express routes, all along the I-680 corridor. A majority of the routes serve at least one regional transit center, with minimal local service compared to the AC Transit Transbay routes.
3.1.1.3 East Contra Costa Transit Authority (Tri Delta Transit)
Tri Delta Transit provides seven days a week service covering 225 square miles of Contra Costa County, generally bounded by the Sacramento and San Joaquin
Original PDF, page 24
Contra Costa Transportation Authority 2016 Express Bus Study Update Rivers to the north, San Joaquin County to the east, Alameda County to the south and the Willow Pass grade to the west. Tri Delta Transit operates three express routes from East Contra Costa County via SR 4 that focus on BART connections.
Two of the routes serve the Pittsburg/Bay Point BART station (a major regional transit center) and one route connects East Contra Costa County to Central Contra Costa County.
3.1.1.4 West Contra Costa Transit Authority (WestCAT)
The Western Contra Costa Transit Authority (WestCAT) provides seven days a week service covering just over 20 square miles of Western Contra Costa County, including the cities of Pinole and Hercules and the unincorporated areas of Montalvin Manor, Bayview, Tara Hills, Rodeo, Crockett and Port Costa. The service area is bounded to the north by the Carquinez Straight, the city limits of Pinole and Hercules to the east, the Richmond city border to the south and by San Pablo Bay to the west. In addition, WestCAT operates five express bus routes in West Contra Costa County, primarily operating on the I-80 corridor. The routes are designed to connect passengers to a variety of destinations, including regional transit centers and downtown San Francisco.
3.1.2 Operators with Routes into Contra Costa County
The operators in this section provide at least one express bus route that originates outside of Contra Costa County and ends within Contra Costa County, typically at a regional transit center. Most express routes by these operators generally only have one or two stops within Contra Costa County, and do no pick up passengers once in Contra Costa County. The exception is with Delta Breeze Route 52, which has several stops in Antioch, and Golden Gate Transit (GGT) Route 40/42, which has several stops in Richmond. Operators who fall into this category include Fairfield and Suisun Transit (FAST), GGT, Livermore Amador Valley Transit Authority (LAVTA/Wheels), Rio Vista Delta Breeze (Delta Breeze), SolTrans, and VINE Transit.
3.1.2.1 Fairfield and Suisun Transit (FAST)
The FAST fixed route transit system is comprised of 13 routes, two of which are intercity routes that connect Fairfield and Suisun City to El Cerrito del Norte BART station, Pleasant Hill BART station, and Walnut Creek BART station on Route 40 and Route 90, respectively.
3.1.2.2 Golden Gate Transit Bus
The Golden Gate Bridge, Highway and Transportation District (GGBHTD) operates and maintains the Golden Gate Bridge and provides three types of fixed- route service: GGT Bus, Golden Gate Ferry, and privately contracted Club Bus.
Original PDF, page 25
Contra Costa Transportation Authority 2016 Express Bus Study Update GGT Bus operates two express routes into Contra Costa County, Route 40/42, running between San Rafael and the El Cerrito del Norte BART station.
3.1.2.3 Livermore Amador Valley Transit Authority
(LAVTA/Wheels)
The LAVTA service area comprises the three suburban municipalities of Dublin, Pleasanton, and Livermore (Tri-Valley) and some unincorporated areas within Alameda County. LAVTA operates Route 70X and 70XV, providing service between Dublin and the Walnut Creek and Pleasant Hill BART stations.
3.1.2.4 Rio Vista Delta Breeze (Delta Breeze)
Rio Vista Delta Breeze (Delta Breeze) is managed by City of Rio Vista and operated by a transit contractor. Delta Breeze provides transportation to local destinations as well as connecting Rio Vista to Pittsburg and Antioch through the Route 52 SR 160 Express.
3.1.2.5 Solano Transit Authority (SolTrans)
In 2009, Vallejo Transit and Benicia Breeze consolidated into SolTrans. SolTrans operates five intercity, commuter express bus routes to locations in Contra Costa County, including Routes 78, 80 and 80s to El Cerrito and Walnut Creek or Pleasant Hill BART stations.
3.1.2.6 VINE Transit
VINE Transit is Napa County’s public transit system overseen by the Napa County Transportation and Planning Agency. VINE Transit operates between the cities of Calistoga, St. Helena, Napa, American Canyon and the township of Yountville. Of the five regional express routes in the system, Route 29 is operated between Calistoga and the El Cerrito del Norte BART station.
3.1.2.7 Other Service Providers
A number of private employers have begun to operate transit service in the region, with many routes utilizing park-and-ride and transit centers as locations to pick up employees. Many of these employers are located outside of the county, but pick up passengers within the county. Generally these services are not open to the public.
Bishop Ranch in San Ramon provides one regional express bus service to San Francisco or Santa Clara County that is available only to Bishop Ranch tenant employees. Fares are $5.50 per trip on the two express routes:
Original PDF, page 26
Contra Costa Transportation Authority 2016 Express Bus Study Update
- San Francisco Express Bus provides weekday service between Bishop
Ranch and multiple locations within San Francisco. Buses make one morning trip from Park Presidio and Clement Street in San Francisco at 6:20AM and one evening trip from Bishop Ranch leaving at 5:00PM.
- Silicon Valley Express Bus provides weekday service between Cupertino,
San Jose, Fremont and multiple locations within the Bishop Ranch campus. Buses make one morning trip from Cupertino at 6:45AM and one evening trip leaving Bishop Ranch at 5:20PM.
At the Dublin/Pleasanton BART station, buses operating in the I-680 Corridor also connect with BART and buses from San Joaquin County.
Original PDF, page 27
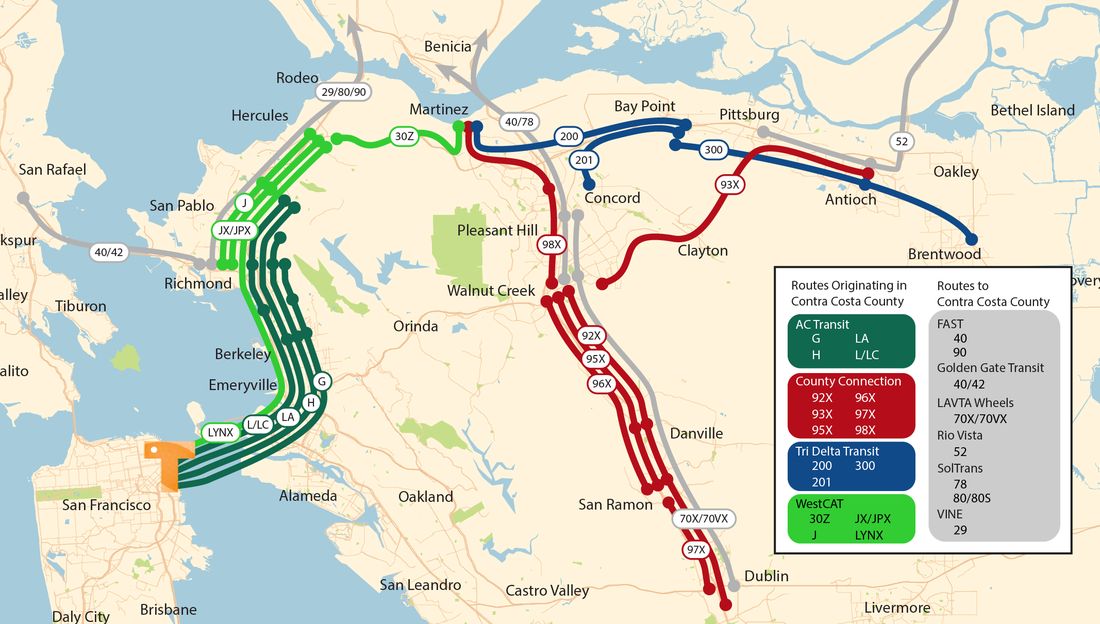
Contra Costa Transportation Authority 2016 Express Bus Study Update Figure 1: Existing Express Bus Routes in Contra Costa County
| Route | Operator | Major Stops | Connections | Weekday | Weekday Span of Service | ||
|---|---|---|---|---|---|---|---|
| Peak | |||||||
| Headways | |||||||
| G | AC Transit | El Cerrito - Kensington - Albany - Berkeley - San Francisco Transbay Terminal | 30 | 5:55 AM-8:45 AM 4:40PM-8:09PM | |||
| H | AC Transit | Richmond - El Cerrito - Kensington - Berkeley - San Francisco Transbay Terminal | 20 | 6:10AM-9:12AM 4:15 PM - 8:08 PM | |||
| L/LC | AC Transit | Richmond - El Cerrito - Albany - San Francisco Transbay Terminal | 15 | 5:30AM – 9:10 AM 3:10 PM - 10:08 PM | |||
| LA | AC Transit | Richmond - San Francisco Transbay Terminal | 20 | 5:23 AM - 9:17 AM 3:30 PM - 8:07 PM | |||
| J/JR/J L | WestCAT | Hercules Transit Center - Pinole - Richmond - | BART | 15 | 4:34 AM - 12:32 AM |
Contra Costa Transportation Authority 2016 Express Bus Study Update
3.2 Express Bus Routes by Corridor
Using the same corridor organization first outlined by the 2001 study, express bus routes are categorized within four primary corridors:
- I-80
- I-680
- East to Central (SR 4)
- Far East (SR 4)
When organized by corridor, there are a total of 12 express routes serving the I-80 Corridor within Contra Costa County. Five of these routes are operated by WestCAT, six by AC Transit two by Solano Express service operated by FAST and SolTrans, and one by VINE Transit.
Table 3: L I-80 Express Routes
Original PDF, page 29
| Route | Operator | Major Stops | Connections | Weekday | Weekday Span of Service | ||
|---|---|---|---|---|---|---|---|
| Peak | |||||||
| Headways | |||||||
| BART | |||||||
| JX | WestCAT | Hercules Transit Center - El Cerrito del Norte BART | BART | 15 | 5:20 AM - 8:36 AM 3:39 PM - 8:10 PM | ||
| JPX | WestCAT | Hercules Transit Center - Pinole Valley - El Cerrito del Norte BART - Richmond Parkway Transit Center | BART | 15 | 5:20 AM - 8:36 AM 3:39 PM - 8:10 PM | ||
| Lynx | WestCAT | Hercules Transit Center – San Francisco Transbay Terminal | 15-20 | 5:00 AM - 9:10 AM 3:30 PM - 8:33 PM | |||
| 40/42 | Golden Gate | El Cerrito - Richmond - Point Richmond - San Quentin - San Rafael | AC Transit, SolTrans, FAST, WestCAT, Amtrak, BART | 30 | 5:44 AM - 11:55 PM | ||
| 90 | FAST | Fairfield - El Cerrito del Norte BART | BART, Amtrak | 15 | 4:10 AM - 8:12 PM | ||
| 80 | SolTrans | Vallejo - El Cerrito del Norte BART | BART | 15 | 4:15 AM - 11:25 PM | ||
| 29 | VINE Transit | Calistoga (select trips) – El Cerrito del Norte BART | BART | 15-60 | 4:44 AM – 7:13 PM |
Contra Costa Transportation Authority 2016 Express Bus Study Update
Contra Costa Transportation Authority 2016 Express Bus Study Update
3.2.1 I-680 Express Bus Route
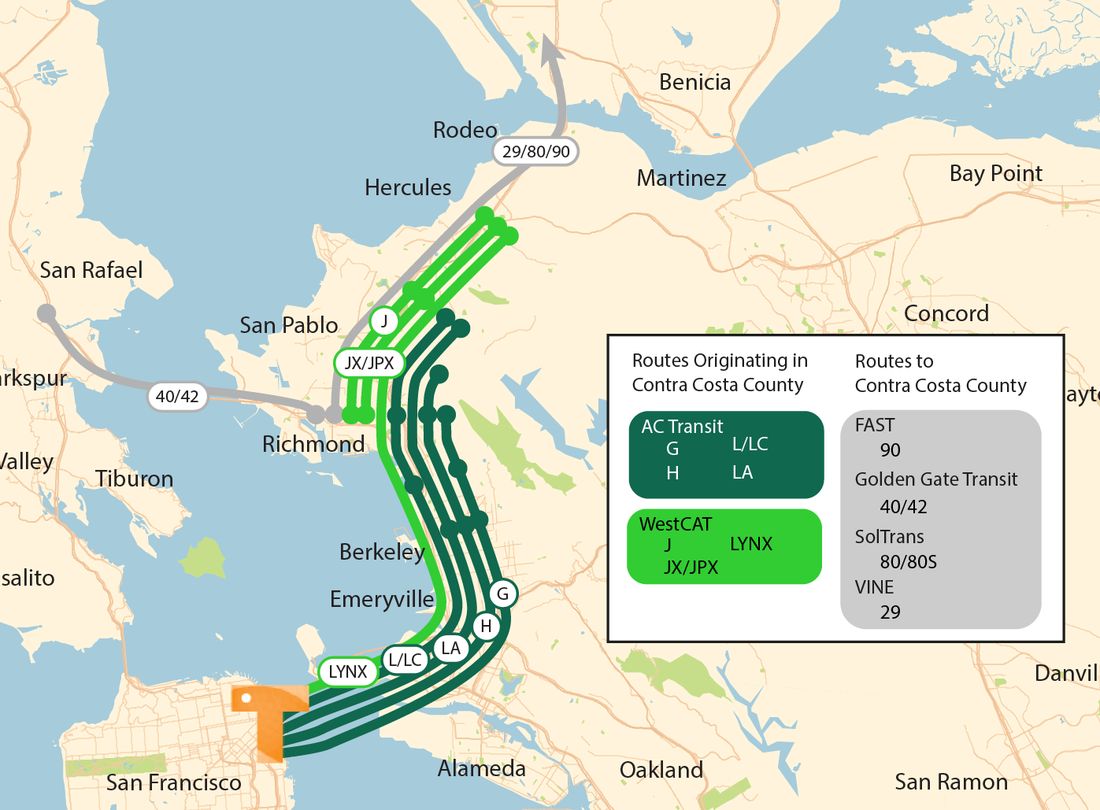
A total of nine routes serve the I-680 corridor within Contra Costa County, with County Connection the predominate operator. Figure 2: Existing Express Bus Routes and Major Stops Along the I-80 Corridor
Original PDF, page 31
| Route | Operator | Major Stops | Connections | Weekday Peak | Weekday Span | ||||
|---|---|---|---|---|---|---|---|---|---|
| Headways | of Service | ||||||||
| 92X | CCCTA | Pleasanton Train Station (ACE) - Bishop Ranch - San Ramon Transit Center | ACE | 60 | 5:53 AM to 7:19 PM | ||||
| 95X | CCCTA | San Ramon Transit Center - Walnut Creek BART | BART | 30 | 6:30 AM - 9:00 AM and 4:00 PM - 7:00 PM | ||||
| 96X | CCCTA | Walnut Creek BART - Bishop Ranch | BART | 20 | 5:35 AM - 7:50 PM | ||||
| 97X | CCCTA | Dublin BART - Bishop Ranch | BART | 30 | 6:30 AM - 7:00 PM | ||||
| 98X | CCCTA | Amtrak - Concord - Walnut Creek BART | BART, Amtrak | 30 | 5:40 AM - 7:20 PM | ||||
| 78 | SolTrans | Vallejo - Benicia -Walnut Creek | BART | 20 | 6:00 AM - 8:30 PM | ||||
| 70X | Wheels | Pleasant Hill BART - E. Dublin/Pleasanton BART - Walnut Creek BART - Hacienda | BART | 30 | 6:30 AM - 8:54 AM and 4:00 PM -6:54 PM | ||||
| 70 | Wheels | Pleasant Hill BART - E. Dublin/Pleasanton BART - Walnut Creek BART - Hacienda | BART | Two trips per day | 7:36 AM trip, 4:45 PM return trip | ||||
| 40 | FAST | Vacaville - Fairfield - Pleasant Hill - Walnut Creek BART | BART | 15-45 min. | 4:58 AM - 9:15 AM and 3:17 PM - 8:29 PM |
Contra Costa Transportation Authority 2016 Express Bus Study Update Table 4: I-680 Express Routes
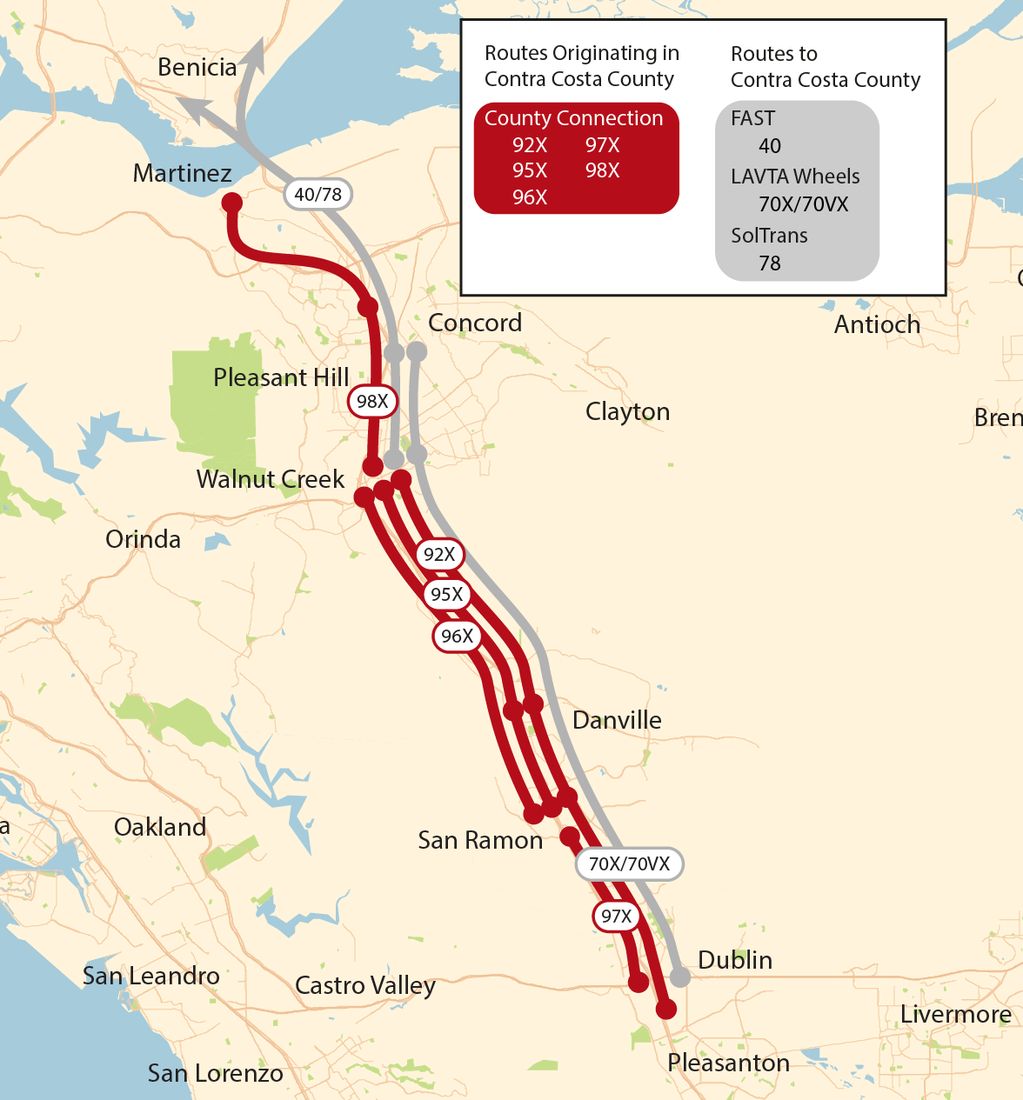
Contra Costa Transportation Authority 2016 Express Bus Study Update Figure 3: Existing Express Bus Routes along I-680 Corridor
3.2.2 East to Central (SR 4) Express Bus Routes
Along the Highway 4 corridor, six express routes are operated by Tri Delta Transit, County Connection, Rio Vista and WestCat.
Original PDF, page 33
| Route | Operator | Major Stops | Connections | Weekday | Weekday | ||||
|---|---|---|---|---|---|---|---|---|---|
| Peak | Span of | ||||||||
| Headways | Service | ||||||||
| 93X | CCCTA | Hillcrest P&R - John Muir Medical Center - Walnut Creek BART | BART | 30 | 5:07 AM - 7:41 PM | ||||
| 200 | TriDelta | Pittsburg/Bay Point – Martinez | Martinez Amtrak | 60-70 | 6:44 AM – 5:56 PM | ||||
| 201 | TriDelta | Bay Point BART - Concord BART | Concord BART | 30 | 6:10 AM - 7:35 PM | ||||
| 300 | TriDelta | Pittsburg BART - Brentwood P&R | BART, Brentwood P&R | 15 | 4:12 AM - 10:00 PM | ||||
| 30Z | WestCAT | Hercules Transit - Martinez | Amtrak, County Connection, Capitol Corridor | 30 | 6:16 AM – 7:40 PM | ||||
| 52 | RioVista Delta Breeze | Rio Vista – Isleton –Antioch – Pittsburg/Bay Point BART | BART | One trip per weekday | 5:15 AM - 7:15 AM |
Contra Costa Transportation Authority 2016 Express Bus Study Update Table 5: Highway 4 Express Routes
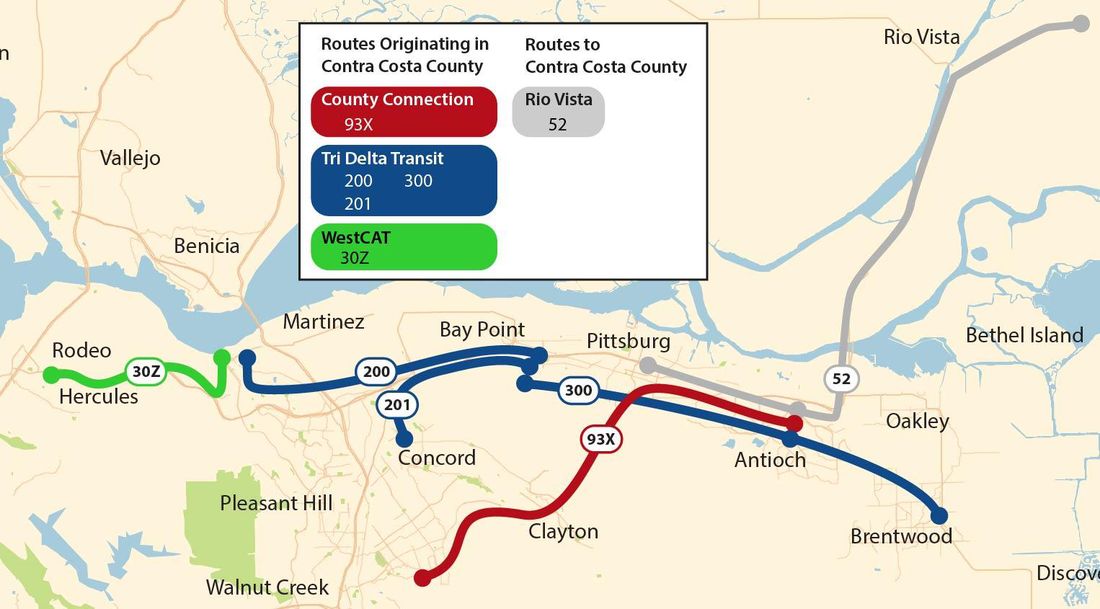
Contra Costa Transportation Authority 2016 Express Bus Study Update Figure 4: Existing Express Bus Routes along SR 4 Corridor
Contra Costa Transportation Authority 2016 Express Bus Study Update Tables 6, 7 and 8 include operators with routes originating in Contra Costa County and operators with routes ending in Contra Costa County. This study focuses on routes originating in Contra Costa County. Including routes ending in Contra Costa County provides context for the full transit conditions along each corridor as well as what the major transfers points are.
Transfer Agreements Many of the operators have agreements for passengers transferring from one operator to another. The BART Plus Ticket was discontinued as of January 1, 2016. BART Plus ticket users can switch to Clipper to pay fares when transferring between BART and buses. The following operators accept Clipper fare payment: County Connection, Tri Delta Transit, WestCAT, and Wheels.
The East Bay Value Pass allows transit customers to ride all WestCat, Wheels, Tri Delta Transit and County Connection fixed route buses for a single $60 per month pass. The pass is not valid on the Delta Express or Lynx.
3.3 Express Bus Service Performance
The different corridor characteristics influence the type of express bus service provided, from the more urban environment along the I-80 to the suburban communities along I-680 and SR 4. Service performance data from the operators provides a window into understanding how well particular routes are performing and whether certain travel markets are transit friendly. Understanding service performance allows operators to continually improve response to both the market as well as customer needs. Bus service is uniquely positioned to be flexible in making service adjustments, compared to fixed transit services, such as rail. Data on current service performance was collected from the four study operators: AC Transit, County Connection, Tri Delta Transit, and WestCAT. Each operator was asked to provide information on:
- Weekday ridership
- Revenue hours
- Revenue miles
Based on the operator provided data, additional metrics were calculated, including:
- Passengers per revenue hour
- Passengers per revenue mile
- Farebox recovery ratio
Original PDF, page 36
| Route | Operator | Weekday Ridership | Annual Revenue Hours | Passengers | Passengers | Farebox Recovery | ||||||
|---|---|---|---|---|---|---|---|---|---|---|---|---|
| per | per | |||||||||||
| Revenue | Revenue | |||||||||||
| Hour | Mile | |||||||||||
| 30Z | WestCAT | 200 | 5,156 | 9.2 | 0.4 | 8.1% | ||||||
| J/JR/JL | WestCAT | 2,500 | 16,754 | 20.2 | 1.2 | 24.1% | ||||||
| JX | WestCAT | 5,111 | 18.1 | 0.7 | 19.5% | |||||||
| JPX | WestCAT | 7,985 | 18.6 | 0.9 | 21% | |||||||
| Lynx | WestCAT | 1,700 | 12,053 | 19.0 | 0.6 | 86% | ||||||
| G | AC Transit | 350 | 2,834 | 31.7 | 1.1 | 53% | ||||||
| H | AC Transit | 600 | 5,122 | 30.3 | 0.9 | 47% | ||||||
| L | AC Transit | 700 | 5,062 | 27.6 | 1.7 | 45% | ||||||
| LA | AC Transit | 600 | 4,680 | 25.1 | 1.2 | 62% | ||||||
| LC | AC Transit | 60 | 1,027 | 11.9 | 0.8 | 50% |
Contra Costa Transportation Authority 2016 Express Bus Study Update The service performance for each route is organized by corridor. This method of organization also allows more even comparison, as operating characteristics linked to the I-80 corridor may be different from those found on the I-680 corridor.
In total, about 9,500 weekday trips are provided on the Contra Costa Express Bus services. Table 6: I-80 Corridor Route Service Performance (Weekday, Annualized)
Original PDF, page 37
| Route | Operator | Weekday Ridership | Annual | Passengers | Passengers | Farebox Recovery8 | ||||||||
|---|---|---|---|---|---|---|---|---|---|---|---|---|---|---|
| Revenue | per Revenue | per Revenue | ||||||||||||
| Hours | Hour | Mile | ||||||||||||
| 92X | CCCTA | 180 | 2,635 | 17.2 | 0.7 | 123% | ||||||||
| 95X | CCCTA | 170 | 2,558 | 16.8 | 0.8 | 73% | ||||||||
| 96X | CCCTA | 500 | 8,028 | 16.0 | 0.7 | 95% | ||||||||
| 97X | CCCTA | 100 | 2,503 | 10.6 | 0.5 | 102% | ||||||||
| 98X | CCCTA | 370 | 6,744 | 13.9 | 0.8 | 49% |
| Route | Operator | Weekday Ridership | Annual | Passengers | Passengers | Farebox Recovery | ||||||||
|---|---|---|---|---|---|---|---|---|---|---|---|---|---|---|
| Revenue | per Revenue | per Revenue | ||||||||||||
| Hours | Hour | Mile | ||||||||||||
| 200 | Tri Delta | 160 | 4,493 | 12.4 | 0.7 | 14.7% | ||||||||
| 201 | Tri Delta | 270 | 6,962 | 17.9 | 1.5 | 21.1% | ||||||||
| 300 | Tri Delta | 800 | 17,737 | 18.5 | 0.9 | 21.9% | ||||||||
| 93X | CCCTA | 220 | 3,357 | 16.3 | 0.8 | 89% |
Contra Costa Transportation Authority 2016 Express Bus Study Update Table 7: I-680 Corridor Route Service Performance (Weekday, Annualized)7 CCCTA 6,744 13.9 0.8 49% Table 8: SR 4 East Corridor Route Service Performance (Weekday, Annualized)9 7 CCCTA Mini SRTP FY 2014 - 2023 8 Some routes are above 100% due to fare contract agreements. When combined with fare revenue, exceed the cost to deliver the service 9 Data provided by operators
Original PDF, page 38
Contra Costa Transportation Authority 2016 Express Bus Study Update
3.4 Private Services
3.4.1 Semi Private/Private Shuttle Programs
Private shuttle programs have been in operation for many years, often providing last mile services between transit centers and/or park-and-ride lots to large employment destinations such as hospitals, colleges or business parks. San Mateo County has a robust employer paid shuttle program that is overseen by Commute.org, the county’s transportation demand management agency. Emery- Go-Round is a well-established employer paid shuttle provided free of charge and open to all riders. The rise of longer distance employer shuttles has become a visible phenomenon to the Bay Area transit scene. Outside of San Francisco, these long distance employer shuttles typically use park-and-ride lots and transit centers as a collector point, similar to express bus operations.
With the increase of long distance employer shuttles occurring so quickly, and coupled with lack of publicly available info from employers, it is not fully understood how many riders the private shuttles are running, their schedules, or pick up and drop off locations. BART has begun to informally track shuttle usage at all of its station locations. Tracking is reliant on informal reports and shared personal experiences. BART has not formally coordinated with all of the employer based shuttles, with exception of some long standing programs, including Emery-Go-Round.
Of the BART stations located in Contra Costa County, only six stations were noted to have shuttles present. As discussed previously, because the tracking exercise is informal, employer shuttles may be stopping at stations that BART is unaware of. There is also no formal tracking of employer shuttles at park-and-ride lots. BART has noted that not all shuttle operators contact BART for permission to frequent a station before beginning service, a practice that may also likely extend to park-and-ride lots.
Overall, the full extent that private shuttle operators use public facilities is unknown. Anecdotal evidence suggests that the demand for spaces such as bus bays/loading zones at transit centers and park-and-ride lots will only continue to grow.
3.4.2 Vanpool Services
Vanpool programs operate out of several Contra Costa County cities, with more than 70 vanpools originating in the County and about 40 vanpools that end in the County. Vanpools range in size from seven to fifteen passengers. 511.org tracks the home city and the work city for each registered vanpool, but does not track the exact origin and destination location.
Original PDF, page 39
| BART Station | Shuttle Name / Affiliation | ||||
|---|---|---|---|---|---|
| Concord | CSU Concord Commuter Shuttle | ||||
| Concord Gateway Office | |||||
| Concord Airport Plaza | |||||
| Concord Hilton | |||||
| El Cerrito Del Norte | DHS Shuttle | ||||
| Kaiser Employee - El Cerrito del Norte Shuttle | |||||
| El Cerrito Del Norte | Marina Bay Circular - El Cerrito del Norte Shuttle | ||||
| El Cerrito Plaza | UC Berkeley RFS Shuttle | ||||
| Orinda | Genentech - Rockridge, Orinda Shuttle | ||||
| Richmond | Kaiser Richmond Medical Center Shuttle | ||||
| Richmond Circular Eastbound Shuttle | |||||
| Richmond Circular Westbound Shuttle | |||||
| Richmond | Wareham Point - Richmond Shuttle | ||||
| Walnut Creek | Walnut Creek Hilton |
Contra Costa Transportation Authority 2016 Express Bus Study Update The 511 Contra Costa Vanpool incentive program provides a three-month incentive (a 50% discount) for drive-alone commuters who live and work in Contra Costa County. In addition, the Vanpool Driver Bonus Program provides a $1,000 bonus for starting a new vanpool and being in continuous operation for 12 months.
It is unclear at this time how many of the 70 County vanpools use park-and-ride or transit center facilities to collect vanpool riders. Table 9: Noted Shuttle Operators Utilizing Contra Costa BART Stations
Original PDF, page 40
Contra Costa Transportation Authority 2016 Express Bus Study Update
3.5 Express Bus Infrastructure
Express bus infrastructure encompasses the physical facilities, including transit vehicles that enable transit operators to provide service. The physical facilities that support express bus service include:
- Passenger facilities o Transit Centers o Park-and-ride lots o Curbside Stops
- Freeway facilities o HOT/HOV lanes o HOT/HOV exit/on ramps o In-line bus stations (including all elements for a bus station) o Pedestrian crossings/access to in-line bus stations
- Transit vehicles
- Transit Maintenance Facilities o Vehicle Storage o Fueling Facilities o Washing and Maintenance stations o Maintenance supportive vehicles
Compared to local and arterial bus services, express bus service typically requires greater supportive physical infrastructure to be successful. Key express bus design concepts strive for good access and fast speeds. While some express bus services make curb-side stops, generally express bus services stay on freeways as much as possible and encourage passengers to come to the bus, rather than the bus coming to the passenger. Under these conditions, more amenities are required to encourage passengers to use the system and these include transit centers, adequate adjacent automobile parking, in-line stations, or stops along freeway ramps. The physical infrastructure plays a large role, on elements such as service design, headways, and overall trip times:
- Transit centers and park-and-ride lots influence the marketability (by providing access), the design of the service (the location of the route), as well as the cost of providing that service (through route expansions). Where the transit centers and park-and-ride lots are located affect route design and influence trip travel times and the number of vehicles required to maintain headways. The number of vehicles assigned to a route are expenditures that must be considered by operators as they maintain or expand their system.
- Freeway facilities also influence the service design through travel times as well as determining which transit centers or park-and-ride lots are selected as pick up points. If a transit center or park-and-ride lot is not easily accessible via freeway facility, the decision may be made to not serve it based on
Original PDF, page 41
Contra Costa Transportation Authority 2016 Express Bus Study Update balancing priorities of service efficiency, such as maintaining headways, on- time performance, and travel trip times.
- Bus route headways (and the number of trips that can be made) are determined by vehicle availability, which is, in turn, impacted by route speed. Faster routes require fewer vehicles when headways are constant.
Most, but not all, Contra Costa County express bus routes make use of transit centers or park-and-ride lots. AC Transit Transbay route H and L and WestCAT’s Lynx service make local stops collecting passengers prior to operating on I-80 into San Francisco. County Connection routes also make local stops in San Ramon and Walnut Creek. It should be noted that Contra Costa County express bus service is generally defined by bus routes that serve major transit centers, park-and-ride lots, and regional employment centers, compared to many of the AC Transit Transbay routes operating in Alameda County that collect passengers entirely on local roadways before travelling to San Francisco.
The infrastructure that supports the express bus network in Contra Costa County is significantly realized from the recommendations identified in the 2001 Express Bus Study. Many park-and-ride locations have been established along the three major corridors, and the most recently complete, Pacheco Transit Hub, specifically recognizes the 2001 study as the impetus for expanding the previous park-and-ride location.
3.5.1 Passenger Facilities
Passenger facilities range from transit centers with bus bays and shelter amenities to park-and-ride lots with white zone pick up curb for passengers to load and unload from buses. Transit centers and park-and-ride lots that are currently served by Contra Costa express bus routes are described in the following sections.
Contra Costa County has a total of 22 park-and-ride lots and eight transit centers used by express buses. For the purposes of this report, the Richmond Parkway and Hercules Transit Center have been categorized as transit centers and not park-and- ride lots. Many have bike racks and lockers available for use.
3.5.1.1 Transit Centers
Transit Centers are typically served by at least one operator with multiple routes (express and local) serving the transit center. At Richmond Parkway, both AC Transit and WestCAT express routes serve the transit center. At the Hercules Transit Center, WestCAT is the only operator providing service, but both local and express routes serve the location. BART stations are also considered within this category, and are major collector points for express bus passengers. Table 10 shows the transit centers with current express bus route service.
Original PDF, page 42
| Location | Parking Spaces | Parking | Ownership | Operators | Adjacent | ||||||
|---|---|---|---|---|---|---|---|---|---|---|---|
| Cost | to | ||||||||||
| per day | Freeway | ||||||||||
| I-80 Transit Centers | |||||||||||
| Richmond | 206 | $3 | AC Transit, Caltrans | WestCAT, AC Transit | Yes | ||||||
| Parkway Transit | |||||||||||
| Center | |||||||||||
| Richmond BART Station | Richmond | Parking for express bus passengers not allowed | BART | WestCAT | No | ||||||
| BART Station | |||||||||||
| El Cerrito del Norte BART Station | Parking for express bus passengers not allowed | BART | AC Transit, WestCAT, Golden Gate Transit, FAST, SolTrans, VINE | No | |||||||
| El Cerrito Plaza BART Station | Parking for express bus passengers not allowed | BART | AC Transit | No | |||||||
| Hercules Transit | 420 | $3 | BART | WestCAT | Yes | ||||||
| Center | |||||||||||
| I-680 Transit Centers | |||||||||||
| ACE Pleasanton | Free | ACE | County Connection | No | |||||||
| Transit Station | |||||||||||
| Pleasant Hill BART Station | Pleasant Hill | Parking for express bus passengers not allowed | BART | County Connection, Fairfield and Suisun Transit, SolTrans, Wheels | |||||||
| BART Station | |||||||||||
| San Ramon | 100 | Free | City of San Ramon | County Connection | No | ||||||
| Transit Center | |||||||||||
| Walnut Creek BART Station | Walnut Creek | Parking for express bus passengers not allowed | BART | County Connection, Tri Delta Transit | Yes | ||||||
| BART Station | |||||||||||
| SR 4 Transit Centers | |||||||||||
| Concord BART Station | Concord BART | Parking for express bus passengers not allowed | BART | Tri Delta Transit | Yes | ||||||
| Station |
Contra Costa Transportation Authority 2016 Express Bus Study Update Table 10: Transit Centers with Existing Express Bus Service
| Location | Parking Spaces | Parking | Ownership | Operators | Adjacent | ||||||
|---|---|---|---|---|---|---|---|---|---|---|---|
| Cost | to | ||||||||||
| per day | Freeway | ||||||||||
| Martinez Intermodal Station | 425 | Free for day use, 110 spaces reserved for long term parking | City of Martinez | County Connection, Tri Delta Transit, WestCAT | No | ||||||
| Antioch Park- | 1,00010 | Free | Antioch | County Connection, Tri Delta Transit | Yes | ||||||
| and-Ride at | |||||||||||
| Hillcrest |
Contra Costa Transportation Authority 2016 Express Bus Study Update The Richmond Parkway Transit Center is unique as it includes a dedicated HOV southbound on-ramp and northbound off-ramp to access the site from the freeway.
Provision was made for a parallel facility on the north side of the intersection, but the project has not been built. Hercules Transit Center is a relocation of the previous site nearer to the commercial center of the city.
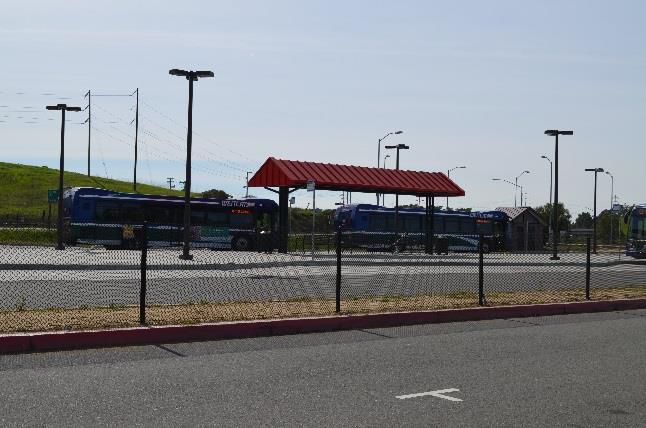
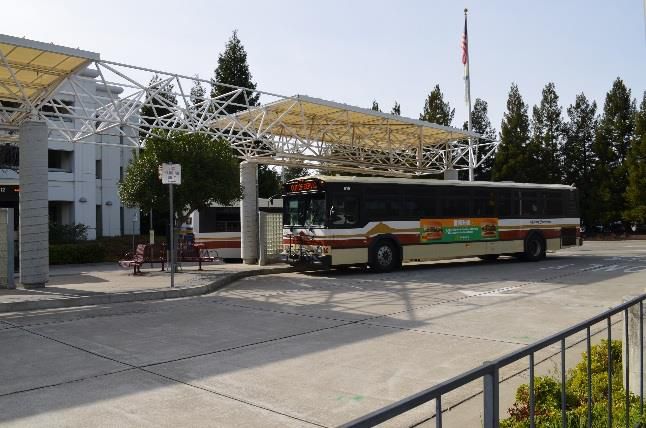
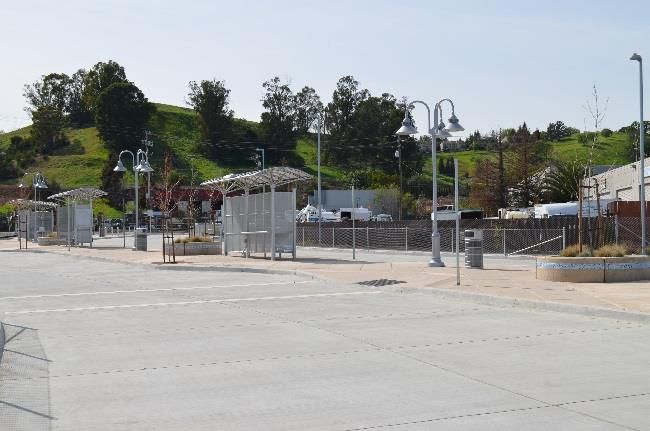
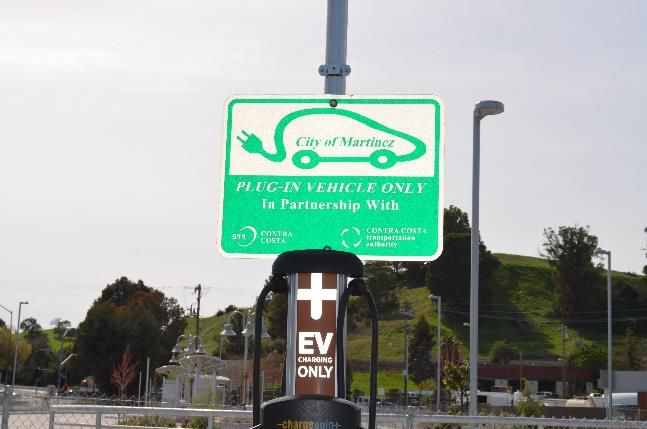
Figure 5: Images of Transit Centers 10 Upon eBART service beginning in 2017, all parking will be available to BART customers only Clockwise from top left: Hercules Transit Center, Pacheco Transit Center, electric car charging station at Pacheco Transit center, San Ramon Transit Center.
Original PDF, page 44
| Location | Spaces | Parking | Ownership | Express | Adjacent | ||||||||
|---|---|---|---|---|---|---|---|---|---|---|---|---|---|
| Cost per | Routes | to | |||||||||||
| Day | Served | Freeway | |||||||||||
| I-80 Park-and-ride Lots11 | |||||||||||||
| Hilltop Dr (at I-80) | 146 | Free | Caltrans | None | Yes | ||||||||
| I-680 Park-and-ride lots | |||||||||||||
| Danville at Sycamore | 230 | Free | Town of Danville | County Connection | Yes | ||||||||
| Valley Rd | |||||||||||||
| San Ramon | 56 | Free | City of San Ramon | None | No | ||||||||
| (Stoneleaf and | |||||||||||||
| Bayporte) | |||||||||||||
| San Ramon | 108 | Free | City of San Ramon | None | Yes | ||||||||
| (Bollinger Canyon | |||||||||||||
| and I-680) | |||||||||||||
| Walnut Creek | 96 | Free | Unknown | County Connection | No | ||||||||
| (Mitchell and Oak | |||||||||||||
| Grove) | |||||||||||||
| Walnut Creek | 64 | Free | Caltrans | None | Yes | ||||||||
| (Rudgear and I-680) | |||||||||||||
| Concord (Willow | 45 | Free | Unknown | none | Yes | ||||||||
| Pass Rd and Market |
Contra Costa Transportation Authority 2016 Express Bus Study Update
3.5.1.2 Park-and-Ride Facilities
Park-and-ride facilities expand the catchment area of potential express bus riders by offering parking immediately adjacent to the bus pick up location. Where transit centers may be shared facilities with other modes, park-and-ride lots typically only have one transit mode serving it. Parking is often free to users, whereas at transit stations, parking is often restricted to the owner of the station.
For example, at BART stations, parking is open only to BART riders. Express bus riders who access an express route at a BART station are not allowed to park their cars within the station’s parking lot. Many park-and-ride facilities have bike racks and lockers available for use.
Park-and-ride lots are typically located immediately adjacent to freeways, and range in size from several dozen parking spaces to hundreds of parking spaces.
Some park-and-ride facilities are located specifically along a route away from the freeway in order to increase the level of access to potential passengers within the community. Park-and-ride lots with express bus service are shown in Table 11.
Table 11: Park-and-ride Lots 11 Note: San Pablo/Vale Road Park-and-ride no longer listed as active.
Original PDF, page 45
| Location | Spaces | Parking | Ownership | Express | Adjacent | ||||||||
|---|---|---|---|---|---|---|---|---|---|---|---|---|---|
| Cost per | Routes | to | |||||||||||
| Day | Served | Freeway | |||||||||||
| St) | |||||||||||||
| SR -4 Park-and-ride Lots | |||||||||||||
| Brentwood Park-and- | 82 | Free | Brentwood | Tri Delta Transit | No | ||||||||
| Ride | |||||||||||||
| Antioch Park-and- Ride at Hillcrest | Antioch Park-and- | 1,00012 | Free | Antioch | Tri Delta Transit, County Connection | Yes | |||||||
| Ride at Hillcrest | |||||||||||||
| Pacheco Transit Hub | 144 | Free | Caltrans | None | Yes | ||||||||
| Martinez (Alhambra | 26 | Free | Caltrans | Tri Delta Transit | Yes | ||||||||
| Rd and Franklin | |||||||||||||
| Canyon Rd) | |||||||||||||
| Hercules (Willow Av | 69 | Free | Caltrans | WestCAT | Yes | ||||||||
| and WB I-80) | |||||||||||||
| Hercules (Willow Av | 23 | Free | Caltrans | WestCAT | Yes | ||||||||
| and EB I-80) | |||||||||||||
| SR 24 Park-and-ride Lots | |||||||||||||
| Orinda (Wilder Rd & | 19 | Free | Unknown | None | Yes | ||||||||
| Hwy 24) |
Contra Costa Transportation Authority 2016 Express Bus Study Update 12 Upon eBART service beginning in 2017, all parking will be available to BART customers only
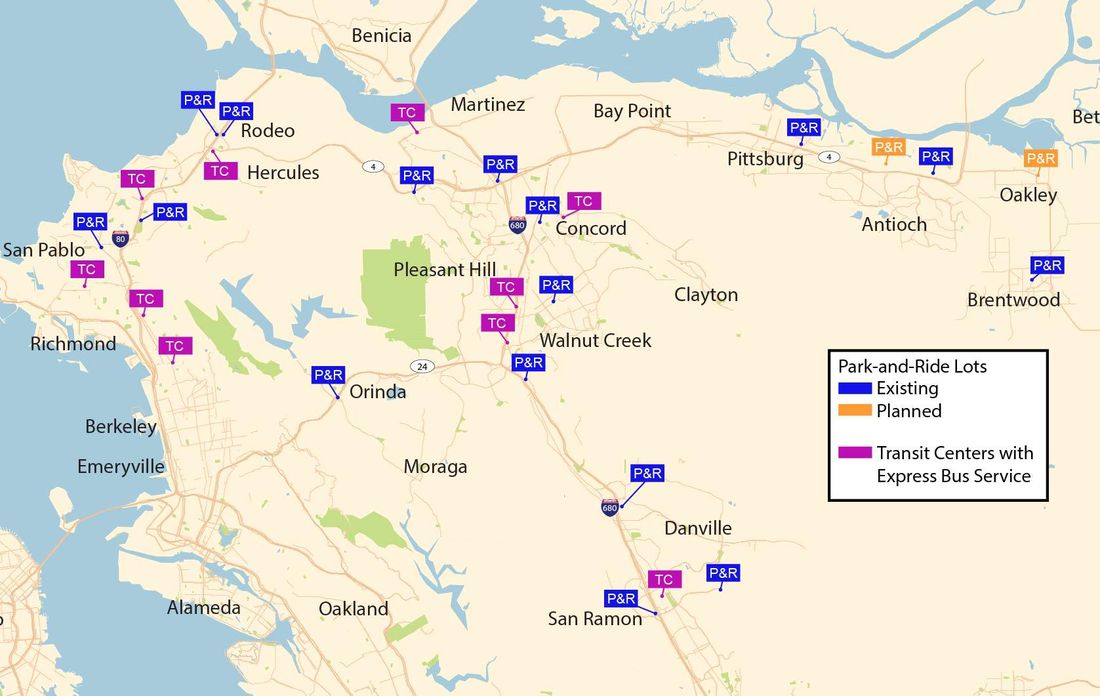
Contra Costa Transportation Authority 2016 Express Bus Study Update Figure 6: Existing Park-and-Ride Lots and Transit Center Facilities in Contra Costa County13 13 The existing park-and-ride facilities at Bliss Avenue in Pittsburg and Hillcrest in Antioch will transition to eBART parking with parking limited to BART customers only, with the commencement of eBART service
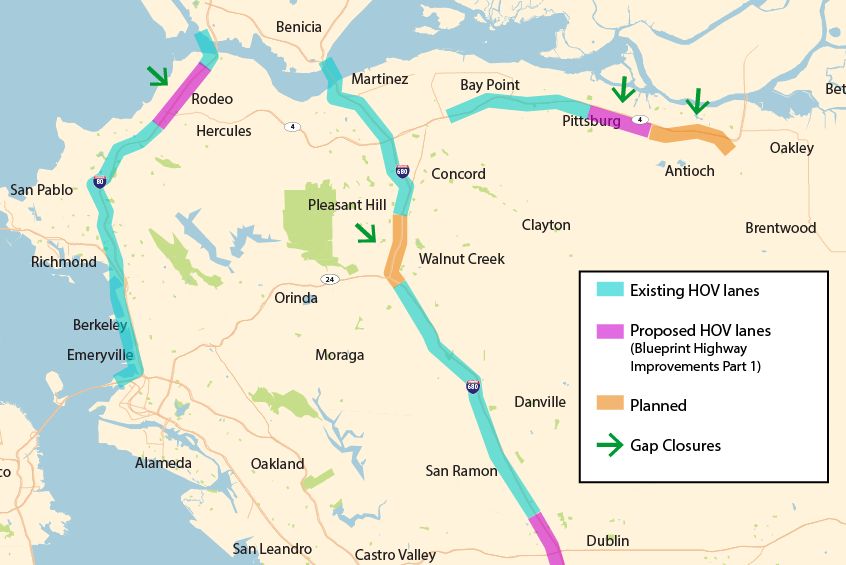
Original PDF, page 47
Contra Costa Transportation Authority 2016 Express Bus Study Update
3.5.2 Freeway Facilities
Freeways, as the backbone of the regional transportation system, continue to be the subject of intense focus as the network is experiencing increasing congestion, driven by the region’s dynamic economic expansion. Breakdowns within the network regularly occur, and the region has begun a long range process to convert existing HOV lanes into toll lanes in order to make vehicular travel more efficient.
HOV lanes have been implemented in all Contra Costa County freeway corridors with the exception of Highways 24 and 242. Portions of Highway 4 between Hercules and Concord; Highway 4 east of Antioch; and I-680 between Pleasant Hill and Danville. Figure 7 highlights where HOV lanes have been implemented in Contra Costa County.
Figure 7: Existing HOV Lanes within Contra Costa County
3.5.3 Express Bus Fleet
The express bus fleet mix is unique to each operator. Some operators dedicate branded vehicles on their express bus routes while others interline the express bus routes with both long-haul coach vehicles and standard buses. The sizes of the dedicated express buses also vary between operators. Some operators use 40’ commuter coaches while others use 45’ commuter coaches. The difference between the 40’ and 45’vehicles is18 seats.
Original PDF, page 48
Contra Costa Transportation Authority 2016 Express Bus Study Update All operators use fixed route vehicles. Different vehicles within an operator’s fleet can include14:
- Transit Bus (or Transit Coach): A bus with front and center doors, normally with a rear-mounted engine, low-back seating, and without luggage compartments or restroom facilities for use in frequent-stop service. This is what is used most typically on fixed route systems. A 40-foot coach is the common type bus used in larger systems. This vehicle can usually hold about
42 ambulatory passengers when two wheelchair tiedowns are provided. A 35- foot coach will hold about 35 ambulatory passengers and a 30-foot coach will hold about 30 passengers15. The average life expectancy of transit coach chassis is about 12 years. It is common for the engine and other equipment to be rebuilt a number of times.
- Articulated Bus: Extra-long (54 to 60 feet) bus with the rear body section connected to the main body by a joint mechanism. The accordion-like joint mechanism allows the vehicle to bend when in operation for sharp turns and curves and yet have a continuous interior. It can hold about 60 passengers.
- Double Deck Bus: High-capacity bus having two levels of seating, one over the other, connected by one or more stairways. Total bus height is usually 13 to 14.5 feet, and typical passenger seating capacity ranges from 40 to 80 people
- Over-the Road Bus: (Also referred to as an Intercity or Highway coach.) A bus with front door only, with high-backed seats for use in high-speed, long- distance service. Usually 40-foot or longer, with only forward-facing, reclining seats. They usually hold about 57 passengers and are all wheelchair accessible.
- Suburban Bus: A bus with front doors only, normally with high-backed seats, and without luggage compartments or restroom facilities for use in longer- distance service with relatively few stops. They are usually 35 to 42 feet in length
14 Definitions from https
//www.codot.gov/programs/commuterchoices/documents/trandir_transit.pdf 15 Standees are typically not permitted on express bus routes
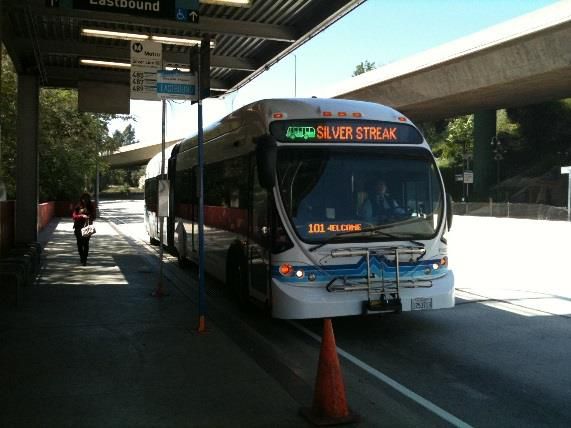
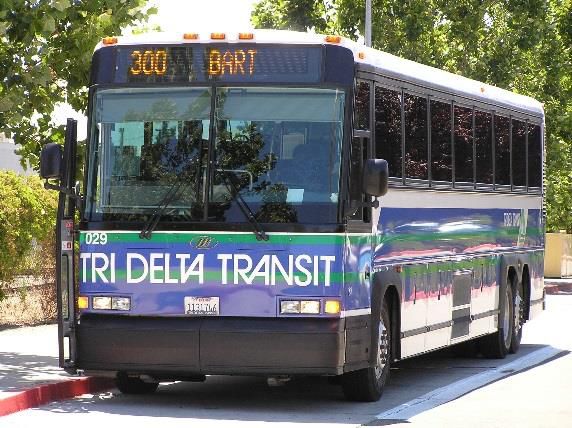
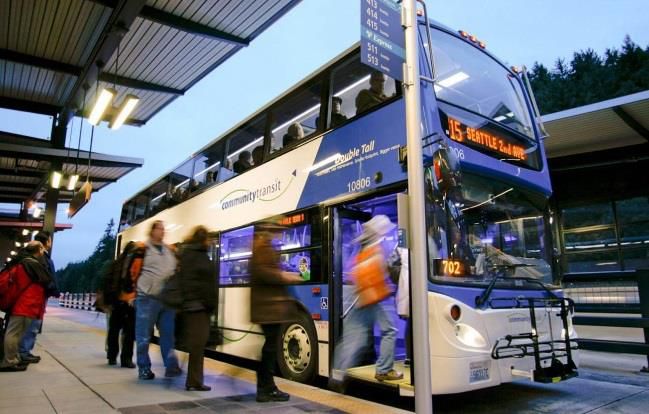
Original PDF, page 49
Contra Costa Transportation Authority 2016 Express Bus Study Update Figure 8: Images of Transit Vehicles During a recent pilot program, both AC Transit and WestCAT tested a double- deck bus during revenue service hours. AC Transit ran the bus on several of its routes, offering free rides to passengers during the pilot run. WestCAT piloted the same bus in its fleet during a two week period following the AC Transit program.
Clockwise from top left: Los Angeles Metro Silver Line Articulated Bus, Community Transit Double Tall double deck bus, Tri Delta Transit Coach Bus, AC Transit Rapid Over-the-Road Bus
Original PDF, page 50
| Transit Operator | Vehicle Type | # of Vehicles | Seating Capacity | Vehicle Length | Service Year/ Retirement Year | ||
|---|---|---|---|---|---|---|---|
| AC | Over the Road | 11 | 57 | 45’ | 2000/2016 | ||
| Transit17 | Transit | 26 | 36 | 40’ | 2013/2025 | ||
| County | Suburban | 19 | 36 | 40’ | 2014/2026 | ||
| Connection | |||||||
| Tri Delta | Over the Road | 4 | 52 | 45’ | 2001/2016 | ||
| Transit | Over the Road | 4 | 54 | 45’ | 2000/2017 | ||
| WestCAT | WestCAT | Over the Road | 6 | 57 | 45’ | n/a | |
| Suburban | 3 | 36 | 40’ | ||||
| Suburban | 16 | 36 | 40’ | ||||
| Suburban | 2 | 36 | 40’ |
Contra Costa Transportation Authority 2016 Express Bus Study Update Table 12: Existing Express Bus Only Fleet16
3.5.3.1 On-Board Passenger Amenities
The current express bus fleet serving Contra Costa County passengers offers a limited number of technology-based amenities that may encourage more riders to the service. AC Transit, County Connection and WestCAT both offer free Wi-Fi on board their Transbay buses and a number of both free and fee based mobile phone applications are available for download to provide real time departure/arrival information. The AC Transit website provides a list of mobile phone applications available for riders to download on their phones. All County Connection buses also have Wi-Fi; County Connection also offers real time arrival information through a free mobile phone application (Transit App) available for both Apple and Android devices. All operators have links to the 511 transit application, a mobile website, or rider alerts where passengers can sign up for system notifications via voice or text message.
It is important to acknowledge the importance of technology in people’s everyday lives, and the prominence it plays in relation to everyday tasks, especially transportation and the public’s transportation choices. How transit agencies will participate, adopt, and implement technology as part of its base suite of services is an important question as services continue to evolve to support and reflect the needs of its riders.
16 This does not take into account standard buses that are used to interline into express bus routes 17 Estimate of AC buses assigned to Contra Costa County service areas.
Original PDF, page 51
Contra Costa Transportation Authority 2016 Express Bus Study Update
3.6 Current Funding
The four transit agencies that operate express bus service in Contra Costa County use a mix of funding for operating and capital expenditures. While each agency has a unique blend of funding, their primary funding sources are very similar. In general, the following sources are used to fund Express Bus operations:
- State Transportation Development Act (TDA)
- State Transit Assistance (STA)
- Regional Measure 2 Bridge Tolls (RM-2)
- BART Feeder Bus18
- Contra Costa County Measure J Sales Tax (Measure J)
- Passenger Fares
The specific mix of capital funding depends on the type and timing of the capital investments. Some types of capital funding are limited in what they can purchase, and others are only available during a specific timeframe (such as bond proceeds).
In general, the following funding sources have been used for the Contra Costa transit agencies’ capital programs:
- Federal Transit Administration Section 5307 Urbanized Area Formula
Program (FTA 5307)
- TDA
- STA
- Regional bridge tolls
- Proposition 1B Transportation Bond Program
Contra Costa’s transit agencies – like most agencies nationwide – do not provide route-by-route funding plans. Therefore, determining exactly how much of each source is used for the Express Bus routes is not feasible. Similarly, the capital plans from the agencies do not provide specific information for the express bus components.
Appendix A provides more detailed information about the funding sources, including eligible uses, revenue estimates, and requirements for each.
Following the economic recession in 2008, transit operators in Contra Costa County had to implement service reductions. Details regarding the annual service hours for the most recently reported years in Contra Costa County can be found in Table 13.
18 AC Transit does not receive BART Feeder Bus funds
Original PDF, page 52
| Operator | 2004 | 2005 | 2006 | 2007 | 2008 | 2009 | 2010 | 2011 | 2012 | 2013 | ||||||||||||||||||||||
|---|---|---|---|---|---|---|---|---|---|---|---|---|---|---|---|---|---|---|---|---|---|---|---|---|---|---|---|---|---|---|---|---|
| AC | 1,915 | 1,800 | 1,817 | 1,822 | 1,897 | 1,870 | 1,856 | 1,686 | 1,614 | 1,631 | ||||||||||||||||||||||
| Transit19 | ||||||||||||||||||||||||||||||||
| change | -7% | -6% | 1% | 0% | 4% | -1% | -1% | -9% | -4% | 1% | ||||||||||||||||||||||
| CCCTA | 285 | 260 | 243 | 260 | 281 | 267 | 216 | 209 | 209 | 214 | ||||||||||||||||||||||
| change | -6% | -9% | -7% | 7% | 8% | -5% | -19% | -3% | 0% | 2% | ||||||||||||||||||||||
| ECCTA | 157 | 159 | 161 | 161 | 170 | 161 | 154 | 156 | 153 | 155 | ||||||||||||||||||||||
| change | 6% | 1% | 1% | 0% | 6% | -5% | -4% | 1% | -2% | 1% | ||||||||||||||||||||||
| WCCTA | 76 | 80 | 87 | 94 | 98 | 86 | 74 | 76 | 79 | 78 | ||||||||||||||||||||||
| change | 3% | 5% | 9% | 8% | 4% | -12% | -14% | 3% | 4% | -1% |
Contra Costa Transportation Authority 2016 Express Bus Study Update Table 13: Annual Vehicle Revenue Hours by Operator, in Thousands Source: National Transit Database These service changes in effect re-set the baseline level of service for each transit provider. Using this new base level of service, the current funding outlook for Contra Costa County’s express bus services is generally stable. Numerous revenues from a variety of sources are available to fund both operations and capital needs. Several local and regional funding programs provide specific revenue streams for express bus operations, such as Measure J, RM-2, and the BART Feeder Bus program. The farebox recovery rates for the express bus routes are strong, with an average of approximately 32 percent, with a range from 8 to 86 percent.
Future Conditions and Transit Market
In the last half-decade, the region experienced significant growth and an awareness that transit is both a mobility solution and also has practical limitations.
To help frame the potential for new and better express bus services, the Transit Competitiveness Index was used as a tool to identify the corridors with the greatest potential. After corridors are defined and assessed, a conceptual service plan, along with a menu of capital improvements, provides the county with a reasonable plan for growing express bus services logically and reasonably20.
19 Includes total systemwide hours
Only about 11% of the total hours operate within Contra Costa County per AC Transit staff estimate. 20 The West County High Capacity Transit Study has modeled future population and growth in West County. This study’s scope did not include demand modeling, instead using the TCI tool to identify potential express bus transit markets. More detailed West Count modeling results can be found at http://westcountytransitstudy.com/.
Original PDF, page 53
Contra Costa Transportation Authority 2016 Express Bus Study Update
4.1 Transit Competitiveness Tool (TCI)
To identify where transit could succeed, the analysis included the use of the Transit Competitive Index (TCI) tool. The TCI is a composite metric that identifies transit competitive areas in the Bay Area. The TCI output is a single score reflecting multiple market conditions (including trip purpose, drive egress time, parking costs at the destination, congestion, urban form, socioeconomic characteristics, and market segment concentration). These conditions are weighted in proportion to their effect on mode choice for each market segment. A TCI score of 100 or more indicates an area or origin-destination pair considered “transit- competitive”, or how competitive a trip made by transit will be compared to a vehicle trip.
A limitation of the TCI is its use of the Plan Bay Area forecasts for population, employment and other demographics. These forecasts, developed several years ago, have in many corridors exceeded their 30 year forecasts in just five years. As a result, the analysis uses the 2040 TCI scores, which are (in general) representative of current conditions. As the region (and the corridors) continue to grow, and as congestion increases, future TCI scores will likely increase and transit will have better success in more applications.
The TCI assesses transit competitiveness with both demographic information and forecasts (for example, transit is more competitive with high job density) and the relative difference in travel time and cost between automobiles and transit. As an example, converting “free” parking to $10 a day parking (which is about the average cost in Oakland and even greater in San Francisco) can easily move a score of less than 100 above the bar. Combined with infrastructure changes (i.e., bus-on-shoulder, freeway stations, signal priority, metering and bus queue jumps) the scores will be even higher.
For the purposes of this study, the TCI is reported as 2040 in the base condition, and with a $10 parking charge, which serves as a proxy for either pricing changes in the corridor or bus infrastructure improvements. Used in this way, the TCI tool indicates transit competitiveness of existing express routes and other potential markets and corridors.
Figure 9 illustrates the zones that were calculated for transit competitiveness. Each of the zones was linked to another on the map, creating ‘corridors’, although the corridors were created to closely match existing express bus routes. Both individual “point-to-point” markets were surveyed, as well as “corridor” studies where multiple zones were combined to indicate overall competitiveness (as an example, the TCI was used from Walnut Creek to San Ramon, and from Concord, Walnut Creek and Dublin/Pleasanton to San Ramon).
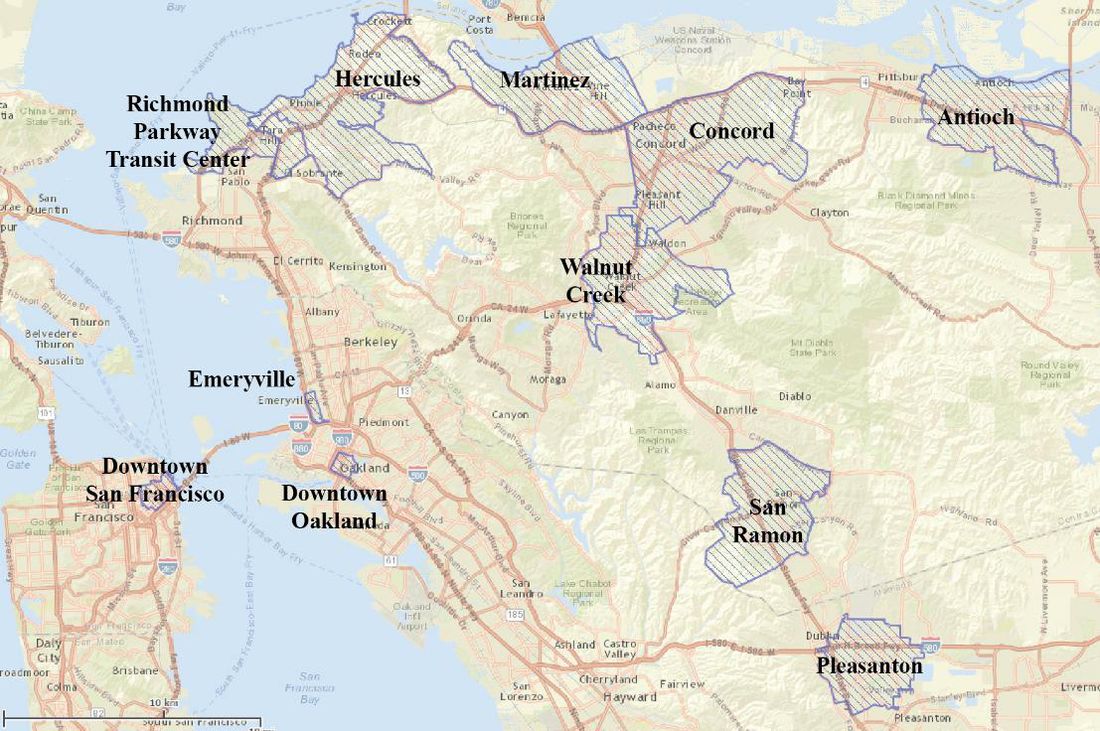
Original PDF, page 54
Contra Costa Transportation Authority 2016 Express Bus Study Update Figure 9: Zone Groups Analyzed in TCI Analysis Table 14 shows the corridors used with the TCI tool. Parking costs were assumed for both Emeryville and San Ramon, but downtown San Francisco and Oakland already have parking charges incorporated into the TCI matrix. Scores above 100 are bolded.
Original PDF, page 55
| Corridor | TCI Score- | TCI Score- | Trips | |||||
|---|---|---|---|---|---|---|---|---|
| Baseline | with Increased | |||||||
| Parking Costs | Parking Costs | |||||||
| I-80 | Richmond Parkway Transit Center to Downtown San Francisco | 2,370 | N/A | 2,639 | ||||
| Richmond Parkway Transit Center to Downtown Oakland | 971 | N/A | 987 | |||||
| Richmond Parkway Transit Center to Emeryville | 20 | 68 | 163 | |||||
| Hercules to Downtown San Francisco | 5,844 | N/A | 3,596 | |||||
| Hercules to Emeryville | 33 | 118 | 220 | |||||
| Corridor: Hercules- Richmond Parkway to Emeryville | 39 | 128 | 517 | |||||
| Corridor: Hercules-Richmond Parkway-Richmond I-80- Emeryville | 78 | 221 | 1,422 | |||||
| I-680 | Walnut Creek to San Ramon | 60 | 136 | 734 | ||||
| Walnut Creek to Dublin/Pleasanton | 25 | N/A | 93 | |||||
| Concord to San Ramon | 63 | 206 | 234 | |||||
| Concord to Walnut Creek | 1,891 | N/A | 1,927 | |||||
| Dublin/Pleasanton to San Ramon | 159 | 326 | 414 | |||||
| Corridor: Concord-Walnut Creek-Dublin/Pleasanton to San Ramon | 62 | 155 | 1,383 | |||||
| SR 4 | Antioch to Walnut Creek | 28 | N/A | 323 | ||||
| Antioch to Pleasanton | N/A | N/A | N/A | |||||
| Antioch to Martinez | 4 | N/A | 126 | |||||
| Antioch to Downtown San Francisco | 1,235 | N/A | 582 | |||||
| Antioch to Downtown Oakland | 707 | N/A | 207 |
Contra Costa Transportation Authority 2016 Express Bus Study Update Table 14: TCI Score by Corridors – 2040 Forecast Year
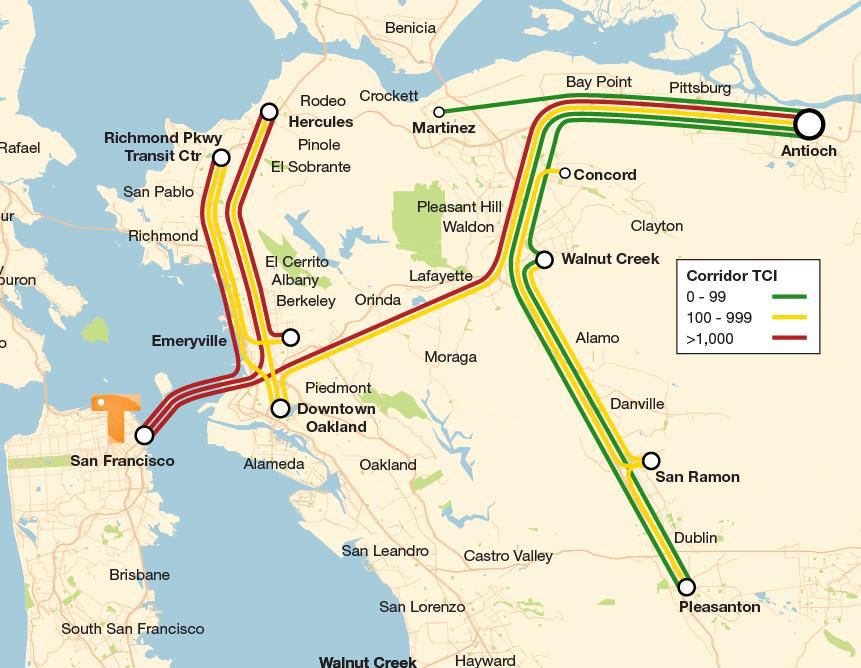
Contra Costa Transportation Authority 2016 Express Bus Study Update Figure 10: Corridors by TCI Score
4.1.1 TCI Results and Service Implications
Figure 10 shows the TCI results for each express bus corridor assuming the $10 parking proxy. The color red indicates that an area or corridor is highly competitive and green indicates less competitiveness. While individual scores may range widely above 100, the actual scores when compared against one another do not indicate that one corridor may be exponentially more competitive than another, rather that both high scoring corridors are highly competitive.
Transit is already competitive to downtown Oakland and San Francisco and, assuming a combination of either pricing or infrastructure improvements that create faster and more reliable transit travel times, transit will also be competitive in the Hercules-Richmond-Emeryville corridor and in the Concord-Walnut Creek- San Ramon-Dublin/Pleasanton corridor. Other corridors have limited potential.
Original PDF, page 57
Contra Costa Transportation Authority 2016 Express Bus Study Update
4.2 Planned Infrastructure Improvements
The freeway improvement projects and the addition of new park-and-ride locations are helping to focus the future direction of express bus service and the express bus network overall. As freeways become more efficient in moving cars and people, incorporating in-line stations could be seen as the next logical progression of the network. In the long term, in-line stations can take advantage of the Intelligent Transportation Systems (ITS) embedded in the freeway system, allowing express bus service to maintain competitive travel times against single occupancy vehicles.
In the near term, new bus fleets and new vehicle types, such as the double deck buses tested by AC Transit and WestCAT offer passengers an enhanced transit experience while increasing capacity as demand for transit continues to increase.
Identifying new infrastructure needs, developing projects, and constructing them are done over a multi-year time period. Needs are identified and projects are conceived often several years before a project is completed and becomes available to the public. Operators and planning agencies must attempt to predict the future by making decisions in the near term. This report provides the background for considering future infrastructure needs against what is already in place or planned to be implemented.
4.2.1 Passenger Facilities
There are two new planned park-and-ride facilities, both in the Tri Delta Transit service area.
- Antioch at Somersville Road/6th: A 3.5 acre site with proposed 173 spaces
- Oakley at Cypress and Main: A 2.25 acre site with proposed 142 spaces
Both facilities will be owned by Tri Delta Transit, although neither project is currently fully funded. Tri Delta Transit anticipates the two new facilities are replacements for the future parking/space losses in Pittsburg and Antioch once eBART opens in 2017. The Oakley park-and-ride lot will also serve riders of Route 300.
4.2.2 Freeway Improvements
A number of county and regional projects are currently under construction or planned for near term completion. Many of the projects are aimed at improving traffic conditions on, along, or off of the highway system, and side benefits from these efforts will also greatly benefit express bus service and operations. These benefits include adding additional HOV capacity or provision for improved express bus service. The following projects highlight the major efforts being considered or constructed in the County.
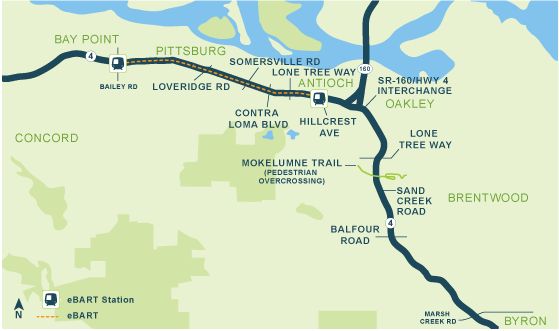
Original PDF, page 58
Contra Costa Transportation Authority 2016 Express Bus Study Update
4.2.2.1 East County
In east Contra Costa County, the Highway 4 widening project is a billion dollar investment that will widen the highway from four to eight lanes between Pittsburg and Antioch. One lane in each direction will be dedicated to HOVs. The project also includes ten miles of track in the center median for the eBART project. In addition to the eBART project, major interchanges under construction include Loveridge Road, Somersville Road, Lone Tree Way (Antioch and Oakley) and Balfour Road. Figure 11 shows the major areas under improvement.
Figure 11: Highway 4 Corridor Improvements21
4.2.2.2 Central County
Central County has several freeway improvements projects under construction or in planning phases.
- I-680 HOV Direct Access Ramps Project: This project studied HOV direct access ramps along I-680 in San Ramon; in March 2016 the San
Ramon City Council withdrew support for this project.
- I-680 Carpool Lane Completion: This project focuses on completing the southbound HOV lane between the Martinez-Benicia Bridge and the Contra Costa/Alameda County line. In the northbound direction, the gap between Livorna Road and State Route 242 is completed. The lane construction will occur separately, with opening expected in 2018.
21http://4eastcounty.org/projects/
Original PDF, page 59
Contra Costa Transportation Authority 2016 Express Bus Study Update
- I-680/State Route 4 Interchange Improvements: This project will increase the capacity of the I-680/SR 4 interchange by constructing a three level interchange:
- Phase 1 - northbound I-680 to westbound SR 4 connector.
- Phase 2 - eastbound SR 4 to southbound I-680 connector.
- Phase 3 - SR 4 widening between Morello Avenue and SR 242.
- Phase 4 - southbound I-680 to eastbound SR 4 connector.
- Phase 5 - westbound SR 4 to northbound I-680 connector.
4.2.2.3 West County
West County also has several major freeway operational improvements underway, including interchange efforts and the Integrated Corridor Mobility (ICM) Project.
- I-80 ICM Project: This Project is intended to address and attempt to relieve the congestion along the corridor by implementing an ITS that will improve travel time reliability and reduce accidents and associated congestion. ICM began operating in July 2016.
- I-80 San Pablo Dam Road Interchange Reconstruction: The effort to reconstruct the I-80/San Pablo Dam Road interchange is an effort to alleviate vehicular congestion and improve bicycle and pedestrian facilities.
- I-80/Central Avenue Interchange Modification: The project is aimed to improve traffic operations with improved signalized intersections and multiple electronic variable message signs to redirect I-80 westbound on- ramp traffic during weekend peak periods to I-580. The project is currently undergoing the approvals process.
4.2.3 Regional Express Lanes
The Metropolitan Transportation Commission (MTC) is spearheading a regional effort to develop a 550-mile network of Bay Area Express Lanes that will be completed in 2035. The express lanes are specially designated highway lanes that offer toll-free travel for HOVs, eligible clean air vehicles, and transit. Single occupancy vehicles (SOVs) will have the option to pay a toll in order to use the lane.
The express lanes are intended to capture the underutilized capacity of existing HOV lanes by allowing SOVs access to the lane after paying a fee. Overall, the express lanes will:
- Create a seamless network of HOV lanes to encourage carpools, vanpools and transit use;
- Make the best use of HOV lane capacity, provide drivers with the choice for a more reliable travel option; and
Original PDF, page 60
Contra Costa Transportation Authority 2016 Express Bus Study Update
- Better manage lanes to keep traffic moving.
Currently, express lanes are open on SR 237 between Milpitas and San Jose, and on I-580 between Dublin and Livermore. The express lane portion of I-680 in Contra Costa County is undergoing construction and toll testing, with Project 1 from San Ramon and Project 2 the southbound section from the Benicia Bridge to Walnut Creek to be completed by 2018. Currently unfunded, Project 3, which is the northbound section from the Benicia Bridge to Walnut Creek, does not have an opening date.
Project specifics include:
- Build express lanes between Rudgear Road in Walnut Creek and
Alcosta Blvd. in San Ramon by converting existing HOV lanes.
- Build southbound express lanes from the Benicia Bridge to Rudgear
Road in Walnut Creek by adding lanes and converting existing HOV lanes.
- Build northbound express lanes by adding and converting lanes from
North Main Street in Walnut Creek to the Benicia Bridge and implement operational improvements from Livorna Road to North Main Street in Walnut Creek.
Once complete, Project 1 and 2 will add five new lane miles and result in 35 miles of express lanes in Contra Costa County.
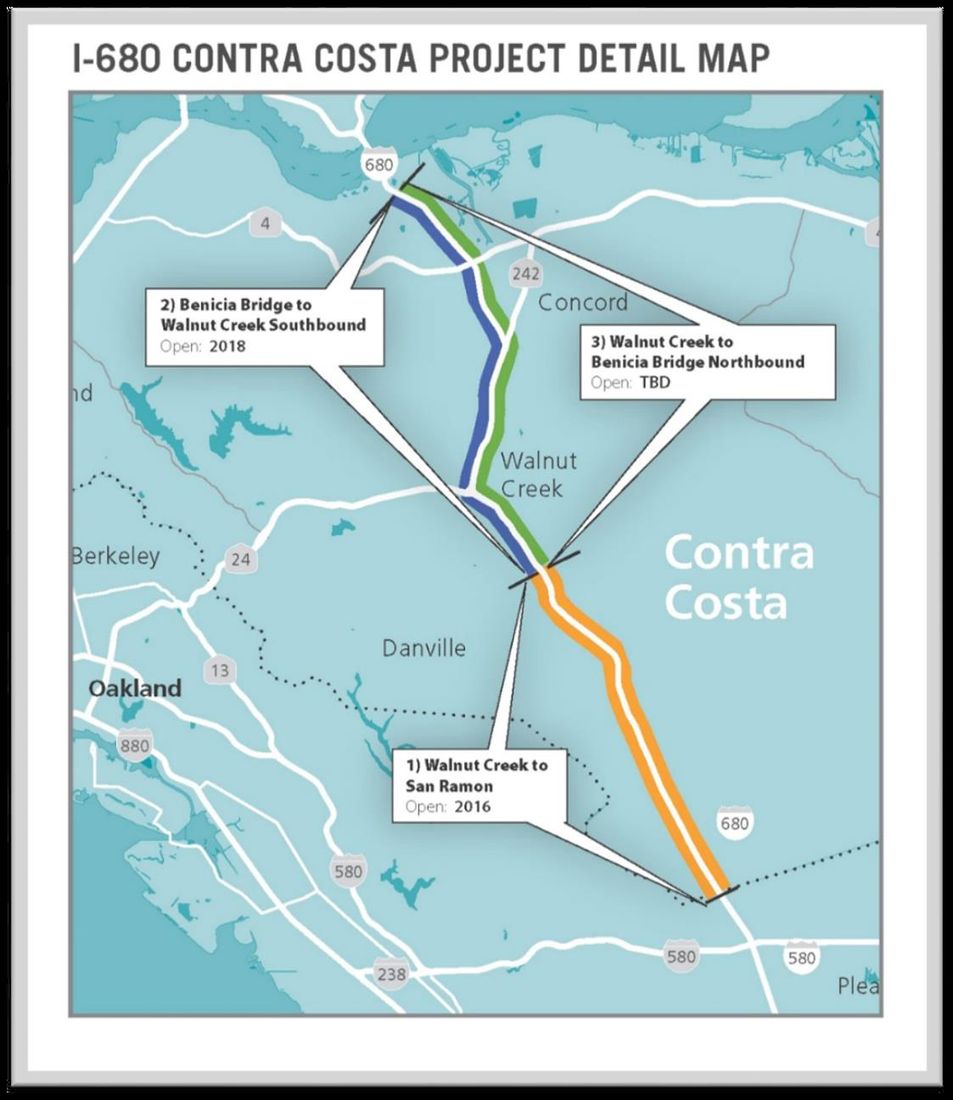
Original PDF, page 61
Contra Costa Transportation Authority 2016 Express Bus Study Update Figure 12: Express Lane Projects in Contra Costa County22 22 http://www.mtcexpresslanes.org/projects/express_lanes/projects/i680_contracosta_south.htm
| Transit | Vehicle Type | Quantity of | Purchase Year | ||||
|---|---|---|---|---|---|---|---|
| Operator | Vehicles | ||||||
| AC Transit | AC Transit | Urban Bus/ Commuter | 39 | 2017 | |||
| Tri Delta | Commuter | 9 | FY17, FY18 | ||||
| Transit | |||||||
| WestCAT | WestCAT | Commuter (double- deck) | 1 (with potential for more) | 2016 | |||
| County | No current replacement plans | ||||||
| Connection |
Contra Costa Transportation Authority 2016 Express Bus Study Update
4.3 Fleet Replacement Schedule
Of the four operators, AC Transit has the largest number of vehicles scheduled to be purchased for replacement. The agency’s most recent Short Range Transit Plan identified purchasing an additional 39 vehicles in 2017 to complement the vehicles purchased in 2013 and 2014. Tri Delta Transit is splitting an order for new buses between fiscal years 2017 and 2018. Following the double deck pilot program, AC Transit placed an order for 20 double deck buses (replacing existing over-the-road buses) and WestCAT has an option to order these vehicles once funding becomes available. County Connection recently received vehicles from its replacement schedule and has no near term plans to purchase more. Table 15 shows the vehicle replacement schedule for express buses.
Table 15: Express Bus Only Replacement Schedule
Original PDF, page 63
Contra Costa Transportation Authority 2016 Express Bus Study Update
Emerging Trends in Bus Transit
Fixed route transit – buses, trains and ferries – operate and relate to their markets primarily on a route level. Connection and coordination with a network, of which they are a part, is usually a secondary consideration, if at all. Disconnected networks, however, are fundamentally inefficient. As emphasized in a recent SPUR report,23 transportation networks should be as seamless as possible because people travel on networks, which happen to be built with routes.
The role technology and innovation has to improve the network operation is still evolving, as transit continues to exist as a combination of individual routes.
This section presents an overview of emerging trends in branding, recent technological developments, and ongoing/future innovations as they apply to express buses in Contra Costa County.
5.1 Branding
Clear brands resonate with riders and can convey large amounts of information through images, logos, or short catchphrases. Clear brands have also shown that riders view transit more positively than when there is no brand. In an increasingly crowded field of transportation services, transit agencies need to stand apart with a distinct brand. Express Bus is a strong candidate for distinct brands, as it is considered a unique service that would be attractive to specific riders and transit markets. Branding could help facilitate marketing by making it cheaper and more efficient. Branding linked with effective communications can help improve service overall and can point riders towards even more transit services. A distinct brand alone cannot make a service successful; it needs to be coupled with technology and continued innovation to ensure a route or network’s success.
For most transit agencies, branding a specific service is done when there is a unique route that, to the public, can stand apart from the rest of the network.
Typically one single agency controls a branded service. A branded express bus service for Contra Costa County, while not currently in existence, would face some unique challenges, including:
- Multiple Contra Costa County transit agencies delivering express bus service
- Each agency delivering other services in addition to express bus service
- Each agency operating within a distinct service area
23 Ratna Amin and Sara Barz, Seamless Transit
How to Make Bay Area Public Transit Function like One Rational, Easy-to-Use System, San Francisco, CA: SPUR (April 2015) http://www.spur.org/sites/default/files/publications_pdfs/SPUR_Seamless_Transit.pdf.
Original PDF, page 64
Contra Costa Transportation Authority 2016 Express Bus Study Update
- Many of the express bus lines connecting to BART, which is its own distinct service
5.2 Recent Technological Developments
Innovations in information technology allow transit agencies to bridge the gap between services and riders. Most visibly, real-time information provides trip updates, service alerts, and vehicle positions to current and potential riders.24 Such information improves passenger experience through sharing information, enhancing the perception of reliability, and facilitating informed choices about how and when to travel. Provided via apps and at transit stops, riders increasingly expect easy access to real-time information. Other technologies, such as vehicle- to-infrastructure and vehicle-to-vehicle communications, allow for greater connectivity among agencies, operators, and other service providers.
Electric transit vehicles appear to be generating more wide spread interest among operators as a viable vehicle option. Questions remain about battery lifecycle costs and everyday implementation, so entrants to the electric transit vehicle market will likely do so as pilot programs. Autonomous vehicle technologies remain more ambiguous and the case studies profiled in the report highlight specific autonomous elements intended to address current issues as opposed to pioneering new technology for the future. This reflects the emerging autonomous vehicle industry itself; as the technology for autonomous personal vehicles has not been widely adopted, autonomous technology for the transit industry is even less realized.
In Phase 2 of the CCTA Shared Autonomous Vehicle Pilot Program, French technology and transit firm EasyMile will test the autonomous shuttles after-hours and on the weekends on a quadrant of the Bishop Ranch campus, operating on private roads.
5.2.1 Real-time Information
Real-time information that provides transit status updates to riders is an increasingly available and expected service. The service can be provided via smartphone app or through displays at transit stops and stations. The information commonly includes estimated arrival times and service delays. Technology is now available to also include information such as vehicle tracking and seating capacity.
Relaying such information has tangible benefits. Riders who know transit status perceive their wait to be as much as 30% shorter, improving both the perception 24 Most real-time information is in the General Transit Feed Specification (GTFS) format. Static GTFS, or zipped text files containing scheduled operations, creates the foundation for transit trip planning. GTFS-realtime allows transit agencies to use a webserver to make binary files available to developers.
Original PDF, page 65
Contra Costa Transportation Authority 2016 Express Bus Study Update of reliability and the happiness of riders. Providing real-time information also reduces the actual wait-time of transit passengers by as much as 13% due to more optimal rider scheduling in coordination with the transit arrival time. Real-time information, if easily available and clearly understandable, can help attract reluctant riders to the system and retain them once they start riding.25 There are three primary methods for relaying real-time information to riders:
smartphone applications (“apps”), the operator website, and physical displays at transit stops and stations.
5.2.1.1 Apps
Smartphone apps are likely the most widely used platform. Many operators have let the app marketplace take the lead in developing apps providing real time transit information. Third party apps, whether developed for-profit or by an academic or non-profit organization, utilize information supplied by the operator (either static or real-time General Transit Feed Specification). Examples of commonly used transit information apps include Google Maps, NextBus, etc. Transit agencies have benefitted from the plethora of apps available to the public that distribute transit information to a wider audience than previously reached through more traditional methods, such as printed schedules. However, any informational errors or technical challenges associated with apps cannot be monitored nor fixed by the transit agency as they do not own nor control the various apps.26
5.2.1.2 Transit Stops and Stations
Transit stop/stations are a long standing source of real-time transit information with both printed and electronic schedule displays. Riders can generally receive the same level of real-time information at the transit stop/station compared to apps. Transit stops/station also typically display additional information, such as system maps or site specific maps and information. Real-time information displays at transit stops is becoming more inexpensive over time with e-ink and solar charging capabilities increasing the efficiency and decreasing the cost.27 Beyond real-time information displays at transit stops, technology has begun to delve into creating ‘responsive’ infrastructure. Such technology may be applicable for transit stops. Responsive transit stops could allow for a waiting rider to have increased lighting, alert a driver that a wheelchair passenger is waiting at a stop ahead, or notify a cyclist that more racks are available on a vehicle just following 25 Kari Edison Watkins, Brian Ferris, Alan Borning, G. Scott Rutherford, and David Layton, “Where is My Bus?: Impact of Mobile Real-Time Information on the Perceived and Actual Wait Time of Transit Riders,” Transportation Research Part A 45 (2011): 839-848.
26 Sean J
Barbeau, Alan Borning, and Kari Watkins, “OneBusAway Multi-Region: Rapidly Expanding Mobile Transit App to New Cities,” Public Transportation 17, no 4 (2014): 14-34.
27 K. Herbie Huff, Juan Matute, Agustin Garcia, and Doreen Zhao, “Transit Applications of Vehicle-to-Vehicle and Vehicle-to-Infrastructure Technologies,” Presented at the Transportation Research Board Annual Meeting, August 1, 2014 http://docs.trb.org/prp/15-4840.pdf.
Original PDF, page 66
Contra Costa Transportation Authority 2016 Express Bus Study Update the one approaching. Further research would need to be done in order to understand the cost/benefits of implementing responsive technology.28
5.2.2 Tech-enabled Transit Surveys
Transit surveys recently completed by the Contra Costa County operators provide insight on the growing role technology plays when delivering or sharing between the operators and the riders.
The 2013 Tri Delta Transit Communications Survey focused on understanding customer satisfaction with passenger notification and the mechanisms with how the information is delivered. The survey found that the preferred method for receiving transit information is on the bus, as opposed to other types of electronic or paper notification, such as flyers. Responses about email alert system awareness and usage were mixed, but fifty percent of surveyed customers have used the real time arrival feature on their mobile phones and a majority indicate satisfaction with the information. Slightly less than half of customers surveyed know they can follow Tri Delta Transit on Facebook and Twitter.
The 2014 WestCAT On Board survey found that riders ranked improved real time departure information as the third most important area for improvement, behind more frequent local service and more weekend service. The survey summary report noted that WestCAT riders were both interested in, and also frustrated by the current real time information system, surmising that the youthful and tech- savvy nature of the WestCAT rider base had high system expectations. The report also acknowledged that additional marketing and rider education may assist passengers in better utilization the current real-time information system.
Both AC Transit and County Connection conducted transit surveys, but neither included questions aimed at technology or real time information.
5.2.3 Real-time Information: Among Operators
Real-time information benefits riders, but also increasingly facilitates communications among operators. Real-time information can allow for dynamic routing, where the driver may deviate from the route in order to avoid congestion.
Routes using dynamic routing would require clear communication and education with the riders to understand how route deviation works. Real-time information may allow for maintaining headway adherence by en-route schedule adjustments.
With automatic vehicle locating, automated passenger counting, and real-time tracking of traffic conditions, effective spacing can be achieved during routes to augment scheduled spacing.29 While there are other operator benefits with real- 28 Huff et al., “Transit Applications of Vehicle-to-Vehicle,” 2014.
29 Huff et al
, “Transit Applications of Vehicle-to-Vehicle,” 2014; Cisco, “Cisco Connected Roadways Drives Safety, Efficiency, Mobility, and Sustainability” http://www.cisco.com/c/en/us/solutions/collateral/industry-solutions/solution-overview-c22- 733883.html.
Original PDF, page 67
Contra Costa Transportation Authority 2016 Express Bus Study Update time information, these applications could be transformative for the Express Bus system.
5.3 Ongoing and Future Innovation
Innovations in bus vehicle technology have progressed in the last decade. Bus vehicles have evolved to be cleaner, safer, and more efficient. Public buses have increasingly begun to transition to the use of alternative fuels. More than a third of all public transit buses in the US use alternative fuels30, while only about 17% of passenger cars are non-petroleum.31 The much publicized self-driving car also brings new possibilities to transit.
Opportunities for buses to become more automated, reduce errors and improve operator and passenger experience are only some of the outcomes that may emerge and bus technology advances. This section describes some of the new innovations currently being embraced by transit agencies as well as new opportunities that may be applicable to bus vehicles.
5.3.1 Alternative Fuel and Electric Buses
Alternative fuel vehicles are becoming increasingly common for public transit agencies in the United States. Compressed natural gas (CNG) is the most popular alternative fuel choice, with 18.6% of all transit buses in the U.S. using it.32 Hybrid electric and biodiesel vehicles are the next most common choice at 8.8% and 7.9%, respectively. In total, more than a third of all public buses use alternative fuels.33 Despite the increasing popularity of alternative fuel buses, true zero-emission (at the tailpipe) battery or hydrogen fuel cell propulsion vehicles have remained relatively rare. The added expense of the propulsion systems and charging or refueling stations along with the range restrictions of some technologies have combined to keep the implementation of zero-emission vehicles low. However, the list of zero-emission bus manufacturers is steadily growing, prices are declining, and state and federal funds for low and zero-emission vehicles are allowing more agencies to cover the higher costs.
30 Virginia Miller, “More than 25% of US Public Transit Buses Use Alternative Fuels or Hybrid Technology,” American Public Transportation Association, April 22, 2013 http://www.apta.com/mediacenter/pressreleases/2013/Pages/130422_Earth-Day.aspx.
31 United States Energy Information Administration, Annual Energy Outlook 2015: With Projections to 2040. United States Department of Energy.
http://www.eia.gov/forecasts/aeo/pdf/0383(2015).pdf. 32 The California Air Resources Board may be considering stricter standards on including CNG as a beneficial alternative fuel. Given that California is the largest market for buses in the US and also given that the majority of the state’s buses use CNG, such a standard change could have a significant impact on the bus market in the US. Nichola Groom, “California’s Push for Cleaner Buses Could Edge Out Natural Gas,” Reuters, July 2, 2015 http://www.reuters.com/article/2015/07/02/us-california-naturalgas-buses-insight- idUSKCN0PC0AV20150702.
33 Miller, “US Transit Buses,”2013
Original PDF, page 68
Contra Costa Transportation Authority 2016 Express Bus Study Update
5.3.2 Autonomous Vehicle Technologies
From the bumbling robot cars of the 2007 Defense Advanced Research Projects Agency (DARPA) Urban Challenge to the fully functioning self-driving cars of today, vehicle automation has become the most visible topic representing the next wave of innovation in the transportation sector. Automation drives popular conversation around transportation, with assumptions on radical changes in travel behavior and transportation choices. Ownership, for example, may no longer be necessary or desirable with automation. Instead, a person could simply call a car to make trips. Parking would become unnecessary, as vehicles would be constantly picking up and dropping off passengers. Eliminating private ownership could increase carsharing, decreasing the total number of vehicles needed.34 Conversely, fleet age and maintenance costs may decline since vehicles will be in constant use.
34 Robin Chase, “Will a World of Driverless Cars Be Heaven or Hell?” CityLab, April 3, 2014 http://www.citylab.com/commute/2014/04/will-world-driverless-cars-be-heaven-or-hell/8784/;
Ryan C.C. Chin, “Driverless Cars: The Future of Transport in Cities?” The Guardian, February 24, 2014 http://www.theguardian.com/sustainable-business/driverless-vehicles-future-car-sharing.
Original PDF, page 69
Contra Costa Transportation Authority 2016 Express Bus Study Update
Express Bus Recommendations
6.1 Service Scenarios
Express buses cover long distances via highways for a major portion of its route; some operate primarily between park-and-ride lots (in local communities and along highways, freeways, or expressways) and/or rail or bus stations (usually with park-and-ride lots), or as a hybrid service that combines highway based bus service bookended with local collector type bus service for greater passenger distribution and range.
The transit demand in the I-80 and I-680 corridors will likely lead to increased ridership because of existing and future demand. Additional service levels and corresponding ridership increases result from infrastructure investments and improving reliability by simplifying of routes in order to improve legibility and encourage ridership. A summary of the recommendations includes:
- Creating a blended service between operators in order to provide additional service in the I-80 and SR 4 corridors (Concord –Martinez—
Hercules—Richmond Parkway—San Francisco service)
- Utilizing the segment of Highway 4 between Pleasant Hill and Hercules as a corridor for complimentary service to BART
- Proposing service to new markets in the I-80 corridor (Emeryville and
Berkeley)
- Modifying and simplifying the I-680 routes to operate from north of
Walnut Creek, serve and run-through Bishop Ranch and terminate at the Dublin/Pleasanton BART station
6.1.1 I-80/Highway 4 Service Plan
The I-80 and Highway 4 corridor service plans are combined, reflecting service from Martinez to West County and Hercules Transit Center. The plan reaffirms the basic service pattern proposed in the 2001 Contra Costa Express Bus Study. The updated plan envisions that buses will enter the freeway stream at multiple points and then diverge at either El Cerrito del Norte BART, Berkeley, (continuing to Emeryville), or San Francisco (via the Bay Bridge and Transbay Transit Center). From a common point at Richmond Parkway two branches diverge north: one to Vallejo and the other to Hercules/Martinez/Concord. Some supplemental service starts at Richmond Parkway/Hilltop Mall. After funneling onto the freeway, most service terminates at El Cerrito del Norte, while some routes continue to San Francisco, and one route serves Berkeley/Emeryville. Table 16 provides route descriptions and Table 17 identifies a possible service pattern.
Original PDF, page 70
| Route | Current | Routing | ||||
|---|---|---|---|---|---|---|
| Designation | Route | |||||
| A | A | SolTrans Routte 80 | No Change | |||
| B (B1 and B2) | WestCat Lynx | Extended in Peak Hours (some, not all trips) to Concord via Martinez. In off-peak hours, every other trip extends from Hercules to Martinez. | ||||
| C (C1 and | WestCat J/JX | No Change | ||||
| C2) | ||||||
| D | D | AC Transit LA | No Change | |||
| E | New Route | From Hercules Transit Center to Emeryville |
Contra Costa Transportation Authority 2016 Express Bus Study Update For the purposes of illustration, a neutral nomenclature has been adopted to describe the various routes. Route A generally follows Soltrans Route 80, and Routes B and C includes variations (B1, B2, C1 and C2 respectively) on the current Lynx service, including extensions and frequency improvements. Route D is the LA route, and Route E is the new Berkeley/Emeryville service.
Table 16: Route Descriptions E New Route From Hercules Transit Center to Emeryville
Original PDF, page 71
| Service Pattern | Vallejo | Concord | Martinez | Hercules | Richmond Pkwy | Del Norte | Berkeley/ | Emeryville | San Francisco | Headway Peak | Headway Base | ||||||||||||||||||||||
|---|---|---|---|---|---|---|---|---|---|---|---|---|---|---|---|---|---|---|---|---|---|---|---|---|---|---|---|---|---|---|---|---|---|
| A | X | X | X | 10 | 15 | ||||||||||||||||||||||||||||
| B135 | X | X | X | X | X | 10 | - | ||||||||||||||||||||||||||
| B2 | X | X | X | X | 15 | ||||||||||||||||||||||||||||
| C136 | X | X | X | 6 | 12 | ||||||||||||||||||||||||||||
| C2 | X | X | X | 9 | 12 | ||||||||||||||||||||||||||||
| D | X | X | 10 | 15 | |||||||||||||||||||||||||||||
| E | X | X | X | 15 | 15 | ||||||||||||||||||||||||||||
| Peak | 10 | 10 | 10 | 2 | 1.5 | 2.5 | 15 | 5 | |||||||||||||||||||||||||
| Headway | |||||||||||||||||||||||||||||||||
| Base | 15 | - | 15 | 4 | 2.5 | 5 | 15 | 7.5 | |||||||||||||||||||||||||
| Headway |
Contra Costa Transportation Authority 2016 Express Bus Study Update Table 17: I-80/Highway 4 Proposed Service Pattern The I-80 “basic” route is an expanded Lynx service (noted as Route B). From the current foundation of Lynx operating every 20 minutes in peak periods between Hercules and San Francisco (and the semi-hourly midday service), both service frequency increases and also length increases (further into the county). In the peak, service operates every 10 minutes from Hercules, every 15 minutes from Concord, and every 15 minutes from Martinez. In the midday, service operates every 20 minutes from Hercules and hourly from Martinez.
35 Routes B1 and B2 are the same route
In the peak period, service is extended to Concord, connecting Concord with Martinez and San Francisco. Operating from Concord via I-80 is about the same time during peak hours as via Highway 24. This route incorporates the Lynx and 30z 36 Routes C1 and C2 are essentially the same route as the WestCat J route.
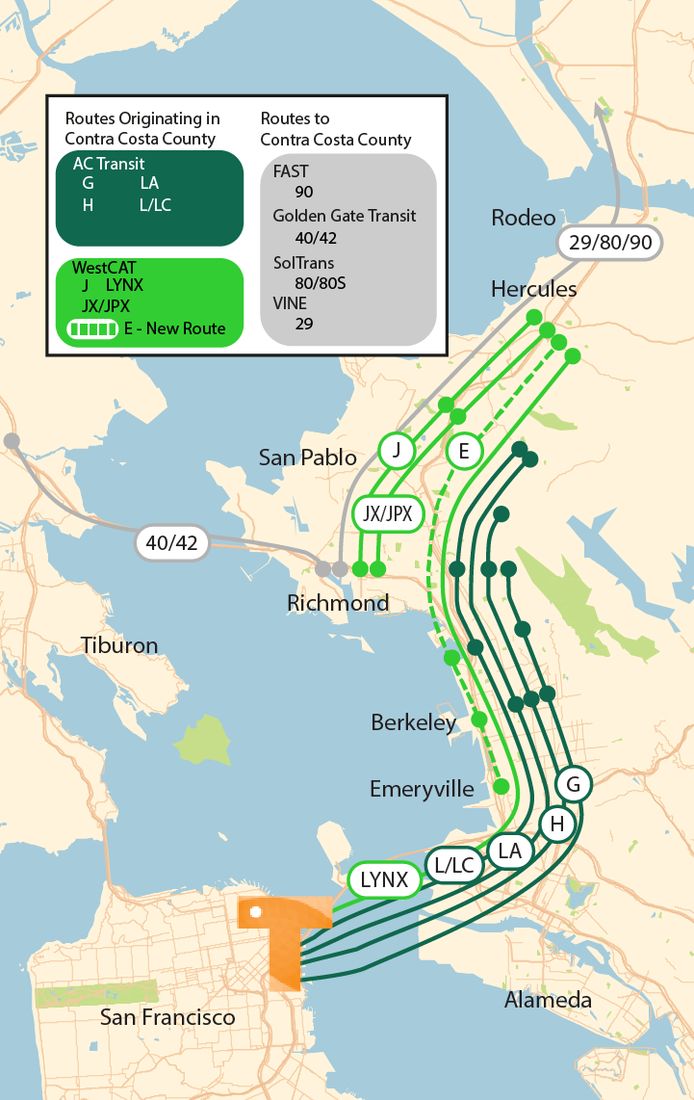
Original PDF, page 72
Contra Costa Transportation Authority 2016 Express Bus Study Update The TCI in the basic portion of the route (Hercules to San Francisco) is a strong 5,844. The proposed intra East Bay corridor (Hercules – Richmond Parkway – Richmond I-80 – Emeryville) is 221 assuming pricing and infrastructure investment. These infrastructure investments include dedicated bus ramps onto the freeway, queue jumps for HOVs and buses, and some limited application of in-line bus stations at important locations (I-80 Richmond, etc) consistent with the I-80 HOV lanes, Integrated Corridor Management system and the High Capacity Transit Study.
Figure 13 illustrates the proposed alignment for Route E Hercules - Emeryville. Figure 14 shows the alignment for Route B Martinez-Hercules-Emeryville.
Figure 13: Proposed Route E
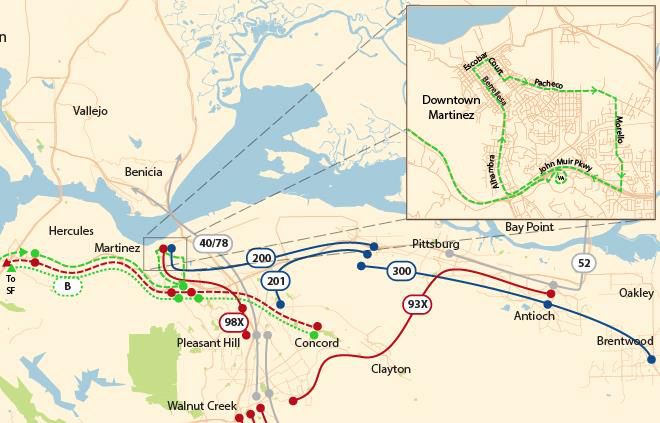
Original PDF, page 73
Contra Costa Transportation Authority 2016 Express Bus Study Update Figure 14: Proposed Route B
Contra Costa Transportation Authority 2016 Express Bus Study Update Routing through Martinez is designed to allow for a long, one-way loop that distributes and collects passengers at the same time. After exiting the freeway eastbound at Center Avenue, the route serves the Kaiser and VA Hospitals, and then operates via Highway 4 to Alhambra to Main Street, then to Pacheco and Morello and then returns via Highway 4 to Hercules. The one-way loop takes about 25 minutes.
In the long term, service levels and routings could be modified to reflect changing levels of demand and markets. In particular, if a new BART I-80 Richmond in-fill station is constructed37, this could provide an opportunity for an in-line bus station, eliminating the need to divert buses from the freeway to serve El Cerrito del Norte BART station saving travel time and allowing routes to extend to new markets, such as Emeryville, without the need for a dedicated route.
The routing concept is based on the premise that all express routes continue to converge onto I-80 as the main corridor alignment to San Francisco. This is reflected as the thick line shown in Figure 15. The thin lines that extend from the trunk portion (I-80) represent the individual routes alignments once the buses exit the freeways and begin their individual routes to their end destinations.
37 BART Vision Plan
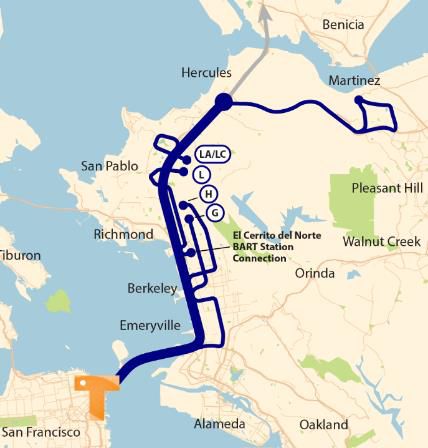
Original PDF, page 75
Contra Costa Transportation Authority 2016 Express Bus Study Update Figure 15: I-80 Routing Concept
680/High
way 4:
The I-680 corridor service plan has a slightly different approach than the service design for I-
- The corridor suffers from a combination of growing traffic congestion with an unrealized transit market. The transit market lacks enough access points– there are only a few opportunities to board the bus south of Walnut Creek BART station before arriving in San Ramon at Bishop
Ranch or after the Dublin/Pleasanton BART station in the northbound direction. If customers are not in the nearby vicinity of those existing stations, then the convenience to ride transit becomes less than traveling by auto.
TCI analysis indicates this is a strong potential corridor, when appropriate bus infrastructure improvements are provided. Already some select links between cities are transit competitive (i.e., Concord to Walnut Creek is almost 1,900), but a corridor TCI exceeds 150 when infrastructure or pricing are assumed.
The plan’s approach is to simplify the bus system, increase access points and increase service frequencies. This proposal creates a two branch option from the north, both of which feed into I-680 at Walnut Creek, and then continue on a common routing via I-680 to the Dublin/Pleasanton BART station. Each branch operates every 12 minutes in the peak, providing a common 6 minute service frequency from Walnut Creek south.
Original PDF, page 76
| Service Pattern | DVC/ | Sun Valley | PH BART/ | I-680 | Railroad Ave | Antioch | WC BART | Stone Valley | Diablo Road | Sycamore | Valley Rd | Bishop Ranch | (TBD) | Dublin BART | Headway Peak | Headway Base | ||||||||||||||||||||||
|---|---|---|---|---|---|---|---|---|---|---|---|---|---|---|---|---|---|---|---|---|---|---|---|---|---|---|---|---|---|---|---|---|---|---|---|---|---|---|
| X | X | X | X | X | X | X | X | X | 12 | 30 | ||||||||||||||||||||||||||||
| Y | X | X | X | X | X | X | X | 12 | 30 | |||||||||||||||||||||||||||||
| Headway | 12 | 12 | 12 | 6 | 6 | 6 | 6 | 6 | 6 | |||||||||||||||||||||||||||||
| Peak | ||||||||||||||||||||||||||||||||||||||
| Headway | 30 | 30 | 30 | 15 | 15 | 15 | 15 | 15 | 15 | |||||||||||||||||||||||||||||
| Base |
Contra Costa Transportation Authority 2016 Express Bus Study Update On I-680, buses operate in the shoulder during congested times, and make ramp stops at the following locations:
- Wayne/Buskirk/Treat
- Stone Valley Road
- El Cerro
- Sycamore Valley Road
- Bishop Ranch/Bollinger Canyon
Introducing a common routing ending at the Dublin/Pleasanton BART station eliminates the terminus point at the San Ramon Transit Center. This would require a change of policy, where County Connection has an operational agreement with the Bishop Ranch campus to provide service. This plan recommends that the I-680 trunk service directly provide access to the new City Center complex at Bishop Ranch (Bollinger Canyon Drive) where a community circulator would provide first/last mile circulation to the balance of the Bishop Ranch campus.
Wheels Route 70 would be merged with the new I-680 service to provide a more legible and also more efficient service. Table 18 identifies a possible service pattern and Table 19 describes the routes.
Table 18 : Proposed Service Pattern
Original PDF, page 77
| Route | Current | Routing | ||||
|---|---|---|---|---|---|---|
| Designation | Route | |||||
| X | X | CCCTA 92X, 95X, 96X + LAVTA Route 70 | From Diablo Valley College via Contra Costa Blvd, I-680, North Main Street, I-680, (Bishop Ranch Access TBD), I-580 to Dublin/Pleasanton BART. | |||
| Y | CCCTA Routes 93X/ 97X | From Railroad eBART via Kirker Pass, Ygnacio Valley Road, WC BART, I-680, (Bishop Ranch Access TBD), I-580 to Dublin/Pleasanton BART. |
Contra Costa Transportation Authority 2016 Express Bus Study Update Table 19: Route Descriptions Route X would have a running time of about 15 minutes from DVC to downtown Walnut Creek, about 25 minutes to Bishop Ranch, and 15 minutes to Dublin/Pleasanton BART, for a total of about 60 minutes. Route Y would have a running time of about 45 minutes from Railroad/Highway 4 to Walnut Creek BART, and then about 25 minutes to Bishop Ranch, and 15 minutes to Dublin/Pleasanton BART, for a total of about 90 minutes.
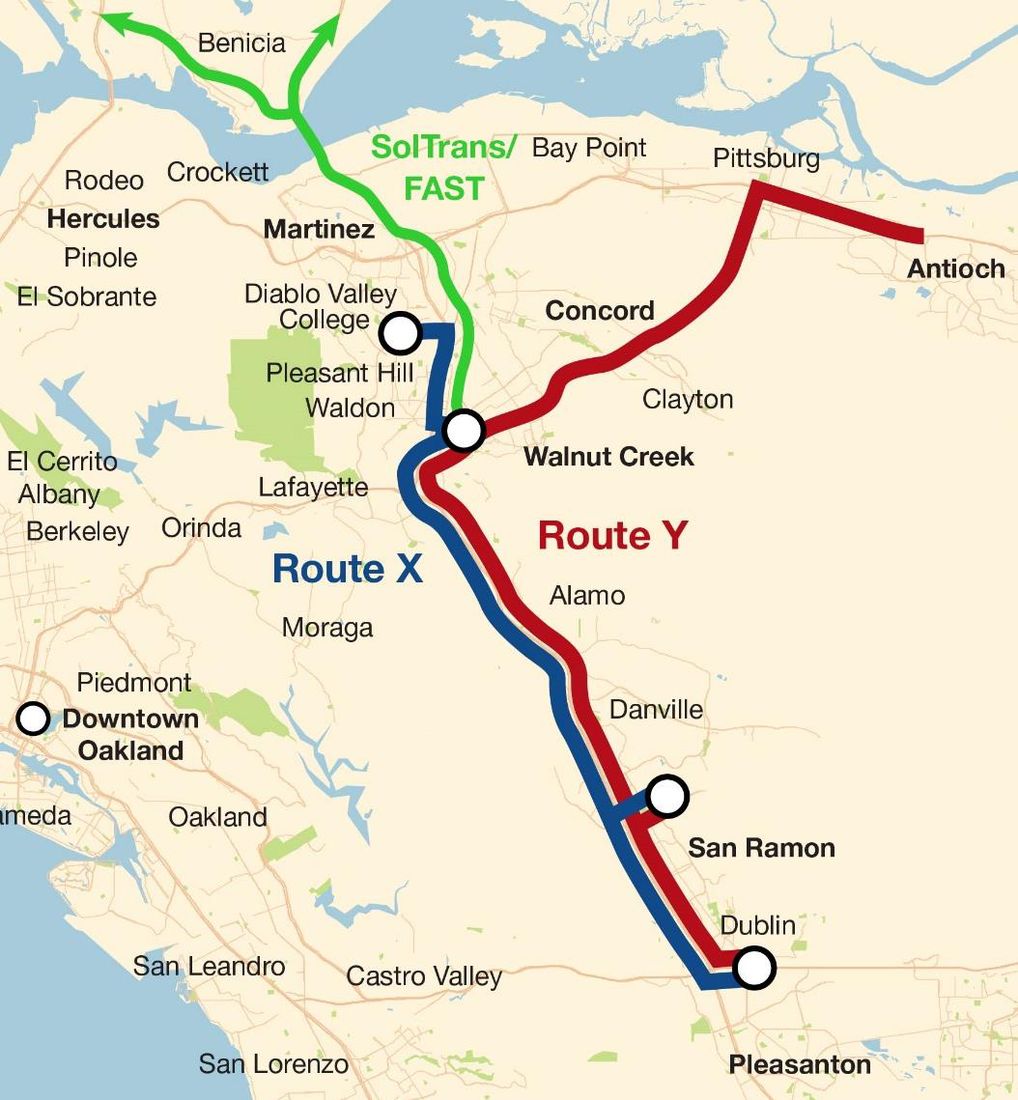
Original PDF, page 78
Contra Costa Transportation Authority 2016 Express Bus Study Update Figure 16: I-680 Corridor Proposed Routings In the traditional SR 4 Corridor between Concord and Brentwood, the advent of eBART significantly reduces the role of express buses. Tri Delta is considering only one route, linking Brentwood and Oakley to Antioch/Hillcrest.
Original PDF, page 79
Contra Costa Transportation Authority 2016 Express Bus Study Update
6.2 Express Bus Infrastructure
Every East Bay home location has a high transit competitiveness to downtown Oakland or downtown San Francisco. However, many jobs exist along the I-80 and I-680 corridors, which could be viable transit markets with infrastructure investments that provide increased access, faster travel times and better reliability.
6.2.1 I-80/Highway 4:
As a first step, the plan recommends the construction of a full HOV median ramp at Richmond Parkway to fully implement the proposed I-80 and Highway 4 service plan. This allows buses from the north (i.e., Westcat and SolTrans) to stop within the freeway right of way, enabling additional service to this node. In effect, Richmond Parkway service levels double or triple (and service is provided throughout the day, not just in the peak), for very little increased operating cost as the buses are already operating on the freeway. Currently, buses must exit to serve the park-and-ride facility adjacent to the freeway. With the full ramp, bus trip times are reduced, and while passengers will have a longer walk to their car, this can be minimized through a direct pedestrian crossing between the HOV ramp and the parking lot.
The second recommendation adds bus stops on exit ramps, with access to surface street park-and-ride locations. Bus stops on exit ramps keep buses on the freeway, reducing time spent traveling of off-freeway bus stations, but do require that buses navigate freeway lanes.
In practice, freeway stops should be located at about every-other interchange38, depending on traffic generators and land use attractions, as well as safety and other design constraints in order to mitigate how much weaving is required to operate between the HOV lane and the accessing the exit ramp. Other considerations should include existing and future transit routings and compatibility with adjacent land uses. In the I-80 Corridor, illustrative stops could include:
- Hercules (existing)
- Pinole Valley Road or Appian Way (long term)
- Central Avenue (conceptual long term)
- MacDonald Ave/I-80 (consistent and collaborative with BART Vision in-fill station)
These stops (as examples) could add additional access point for passengers in a dense corridor that has demonstrated a strong demand for transit.
38 Pursuant TCRP 145 Recommendations
Original PDF, page 80
Contra Costa Transportation Authority 2016 Express Bus Study Update In the long term, median stations – likely provided by HOV drop ramps – would ideally be provided as part of normal freeway interchange renewal projects at Pinole Valley Road and Central Avenue. In the event an infill BART station is developed at I-80 in Richmond, the plan recommends considering pairing the BART station with an in-line bus station, allowing almost direct passenger access to BART while keeping buses in the freeway right-of-way. This will reduce delays and increase passenger utility. If this station were to be delivered, many of the I-80 bus routes that now terminate at El Cerrito del Norte39 could be effectively extended to Emeryville (and other I-80 adjacent job centers with 20,000 to 30,000 jobs). The extension envisioned is about seven miles long, half of which is on the freeway (to the I-580 MacArthur exist, then northbound on Horton, 59th, Hollis to 65th and then via Shellmound to I-80). This infrastructure and the routing allows buses to serve both BART and the Emeryville market, taking about additional 10 minutes in each direction to serve Emeryville.
6.2.2 I-680/Highway
The I-680 Transit Investment Congestion Relief Options Study recommended express bus shoulder operations. Transit vehicles cannot currently operate in the shoulders of the freeways. Current law allows only two central California transit agencies, with approval from the California Highway Patrol, and ultimately the state Department of Transportation, to operate buses on the shoulder. This plan recommends that the county and region continue to work with the state and relevant state agencies or allow for, at minimum, testing of bus on shoulder operations. A desk survey of the shoulder width through the I-680 corridor suggests that there is currently sufficient right of way to accommodate buses operating in the shoulder.
While “carte blanche” bus on shoulder operations is not currently allowed in California, the State of Minnesota provides a clear case study where express buses are allowed to operate on shoulders when traffic is flowing at less than 20 miles per hour. Operations has been deemed to be successful, with acceptance of the practice the result of close coordination between the transit agency, state department of transportation and highway patrol to develop a model program for service operations.
39 For more analysis on BART infill stations in West County, please visit http://westcountytransitstudy.com/
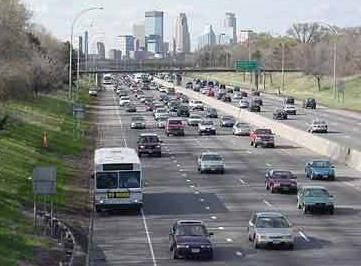
Original PDF, page 81
Contra Costa Transportation Authority 2016 Express Bus Study Update Figure 17: Twin Cities Bus-on-Shoulder The study also recommended additional park-and-rides, with specific locations to be determined. Building on these recommendations, the plan calls for a number of new bus stop on ramp locations, including:
- Pacheco Transit Center (served by SolTrans)
- Willow Pass/Sunvalley
- Wayne/Buskirk/Treat
- Stone Valley Road
- El Cerro
- Sycamore Valley Road
- Bollinger Canyon (bus access into Bishop Ranch/San Ramon City Center)
Future park-and-ride facilities at Stone Valley are proposed, but not required for early implementation. Implementing direct pedestrian access from the stop locations, to the street and adjacent business districts are an early action item.
As discussed in Section 7.1.2, the plan recommends bus access into Bishop Ranch at Bollinger Canyon. The concept provides a common routing network for express bus routes serving the corridor between Walnut Creek BART station and Dublin/Pleasanton BART station. At Bollinger Canyon, buses would directly access City Center, and would connect to circulator buses for other “last-mile” connections.
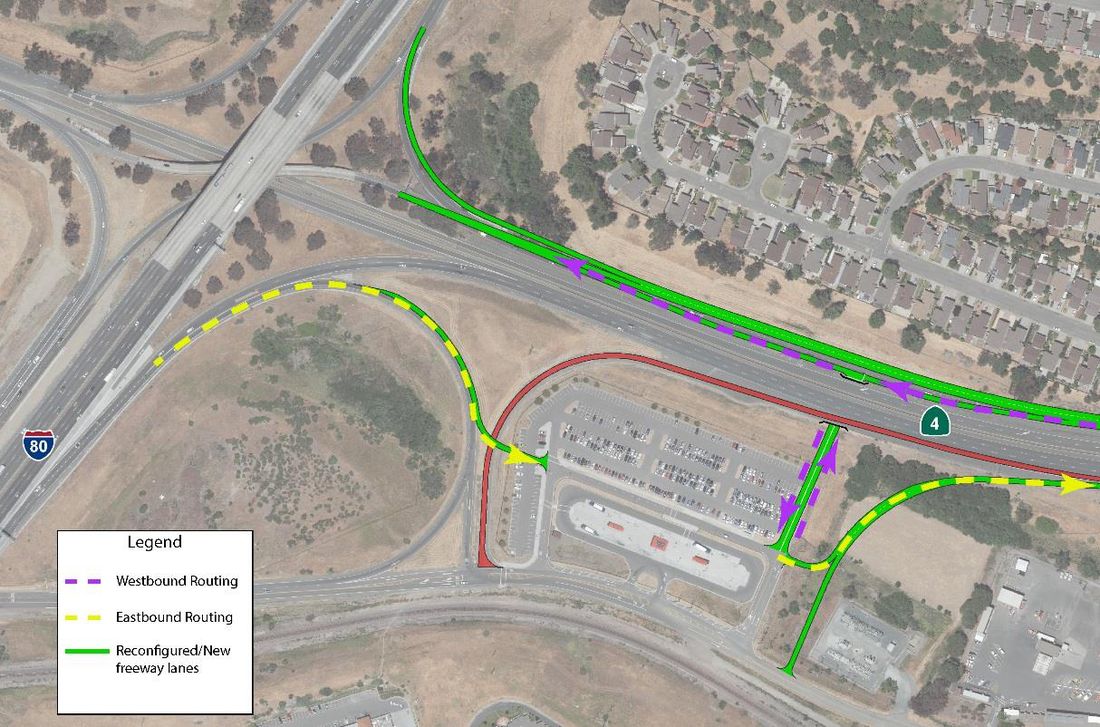
Original PDF, page 82
Contra Costa Transportation Authority 2016 Express Bus Study Update
6.2.3 Highway
The recommendations for Highway 4 center around improving the circulation and access to the Hercules Transit Center and implementing bus stops on ramps to support the new route between Concord/Martinez/Hercules/San Francisco.
On the Highway 4 Corridor, bus stops on ramps would be located on:
- Morello Road
- Alhambra Valley Road
The plan recommends redesign of the Hercules Transit Center to provide direct access in all directions to the freeway system. Figure 18 illustrated the proposed illustrative improvements, which include a bus-only flyover from Highway 4 in the westbound direction directly into the transit center. The entrance from Highway 4 in the eastbound direction would be modified to allow for bus-only direct access from the ramp, moving auto ingress and egress to the east of the transit center.
Figure 18: Hercules Transit Center
Original PDF, page 83
Contra Costa Transportation Authority 2016 Express Bus Study Update
Cost Estimates
7.1 Vehicles
The default Bay Area express bus vehicle has been the over-the-road bus, nominally seating about 55 passengers. These buses are comfortable and have good ride quality, however, due to their high floor (four steps into the passenger compartment) they are very slow to board (up to 8 seconds per passenger with cash and about half that with Clipper), and not designed for rapid boarding/ alighting at the same stop. In central Contra Costa, CCCTA typically uses “suburban” low-floor 40 foot buses.
In 2015, AC Transit tested a “low-profile” low floor double deck bus (conforming with Buy America rules) on several Transbay routes, noting positive aspects, including high capacity (more than 70 seats), passenger acceptance, and faster boarding and alighting, and faster wheelchair and disabled boarding. These findings confirm the experiences of Toronto and metro Seattle, where the transit authorities have begun purchasing double deck buses for freeway express bus services. The capital cost difference – controlling for the number of seats – between an over-the-road bus and a double deck bus is not significant.
7.2 Cost and Benefits
7.2.1 I-80/Highway 4 Service
Table 20 provides the expected range of costs for the proposed services.
Original PDF, page 84
| Route Designation | Current Route | Current | Proposed | Change (+) | Additional Vehicles Needed | Estimated Additional Cost40 | ||||||
|---|---|---|---|---|---|---|---|---|---|---|---|---|
| Weekday | Weekday | |||||||||||
| Vehicle | Vehicle | |||||||||||
| Hours | Hours | |||||||||||
| A | SolTrans Rte 80 | 61 | 70 | 9 | 0 | $0 | ||||||
| B (B1 and | WestCat Lynx | 65 | 150 | 85 | 12 | $9.6M | ||||||
| B2) | ||||||||||||
| C (C1 and | WestCat J/JX | 100 | 100 | 0 | 0 | $0 | ||||||
| C2) | ||||||||||||
| D | D | AC Transit LA | 40 | 100 | 60 | 6 | $4.8M | |||||
| E | New Route | N/A | 60 | 60 | 5 | $4M | ||||||
| TOTAL | 214 | 23 | $18.4M |
Contra Costa Transportation Authority 2016 Express Bus Study Update Table 20: Estimated Increase in Service Hours and Vehicle Needs – I- 80/Highway 4 40 Assumes a double deck bus, at $800,000 per bus
| Route Designation | Current Route | Current | Proposed | Change (+) | Additional Vehicles Needed | Estimated Additional Cost41 | ||||||
|---|---|---|---|---|---|---|---|---|---|---|---|---|
| Weekday | Weekday | |||||||||||
| Vehicle | Vehicle | |||||||||||
| Hours | Hours | |||||||||||
| X | CCCTA 92X, 95X, 96X + LAVTA Route 70 | 70 | 109 | 39 | 7 | $5.6M | ||||||
| Y | CCCTA Routes 93X/ 97X | 24 | 168 | 143 | 8 | $6.4M | ||||||
| TOTAL | 182 | 15 | $12M |
Contra Costa Transportation Authority 2016 Express Bus Study Update
7.2.2 I-680 Service
The expected range of costs for the proposed services, shown in hours, is in Table 21. Table 21: Estimated Increase in Service Hours and Vehicle Needs – I-680 Assuming a cost per hour ranging from $118 to $180 depending on the operator, and a farebox recovery ranging from 40% to 65% depending on route, the additional annual net operating cost of weekday service in both the I-80/SR 4 and I-680 corridors combined is estimated at about $30 million.
41 Assumes a double deck bus, at $800,000 per bus
Original PDF, page 86
| Infrastructure | Project/Location | Cost Estimate Range | |||||
|---|---|---|---|---|---|---|---|
| Improvement | Low High | ||||||
| I-80 Corridor | |||||||
| Transit Center | Hercules Transit Center | $28 million | $61 million | ||||
| Redesign | |||||||
| HOV Ramps | HOV Ramps | Richmond Parkway | $16 million | $34 million | |||
| In-Line Stations | Location TBD | N/A | N/A | ||||
| Park and Ride | Park and Ride | Pinole Valley Road or Appian Way42 | TBD | TBD | |||
| I-680 | |||||||
| Bus Stops on Ramps | Bus Stops on | Stone Valley Rd El Cerro Sycamore Valley Road | $2.0 million (each) | $4.5 million (each) | |||
| Ramps | |||||||
| Transit Priority | Ygnacio Valley Road | $2.5 million | $7.5 million | ||||
| (queue jumps, | |||||||
| signal priority, | |||||||
| etc) | |||||||
| Stations | Stations | Bishop Ranch | $2.0 million | $5.0 million | |||
| Highway 4 | |||||||
| Bus Stops on | Morello Alhambra | $2.0 million (each) | $4.5 million (each) | ||||
| Ramps | |||||||
| Park-and-rides | Morello/Alhambra | $3.0 million | $6.0 million | ||||
| Vehicles | |||||||
| Additional Buses | 40 | $35 million | $40 million |
Contra Costa Transportation Authority 2016 Express Bus Study Update
7.2.3 Infrastructure Costs
The summary of infrastructure costs for all corridors is shown in Table 22. Table 22: Summary of total Infrastructure Costs Additional Buses $35 million $40 million 42 A new park and ride at Pinole Valley Road or Appian Way would be subject to discussion with the City of Pinole. No cost estimates are provided at this time.
Original PDF, page 87
Contra Costa Transportation Authority 2016 Express Bus Study Update
Implementation
The implementation of 35 to 40 additional express buses – and almost 400 additional hours of daily service – suggests these increases will be delivered in phases, perhaps keyed with infrastructure improvements.
Availability – service frequencies, span-of-service and access to stops and stations
- is a key consideration for successful implementation. Of these, stop and station access – including placement and park-and-ride availability – is the most challenging. Due to high costs, this study notes that additional parking development will likely be needed, but does not specifically identify potential parking locations or amounts needed.
However, access needs to be provided. This can be done by locating stops and stations where people can walk (somewhat difficult in suburban locations), building large parking structures (expensive, with additional local impacts of traffic), or distribute the parking through development of a series of stops and stations and smaller parking provisions, either through smaller surface lots or even on-street parking, to accompany these new stations.
In the I-80 Corridor, the Hercules park-and-ride location and Richmond Parkway Transit Center are anchor facilities. Hercules can accommodate the recommended service changes, although eventually additional parking will be necessary, coupled with further access improvements to facilitate faster transit service.
At Richmond Parkway, additional service could be keyed to additional park-and- ride facilities and the addition of the full median ramps (allowing buses from the north to make a stop without a five minute diversion). A project to develop a parking structure on-site was not pursued, but opportunity remains to negotiate with current surrounding land owners to lease additional parking supply within the immediate vicinity of the station area.
In the I-680 corridor, service changes could be keyed to “bus-on-shoulder” operation and at least one ramp stop, and dedicated access at Bishop Ranch.
These changes should be sufficient to allow for successful operation. Table 23 summarizes a three-phase approach to implementing both service and infrastructure improvements by corridor.
Original PDF, page 88
| Corridor | Service | Phase | Infrastructure Improvement | Additional | ||||
|---|---|---|---|---|---|---|---|---|
| Improvement | Vehicles | |||||||
| I-80 | Lynx Extension to Martinez | 1 | None initially | Yes | ||||
| 2 | Park-and-ride @ Morello; Park- and-ride @ Alhambra | Yes | ||||||
| 3 | New dedicated ramp into Hercules Transit Center | |||||||
| Additional Lynx Service | 1 | Park-and-ride @ Pinole Valley Road or Appian Way | Yes | |||||
| Lynx/Soltrans/AC Transit Service to Richmond Parkway | 1 | Additional surface parking at Richmond Parkway (shared with shopping center) New ramps – I-80 @ Richmond Parkway, north side | Yes | |||||
| New Service Hercules to Emeryville | 1 | None | Yes | |||||
| 3 | BART Station @ I-80/MacDonald I-80/Central Avenue In-Line Station | Yes | ||||||
| I-680 | Consolidated 2 Route Service/ Antioch/DVC to Walnut Creek/San Ramon/Dublin BART | 1 | “Bus-on-Shoulder” New Ramp Stops I-680 Bishop Ranch Station/Shuttle System | Yes | ||||
| Additional Service | 2 | Additional I-680 ramp stops | Yes | |||||
| SR 4 | Realigned Service/Reduced | 1 | eBART implementation | No |
Contra Costa Transportation Authority 2016 Express Bus Study Update Table 23: Express Bus Recommendations by Phase
Contra Costa Transportation Authority 2016 Express Bus Study Update
8.1 Proposed Performance Benchmarks
Contra Costa County and the region will likely continue to see increased population growth and accompanying demand for travel, so improving and expanding the express bus services will become a necessity rather than a luxury.
County, regional, and state monies will continue to be highly competitive, and future proposed projects will need to be seen as valuable and worthy of garnering scarce resources. While the individual operators that provide express bus service in Contra Costa County use performance benchmarks when measuring their service, there currently does not exist a set of benchmarks that encompass all the express services as a holistic network. One way for express bus to distinguish itself from the multitude of other transportation projects is to clearly define a cohesive countywide network. Developing one set of benchmarks will not only help overall performance monitoring, but can provide additional support for future improvement projects within the competitive funding environment.
The benchmarks proposed in Table 24 are a starting point for discussions on what could be the appropriate metrics to accomplish the goals and outcomes described above.
Original PDF, page 90
| Performance | Description | Evaluation Standard | |||
|---|---|---|---|---|---|
| Metric | |||||
| Service Quality | |||||
| On Time Performance | On Time | Operate actual transit services as a percentage of scheduled transit or service times at key time points | Operate X% of scheduled bus on-schedule (as defined) X% of the time for bus. | ||
| Performance | |||||
| Service Performance – Effectiveness | |||||
| Passengers per trip | Passengers | Total number of passengers per one-way trip | Passenger totals above the seated vehicle capacity indicates additional capacity may be needed; less than a predetermined number of total passengers may indicate route adjustments may be needed. | ||
| per trip | |||||
| Passenger per revenue vehicle hour | Average number of passengers being carried during an hour of service. | A high value indicates that a route is being well used; very high values indicates that additional service is warranted to provide more capacity. A low value indicates that a route is under performing and less service may be required or additional marketing or passenger education. | |||
| Passenger per revenue vehicle miles | Average number of passengers being carried for every mile of service | A high value indicates that a route is being well used; very high values indicate that additional service is warranted to provide more capacity. A low value indicates that a route is under performing and less service may be required. | |||
| Peak corridor demand | The value of hourly demand over vehicle capacity | Ensuring that ridership demand during the peak periods and at the maximum load point along the corridor meet a predetermined standard, such as not too many standees. | |||
| Capacity | The value of passenger miles over seat miles | Ensuring that seats are filled for an average percent standard | |||
| Utilization | |||||
| Service Performance - Efficiency | |||||
| Cost per | Average cost to operate transit service for every hour of service | A higher value indicates a high cost to provide service. | |||
| revenue | |||||
| vehicle hour | |||||
| Cost per | Average cost to operate transit service for every mile of service | A higher value indicates a high cost to provide service could indicated abnormally slow speeds. | |||
| revenue | |||||
| vehicle mile | |||||
| Cost per seat | Average cost to operate transit for every seated mile in service | A higher value indicates a higher cost to provide service and provides a comparable | |||
| mile |
Contra Costa Transportation Authority 2016 Express Bus Study Update Table 24: Proposed Performance Benchmarks
| Performance | Description | Evaluation Standard | |||
|---|---|---|---|---|---|
| Metric | |||||
| basis for evaluating different transit modes. | |||||
| Blended Metric | |||||
| Subsidy per passenger | Subsidy per | Measures the amount of expenses not covered by revenue for every passenger boarding. | Lower rates indicate that a route may be more self-sufficient in terms of generating fare revenues than routes with higher rates. The subsidy typically varies depending on the ridership levels for each route and the fare charged. The higher the ridership on a route, the lower the subsidy required per passenger. | ||
| passenger | |||||
| Revenue per revenue seat mile (Farebox recovery ratio) | Measures the revenue per seat received to provide service. Provides revenues in dollars. Farebox recovery provides ratio of fare revenue to operating costs. | No industry standard as revenues must be compared to operating costs per seat mile. The closer the two figures are the less expensive the service is to operate. |
Contra Costa Transportation Authority 2016 Express Bus Study Update
Summary
Increased bus service can be supported on I-80 and I-680 because of existing and future demand, but requires infrastructure investments and simplifying of routes in order to improve legibility and encourage ridership. A summary of the plan includes:
- Creating a blended service between operators in order to provide additional service (Concord – San Francisco service)
- Proposing service to new markets (Emeryville and Berkeley)
- Modifying the I-680 routes to begin in Concord and Antioch, serve San
Ramon/Bishop Ranch, and terminate at the Dublin/Pleasanton BART station
- Utilizing the segment of Highway 4 between Pleasant Hill and Hercules as an corridor for complimentary service to BART
Advancing improved express bus service in Contra Costa County will require exploring and expanding bus improvements that have not been in widespread use in the region. These include bus on shoulder operations, bus on ramp stations and in-line stations. The different network corridors, I-80, I-680 and Highway 4 in addition have somewhat unique and distinct needs to fulfill in order to deliver improved express bus service. For I-80, this includes continued importance of managing freeway congestion and increasing transit access along the corridor. In I-680, parking management and increasing parking supply are key factors to
Original PDF, page 92
Contra Costa Transportation Authority 2016 Express Bus Study Update improving transit access. Along Highway 4, accommodating expected eBART demand and expanding the park and ride network will be important aspects to expanding transit mobility.
Overall, working with local, regional and state jurisdictions and government agencies will continue to be a critical component to expanding and improving express bus service. These relationships will be the foundation for gaining support for infrastructure improvements that, in other locations around the county, have shown that express bus service can become more than a niche transit service and instead be a critical link to a county or region’s transportation network.
Original PDF, page 93
Appendix A
Express Bus Funding Sources
Contra Costa Transportation Authority 2016 Express Bus Study Update Page A89 While the funding for the existing express bus services is stable, current sources are not expected to result in a significant revenue surplus. Therefore, in lieu of changes to existing services within each agency, expanding express bus services would likely require new funding sources.
A few of these sources are relatively new funding programs that have not yet been applied to Contra Costa’s express bus network. Others would require legislative and/or voter approval to be implemented. For each funding source, the “Level of Difficulty to Implement” does not equate to the ability of each project to obtain funds, which is often a highly competitive process; rather, it reflects the requirement for legislative or other approval requirements that could complicate the accessibility of funds.
Original PDF, page 95
| Source | Description | Eligi ble Uses | Type of Appro vals | Difficulty of Impleme ntation | Implemen tation Timefram e |
|---|---|---|---|---|---|
| Federal | |||||
| FTA Section 5309 Small Starts | The Federal Capital Investment Program provides funds for construction of new fixed guideway systems or extensions to existing fixed guideway systems and, as amended by MAP-21, projects that will expand the core capacity of existing fixed guideway corridor. The Small Starts program includes corridor-based bus rapid transit systems that do not operate on a separate fixed guideway but include features that emulate the services provided by rail fixed guideway including defined stations, traffic signal priority for public transit vehicles, and short headway bi- directional services for a substantial part of weekdays and weekend days. Small Starts projects must have a total net capital cost of less than $250 million and seek a federal share of less than $75 million. Projects become candidates for funding under this program by successfully completing steps in the process defined in section 5309 and obtaining a satisfactory rating under the statutorily-defined criteria. For Small Starts projects the steps in the process include project development and construction. It often takes many years to obtain New Starts/Small Starts funds due to the grant program’s complexity and over prescription of the fund source. | Capi tal | FTA approv al of applica tion | Medium | Existing program, application process less than 5 years from project identificati on |
| State | |||||
| Cap & Trade: Transit Operating and Efficiency Program | Funds are to be distributed by a formula that provides 40% to core capacity transit operators (AC Transit, BART, and SFMTA) and 60% to the remaining transit operators, based 50% on total ridership, 25% on low-income ridership and 25% on minority ridership. Funding is subject to each operator submitting qualifying projects for funding through a competitive selection process. Based on the size of | Capi tal Oper ating | CMA and MTC approv al of applica tion | Easy | Existing |
Contra Costa Transportation Authority 2016 Express Bus Study Update Page A90
| Source | Description | Eligi ble Uses | Type of Appro vals | Difficulty of Impleme ntation | Implemen tation Timefram e |
|---|---|---|---|---|---|
| the funding pot and the program’s goals to address greenhouse gas reductions in disadvantaged communities, this program may be limited in its ability to generate significant revenue within the area for the smaller operators. | |||||
| Cap & Trade: Transit and Intercity Rail Capital Program | The Transit and Intercity Rail Capital Program is a statewide competitive program to fund capital and operational improvements to modernize California’s transit systems and reduce emissions of greenhouse gases. The California State Transportation Agency (CalSTA) is responsible for the overall administration of the program, including project evaluation and the development of a program of projects. MTC does not have a formal role with the program, but has provided guidance to focus the Bay Area’s list of projects in line with adopted regional policy and funding commitments. MTC has indicated its preference to fund Core Capacity Challenge Grant projects in the initial funding cycle. | Capi tal Oper ating | CMA and MTC approv al of applica tion | Easy | Existing |
| STIP/RTI P | The STIP is a multi-year capital improvement program of transportation projects on and off the State Highway System, funded with revenues from the State Highway Account and other funding sources. The STIP is composed of two sub-elements: the Regional Transportation Improvement Program (RTIP) and the Interregional Transportation Improvement Program (ITIP). As the Regional Transportation Planning Agency (RTPA) for the Bay Area, MTC is responsible for developing regional project priorities for the RTIP for the nine counties of the Bay Area. County CMAs are responsible for developing their county's program of projects. The biennial RTIP is then submitted to the California Transportation Commission for inclusion in the STIP. The California Department of Transportation (Caltrans) is responsible | Capi tal | CMA, MTC, and CTC approv al of compet itive applica tions | Easy | Existing program, new funds available in 5 – 10 years |
Contra Costa Transportation Authority 2016 Express Bus Study Update Page A91
| Source | Description | Eligi ble Uses | Type of Appro vals | Difficulty of Impleme ntation | Implemen tation Timefram e |
|---|---|---|---|---|---|
| for developing the ITIP. These funds are at historic lows and are generally fully programmed through the 5-year STIP horizon year. In the 2014 STIP, Contra Costa’s programmed projects exceed the county’s available revenue by $10 million. | |||||
| Regional / Local | |||||
| OBAG | MTC’s OBAG Program was developed to address California's climate law, and integrates multiple funding sources under one allocation approach. Each county Congestion Management Agency (CMA) may program OBAG funds to projects that meet the eligibility requirements of any one of the following six transportation improvement categories: Local Streets and Roads Preservation, Bicycle and Pedestrian Improvements, Transportation for Livable Communities, Safe Routes to School, Priority Conservation Areas, Regional Planning, and Bus and Rail Transit Rehabilitation. The OBAG program rewards counties that plan for and produce affordable housing. MTC receives federal funding for local programming under the OBAG program through the State from federal surface transportation legislation. This includes Surface Transportation Program (STP), Congestion Mitigation and Air Quality Improvement (CMAQ) and Transportation Alternatives (TA) Program funds. Other funding sources include Cap and Trade, Regional Transportation Improvement Program (RTIP), and Transportation Fund for Clean Air (TFCA) funding. Contra Costa County’s OBAG Cycle 2 projects are primarily streets and roads projects, as well as some bike and pedestrian improvement projects. The Regional OBAG funding categories include Freeway Performance Initiative, Transit Performance Initiative, and Priority Development | Capi tal | CMA and MTC approv al of compet itive applica tions | Easy | Existing program, new funds available in less than 5 years |
Contra Costa Transportation Authority 2016 Express Bus Study Update Page A92
| Source | Description | Eligi ble Uses | Type of Appro vals | Difficulty of Impleme ntation | Implemen tation Timefram e |
|---|---|---|---|---|---|
| Area planning and implementation. These types of funds could complement express bus projects in Contra Costa County. | |||||
| Program for Arterial System Synchroni zation (PASS) | MTC has packaged Federal funds into the PASS program to provide technical assistance to help Bay Area agencies improve traffic signal timing plans as a low-cost way to improve the safety and efficiency of arterials in the region. The program is open to cities and counties, and includes services that can help design and implement transit signal priority plans, traffic responsive timing plans, special timing plans for major events, etc. Applicants must justify the need and benefits of these additional timing plans, such as increased bus service using the corridors. | Capi tal | MTC approv al of applica tion | Easy | Existing |
| Express (HOT) Lanes | Express lanes are specially-designated highway lanes that offer toll-free travel for carpools, vanpools, motorcycles, buses and eligible clean-air vehicles. Solo drivers also have the choice to pay to use the lanes for reliable travel times. The revenue from the regional express lane network is included in MTC’s Plan Bay Area to fund the operations, maintenance, rehabilitation and capital financing of the network.43 Express lanes on I-80 and I-680 in Contra Costa County are planned for near-term (by 2020) and mid-term (by 2025) implementation. While the express lanes may not generate revenue for the operations and capital needs of the express bus services, the program’s implementation may improve travel times for some express bus routes, thereby reducing operating costs and potentially increasing ridership and fare revenues. | Pote ntial oper ating cost redu ction s | None for transit agency ; benefit s may or may not accrue when express lanes are imple mented | Easy | 5 – 10 Years |
| Bridge Tolls | Revenue generated from tolls on Bay Area bridges funds capital and operating projects that mitigate and | Capi tal Oper | State legislat ive and | Difficult | Less than 5 Years |
Contra Costa Transportation Authority 2016 Express Bus Study Update Page A93 43 Metropolitan Transportation Commission, Plan Bay Area, Final Financial Assumptions, July 2013, p. 5.
Original PDF, page 99
| Source | Description | Eligi ble Uses | Type of Appro vals | Difficulty of Impleme ntation | Implemen tation Timefram e |
|---|---|---|---|---|---|
| relieve traffic congestion on the bridges. MTC’s Plan Bay Area, the Regional Transportation Plan, assumes a $1 toll increase for non-carpool vehicles in FY 2018-19.44 Like the most recent Bay Area bridge toll increase, Regional Measure 2, an additional toll increase expenditure plan could include funds for Contra Costa’s express bus services. | ating | Voter Appro val | |||
| Regional Gas Tax | MTC’s Plan Bay Area includes a regional gas tax of 10 cents per gallon, with the assumption that this new revenue would be available in FY 2017-18. Funds generated by such a tax would likely be allocated back to the areas where the funds were generated based on metrics such registered vehicles, road miles, and population. Regional gas tax funds would likely be used for highway and roadway projects, with some funding for transit service. Contra Costa’s express bus services could be either directly eligible for this new revenue, or could benefit from roadway improvements funded with regional gas taxes. | Capi tal Oper ating | Voter Appro val | Difficult | 5 – 10 Years |
| Developm ent Fees | Developers pay a one-time fee from each new development project to pay for public facilities and services necessitated by development. A nexus study must demonstrate that the proposed capital projects or programs will mitigate the impacts of the development. | Capi tal Oper ating | Local legislat ive approv al | Medium | Less than 5 years |
| Local Public Transit Assessmen t District | Under Senate Bill 142, Transit Districts, municipal operators, or other public agencies operating transit, commuter rail, or intercity rail services may approve, by a two-thirds majority, to issue bonds and levy a fee on the special district for bond repayment. To be implemented, the levy may not be opposed by a majority of the properties | Capi tal | Transit agency and voter approv al | Difficult | Varies by local jurisdiction |
Contra Costa Transportation Authority 2016 Express Bus Study Update Page A94 44 Metropolitan Transportation Commission, Plan Bay Area, Final Financial Assumptions, July 2013, p. 4.
| Source | Description | Eligi ble Uses | Type of Appro vals | Difficulty of Impleme ntation | Implemen tation Timefram e |
|---|---|---|---|---|---|
| affected. Funds may only be used for capital costs. The area in the benefit district must be within a half mile of the center point of the transit station. Projects must provide special benefits to the parcels of land and improvements to land within the vicinity of the station. | |||||
| Parcel Taxes | Cities, counties, AC Transit, and BART can place a measure on the ballot to impose a parcel tax to generate funding for a specific purpose. A two- thirds vote of property owners is required for passage. | Capi tal Oper ating | Local legislat ive and voter approv al | Difficult | Varies by local jurisdiction |
| Property- Based Business Improvem ent District | Business owners in a specific area pay a fee to fund improvements and/or improve the quality of the area paying the fee. | Capi tal Oper ating | Appro val by majorit y of impact ed propert y owners | Medium | Varies by local jurisdiction |
| New Transporta tion Sales Taxes | Cities and counties have the ability to put a tax for transportation on the ballot depending upon their identified need. Funds can be used for operating and capital expenditures. An Expenditure Plan lays out the investments proposed for the tax, including programs and projects. A two-thirds vote of the electorate is required for passage. | Capi tal Oper ating | Local legislat ive and voter approv al | Difficult | Varies by local jurisdiction |
| Parking Taxes and Revenues | Parking taxes and revenues may be allocated for funding transit-supportive infrastructure improvements. | Capi tal Oper ating | Local legislat ive approv al | Medium | Varies by local jurisdiction |
| Private Funding | Private funding may be available for either infrastructure improvements (such as passenger amenities at bus stops) or for operating services. While not common, some developers or employers may provide funding to transit agencies to operate additional service to meet the needs of the employer or development, or to offset | Capi tal Oper ating | None | Easy | Varies by agency |
Contra Costa Transportation Authority 2016 Express Bus Study Update Page A95
| Source | Description | Eligi ble Uses | Type of Appro vals | Difficulty of Impleme ntation | Implemen tation Timefram e |
|---|---|---|---|---|---|
| fares not paid by the employee rider. Some restrictions on transit agencies providing “Charter Service” would need to be observed. |
Contra Costa Transportation Authority 2016 Express Bus Study Update Page A96
In the same set
The original file
Everything above is the content of the original document, published here as a web page so it can be read, searched, translated and used with a screen reader. The original PDF is kept as the authoritative record.